. 2018 Mar 1;9(1):890.
doi: 10.1038/s41467-018-03196-x.

De novo adipocyte differentiation from Pdgfrβ+ preadipocytes protects against pathologic visceral adipose expansion in obesity

Affiliations

De novo adipocyte differentiation from Pdgfrβ+ preadipocytes protects against pathologic visceral adipose expansion in obesity

Mengle Shao et al. Nat Commun. .

Abstract

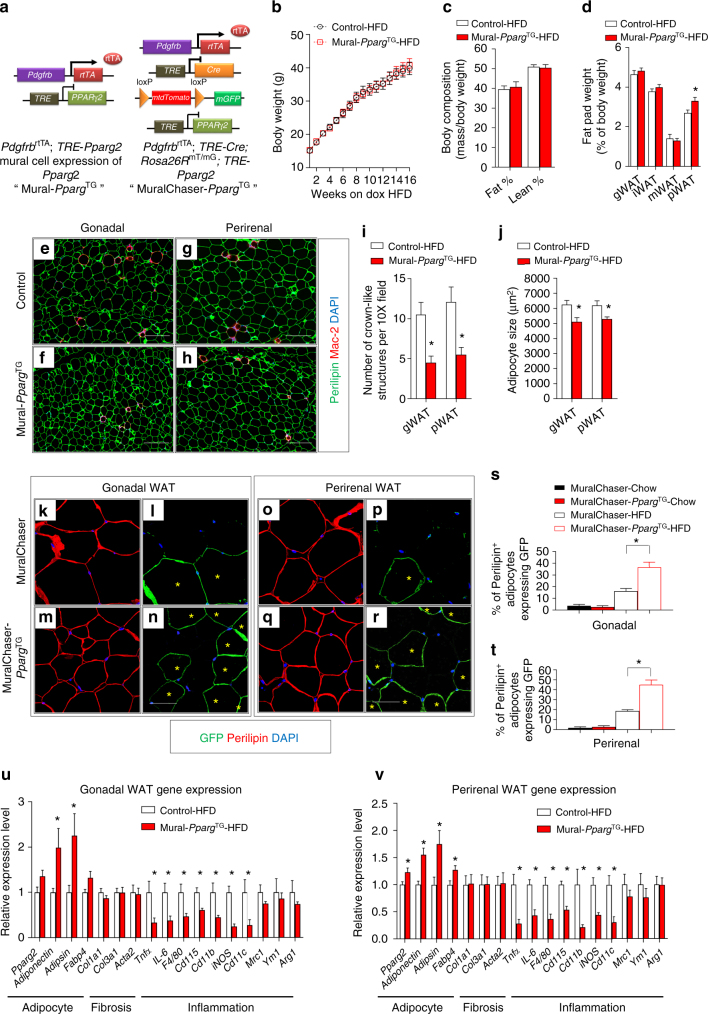
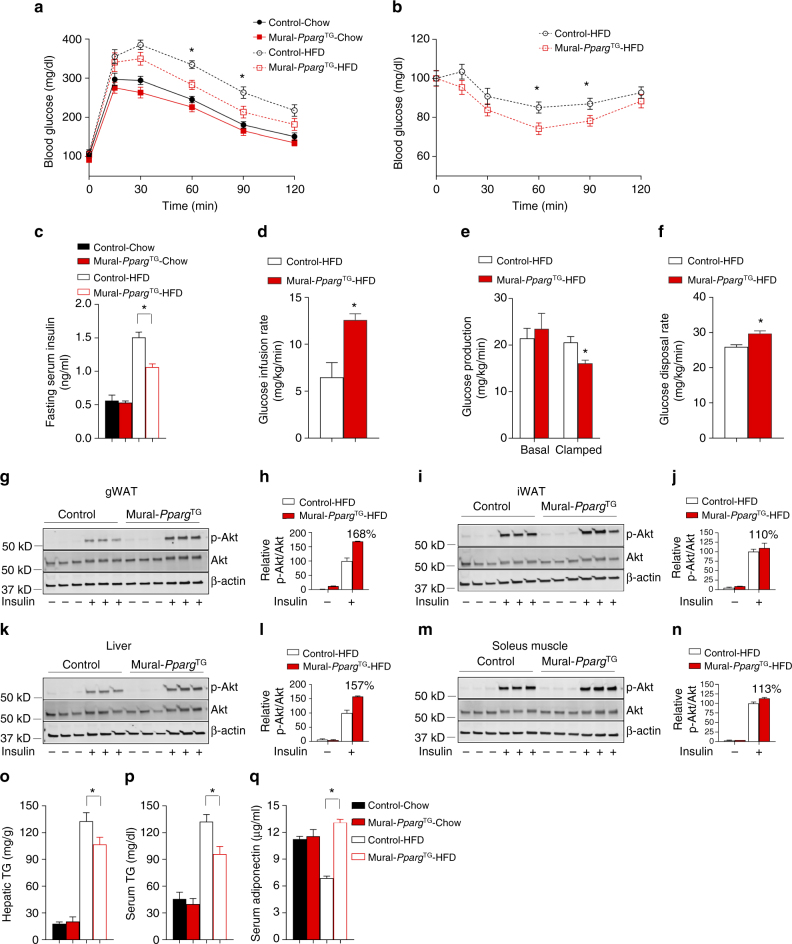
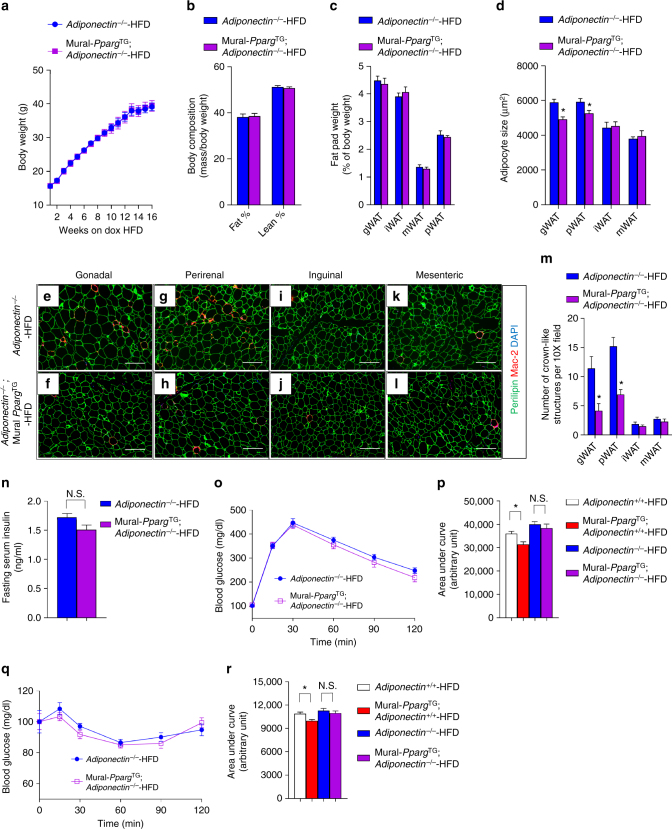
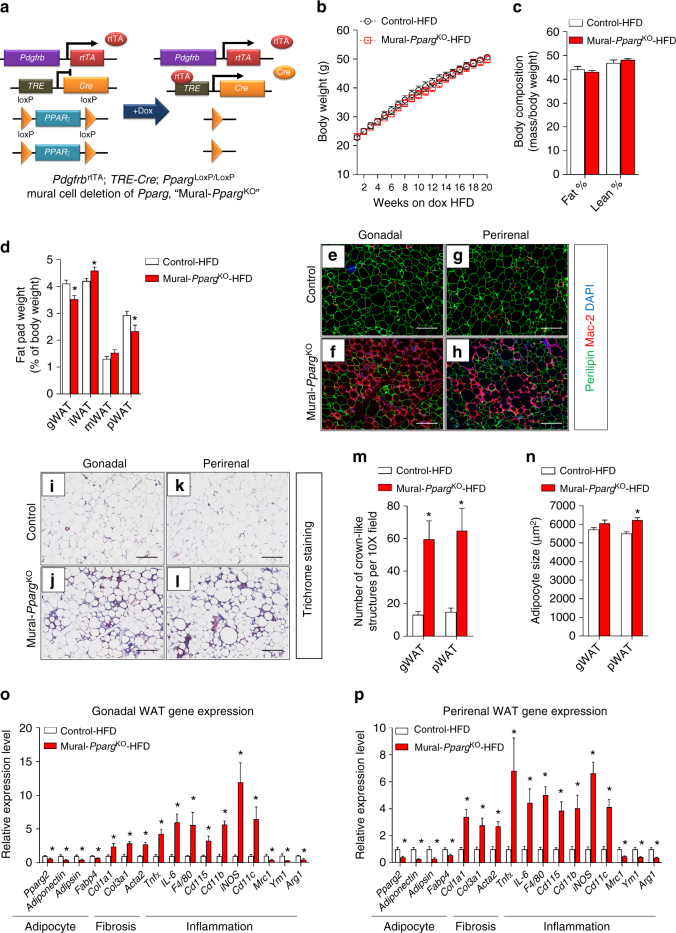
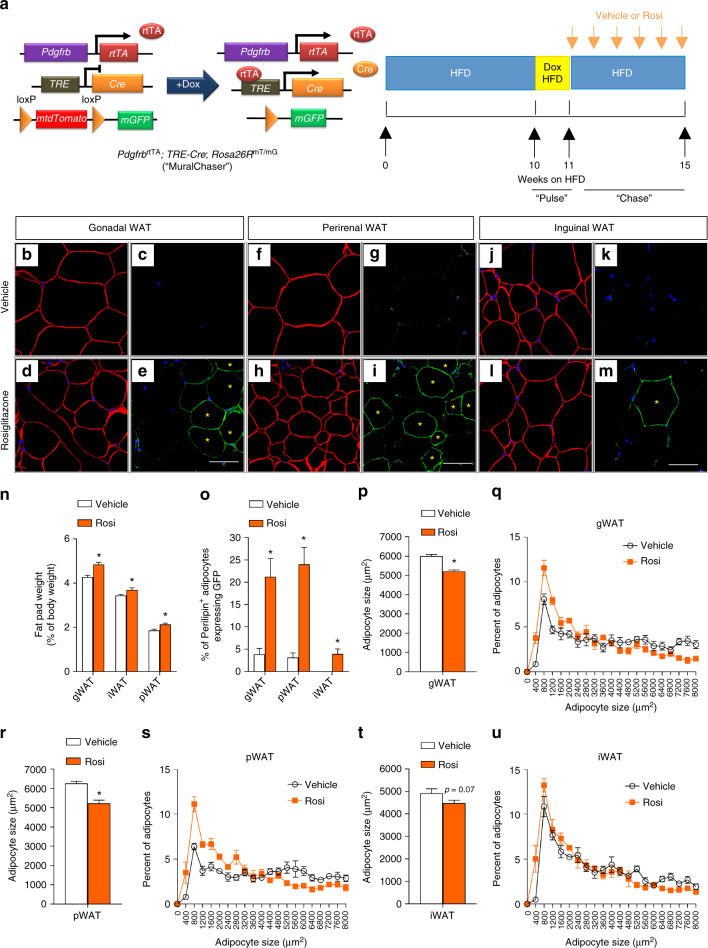
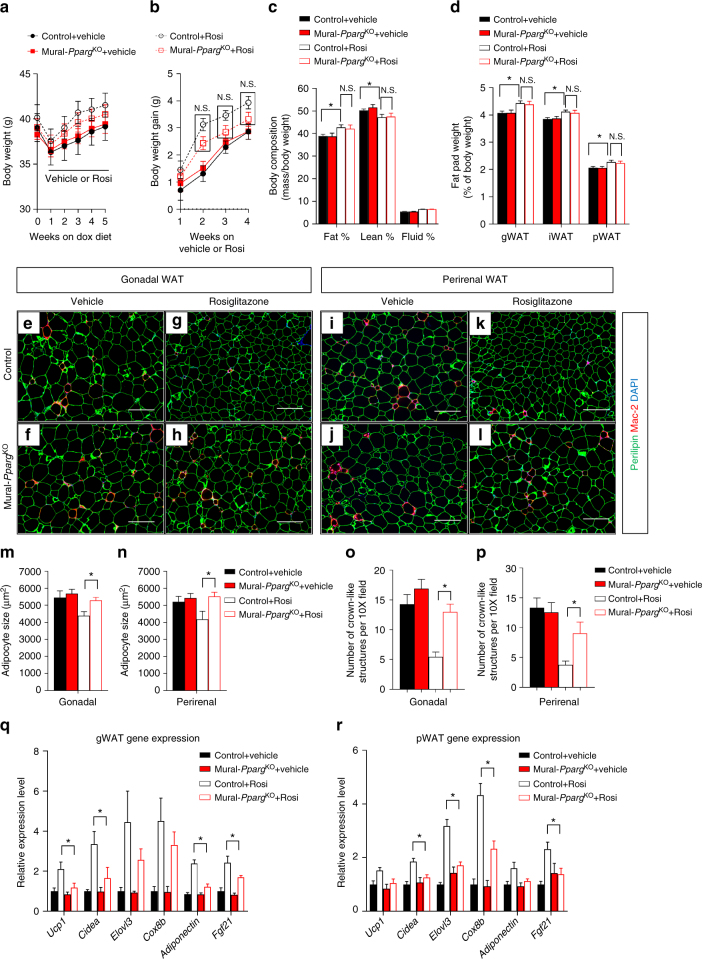
Pathologic expansion of white adipose tissue (WAT) in obesity is characterized by adipocyte hypertrophy, inflammation, and fibrosis; however, factors triggering this maladaptive remodeling are largely unknown. Here, we test the hypothesis that the potential to recruit new adipocytes from Pdgfrβ+ preadipocytes determines visceral WAT health in obesity. We manipulate levels of Pparg, the master regulator of adipogenesis, in Pdgfrβ+ precursors of adult mice. Increasing the adipogenic capacity of Pdgfrβ+ precursors through Pparg overexpression results in healthy visceral WAT expansion in obesity and adiponectin-dependent improvements in glucose homeostasis. Loss of mural cell Pparg triggers pathologic visceral WAT expansion upon high-fat diet feeding. Moreover, the ability of the TZD class of anti-diabetic drugs to promote healthy visceral WAT remodeling is dependent on mural cell Pparg. These data highlight the protective effects of de novo visceral adipocyte differentiation in these settings, and suggest Pdgfrβ+ adipocyte precursors as targets for therapeutic intervention in diabetes.


Conflict of interest statement

The authors declare no competing financial interests.

Figures

Fig. 1
Fig. 1
Mural Pparg overexpression drives healthy visceral WAT expansion in obesity. a PdgfrbrtTA; TRE-Pparg2 (Mural-PpargTG) mice are generated by breeding the Pdgfrb rtTA transgenic mice to animals expressing Pparg2 under the control of the tet-response element (TRE- Pparg2). Littermates carrying only PdgfrbrtTA or TRE-Pparg2 alleles were used as the control animals for Mural-PpargTG. PdgfrbrtTA; TRE-Cre; Rosa26RmT/mG; TRE-Pparg2 (MuralChaser-PpargTG) mice are generated by breeding the “MuralChaser” (PdgfrbrtTA; TRE-Cre; Rosa26RmT/mG) mice to animals carrying TRE-Pparg2 transgene. MuralChaser mice were used as control animals for MuralChaser-PpargTG. b Control and Mural-PpargTG mice were fed a standard chow diet until 6 weeks of age before being switched to dox-containing high-fat diet (HFD). Body weights were measured weekly following the onset of HFD feeding. Control-HFD, n = 8; Mural-PpargTG-HFD, n = 9. Data points represent mean + s.e.m. c Fat mass and lean mass (normalized to body weight) of control and Mural-PpargTG mice after 16 weeks of dox-HFD feeding. Control-HFD, n = 8; Mural-PpargTG -HFD, n = 9. Bars represent mean + s.e.m. d Fat pad weight (normalized to body weight) of control and Mural-PpargTG mice after 16 weeks of dox-HFD feeding. * denotes p < 0.05 from Student’s t-test. Control-HFD, n = 8; Mural-PpargTG-HFD, n = 9. Bars represent mean + s.e.m. eh Representative immunofluorescence staining of Perilipin (green) and Mac-2 (red) in e, f gonadal and g, h perirenal WAT paraffin sections obtained from control and Mural-PpargTG mice after 16 weeks of dox-HFD feeding. Scale bar, 200 μm. i Number of crown-like structures (Mac-2 positive) in the indicated depots from control and Mural-PpargTG mice after 16 weeks of dox-HFD feeding. * denotes p < 0.05 from Welch’s t-test. n = 24 randomly chosen ×10 magnification fields from six individual animals. Bars represent mean + s.e.m. j Average adipocyte size in indicated fat depots from control and Mural-PpargTG mice after 16 weeks of dox-HFD feeding. * denotes p < 0.05 from Student’s t-test. n = 6 per genotype. Bars represent mean + s.e.m. kr Representative ×63 magnification confocal immunofluorescence images of kn gonadal and or perirenal WAT sections from MuralChaser and MuralChaser-PpargTG mice after 16 weeks dox-diet feeding. Sections were stained with anti-GFP (green) and anti-Perilipin (red) antibodies and counterstained with DAPI (blue; nuclei). * indicates GFP-labeled perilipin-positive cells. Scale bar, 50 μm. st Percentage of perilipin-positive adipocytes expressing GFP in s gonadal and t perirenal WAT from MuralChaser and MuralChaser-PpargTG mice maintained on dox-diets for 16 weeks. Two-way ANOVA, *p < 0.05; n = 6 individual depots per group. Bars represent mean + s.e.m. u, v Relative mRNA levels of indicated genes in u gonadal and v perirenal WAT obtained from control and Mural-PpargTG mice after 16 weeks of dox-HFD feeding. * denotes p < 0.05 from Welch’s t-test. n = 6 per genotype. Bars represent mean + s.e.m.
Fig. 2
Fig. 2
Mural Pparg overexpression leads to metabolic benefits in obesity. a Glucose tolerance tests of control and Mural-PpargTG mice after 16 weeks of dox-diet feeding. Two-way ANOVA, *p < 0.05; Control-Chow, n = 7; Mural-PpargTG-Chow, n = 7; Control-HFD, n = 8; Mural-PpargTG-HFD, n = 9. Data points represent mean + s.e.m. b Insulin tolerance tests of control and Mural-PpargTG mice after 16 weeks of dox-HFD feeding. Student’s t-test, *p < 0.05; Control-HFD, n = 8; Mural-PpargTG-HFD, n = 9. Data points represent mean + s.e.m. c Six-hour fasting serum insulin levels in control and Mural-PpargTG mice after 16 weeks of dox-diet feeding. Two-way ANOVA, *p < 0.05; Control-Chow, n = 7; Mural-PpargTG-Chow, n = 7; Control-HFD, n = 8; Mural-PpargTG-HFD, n = 9. Bars represent mean + s.e.m. d The glucose infusion rate needed to maintain euglycemia (~137 mg/dl) during hyperinsulinemic–euglycemic clamp assays of conscious unrestrained control and Mural-PpargTG mice after 16 weeks of dox-HFD feeding. Student’s t-test, *p < 0.05; Control-HFD, n = 7; Mural-PpargTG-HFD, n = 5. Bars represent mean + s.e.m. e Basal and clamped rates of endogenous glucose production during hyperinsulinemic–euglycemic clamp assays of control and Mural-PpargTG mice after 16 weeks of dox-HFD feeding. Student’s t-test, *p < 0.05; Control-HFD, n = 7; Mural-PpargTG-HFD, n = 5. Bars represent mean + s.e.m. f Rates of glucose disposal during hyperinsulinemic–euglycemic clamp assays of control and Mural-PpargTG mice after 16 weeks of dox-HFD feeding. Student’s t-test, *p < 0.05; Control-HFD, n = 7; Mural-PpargTG -HFD, n = 5. Bars represent mean + s.e.m. gn Western blot analysis of phosphorylated Akt (pAkt), total Akt, and β-actin protein levels in tissue extracts of g, h gonadal WAT, i, j inguinal WAT, kl liver, and m, n soleus muscle from control and Mural-PpargTG mice after 16 weeks of dox-HFD feeding. For quantification, intensity of pAkt band is normalized to that of total Akt band. The mean value of pAkt/Akt intensity ratio of insulin-treated control mice samples were set as 100%. n = 3 individual mice per genotype. Bars represent mean + s.e.m. o Hepatic and p serum triglycerides levels in control and Mural-PpargTG mice after 16 weeks of dox-diet feeding. Two-way ANOVA, *p < 0.05; Control-Chow, n = 7; Mural-PpargTG-Chow, n = 7; Control-HFD, n = 8; Mural-PpargTG-HFD, n = 9. Bars represent mean + s.e.m. q Serum adiponectin levels in control and Mural-PpargTG mice after 16 weeks of dox-diet feeding. Two-way ANOVA, *p < 0.05; Control-Chow, n = 7; Mural-PpargTG-Chow, n = 7; Control-HFD, n = 8; Mural-PpargTG -HFD, n = 9. Bars represent mean + s.e.m.
Fig. 3
Fig. 3
The metabolic benefits of mural Pparg overexpression depend on adiponectin. a Adiponectin-deficient (Adiponectin−/−) mice and Adiponectin−/−; PdgfrbrtTA; TRE-Pparg2 (Adiponectin−/−; Mural-PpargTG) mice were fed a standard chow diet until 6 weeks of age before being switched to dox-containing HFD. Body weights were measured weekly following the onset of HFD feeding. n = 6 per genotype. Data points represent mean + s.e.m. b Fat mass and lean mass (normalized to body weight) of Adiponectin−/− and Adiponectin−/−; Mural-PpargTG mice after 16 weeks of dox-HFD feeding. n = 6 per genotype. Bars represent mean + s.e.m. c Average adipocyte size in indicated fat depots from control and Mural-PpargTG mice after 16 weeks of dox-diet feeding. Bars represent mean + s.e.m. d Fat pad weight (normalized to body weight) of Adiponectin−/− and Adiponectin−/−; Mural-PpargTG mice after 16 weeks of dox-HFD feeding. * denotes p < 0.05 from Student’s t-test. n = 6 per genotype. Bars represent mean + s.e.m. el Representative immunofluorescence staining of Perilipin (green) and Mac-2 (red) in e, f gonadal, g, h perirenal WAT, i, j inguinal WAT, and kl mesenteric WAT paraffin sections obtained from Adiponectin−/− and Adiponectin−/−; Mural-PpargTG mice after 16 weeks of dox-HFD feeding. Scale bar, 200 μm. m Numbers of crown-like structures (Mac-2 positive) in the indicated depots from Adiponectin−/− and Adiponectin−/−; Mural-PpargTG mice after 16 weeks of dox-HFD feeding. * denotes p < 0.05 from Welch’s t-test. n = 24 randomly chosen ×10 magnification fields from six individual animals. Bars represent mean + s.e.m. n Six-hour fasting serum insulin levels in Adiponectin−/− and Adiponectin−/−; Mural-PpargTG mice after 16 weeks of dox-diet feeding. n.s. denotes not statistically significant. n = 6 per genotype. Bars represent mean + s.e.m. o Glucose tolerance tests of Adiponectin−/− and Adiponectin−/−; Mural-PpargTG mice after 16 weeks of dox-diet feeding. n = 6 per genotype. Data points represent mean + s.e.m. p Glucose area under the curve measurements during glucose tolerance test from mice of indicated genotypes after 16 weeks of dox-diet feeding. Two-way ANOVA, *p < 0.05; n.s. denotes not statistically significant; Adiponectin+/+, n = 8; Adiponectin+/+; Mural-PpargTG, n = 9; Adiponectin−/−, n = 6; Adiponectin−/−; Mural-PpargTG, n = 6. Bars represent mean + s.e.m. q Insulin tolerance test of Adiponectin−/− and Adiponectin−/−; Mural-PpargTG mice after 16 weeks of dox-diet feeding. n = 6 per genotype. Data points represent mean + s.e.m. r Glucose area under the curve measurements during insulin tolerance test from mice of indicated genotypes after 16 weeks of dox-diet feeding. Two-way ANOVA, *p < 0.05; n.s. denotes not statistically significant; Adiponectin+/+, n = 8; Adiponectin+/+; Mural-PpargTG, n = 9; Adiponectin−/−, n = 6; Adiponectin−/−; Mural-PpargTG, n = 6. Bars represent mean + s.e.m.
Fig. 4
Fig. 4
Healthy visceral WAT expansion in obesity depends on mural Pparg expression. a PdgfrbrtTA; TRE-Cre; PpargloxP/loxP (Mural-PpargKO) mice are generated by breeding the PdgfrbrtTA transgenic mice to animals expressing Cre recombinase under the control of the tet-reponse element (TRE-Cre) and carrying floxed Pparg alleles (PpargloxP/loxP). Littermates carrying only PdgfrbrtTA and PpargloxP/loxP alleles (i.e. Cre) were used as the control animals. b Control and Mural-PpargKO mice were fed a standard chow diet until 8 weeks of age before being switched to dox-containing HFD for another 20 weeks. Body weights were measured weekly. Control-HFD, n = 14; Mural-PpargKO-HFD, n = 13. Data points represent mean + s.e.m. c Fat mass and lean mass (normalized to body weight) of control and Mural-PpargKO mice after 20 weeks of dox-diet feeding. n = 7 per genotype. Bars represent mean + s.e.m. d Fat pad weight (normalized to body weight) of control and Mural-PparγKO mice after 20 weeks of dox-HFD feeding. * denotes p < 0.05 from Student’s t-test. Control-HFD, n = 14; Mural-PpargKO-HFD, n = 13. Bars represent mean + s.e.m. eh Representative immunofluorescence staining of Perilipin (green) and Mac-2 (red) in e, f gonadal and g, h perirenal WAT paraffin sections obtained from control and Mural-PpargKO mice after 20 weeks of dox-diet feeding. Scale bar, 200 μm. il Representative trichrome staining of i, j gonadal and k, l perirenal WAT paraffin sections obtained from control and Mural-PpargKO mice after 20 weeks of dox-diet feeding. Scale bar, 200 μm. m Number of crown-like structures (Mac-2 positive) in the indicated depots obtained from control and Mural-PpargKO mice after 20 weeks of dox-HFD feeding. * denotes p < 0.05 from Welch’s t-test. n = 24 randomly chosen ×10 magnification fields from six individual animals. Bars represent mean + s.e.m. n Average adipocyte size in indicated fat depots from control and Mural-PpargKO mice after 20 weeks of dox-HFD feeding. * denotes p < 0.05 from Student’s t-test. Control-HFD, n = 8; Mural-PpargKO -HFD, n = 7. Bars represent mean + s.e.m. o, p Relative mRNA levels of indicted genes in o gonadal and p perirenal WAT obtained from control and Mural-PpargKO mice after 20 weeks of dox-chow diet feeding. * denotes p < 0.05 from Welch’s t-test. n = 6 per genotype. Bars represent mean + s.e.m.
Fig. 5
Fig. 5
Pdgfrβ+ precursors contribute to rosiglitazone-induced adipocyte hyperplasia. a MuralChaser mice were fed on standard chow diet until 6 weeks old before being switched to HFD for 10 weeks. Mice were then administrated with dox-containing HFD (600 mg/kg) for 7 days (“pulse”). Following the pulse-labeling period, mice were switched back to regular HFD for another 4 weeks during which vehicle (1% methylcellulose) or rosiglitazone (Rosi) (10 mg/kg/day) was delivered by gavage (“chase”). Paraffin sections of WAT from these animals were stained with anti-GFP (green) and anti-perilipin (red), then counterstained with DAPI (blue; nuclei). be Representative ×63 magnification confocal immunofluorescence images of gonadal WAT sections after rosiglitazone treatment (“chase”). * indicates GFP-labeled perilipin-positive cells. Scale bar, 50 μm. fi Representative ×63 magnification confocal immunofluorescence images of perirenal WAT sections after rosiglitazone treatment (“chase”). * indicates GFP-labeled perilipin-positive cells. Scale bar, 50 μm. jm Representative ×63 magnification confocal immunofluorescence images of inguinal WAT sections after rosiglitazone treatment (“chase”). * indicates GFP-labeled perilipin-positive cells. Scale bar, 50 μm. n Fat pad weight (normalized to body weight) of the indicated fat depots of mice treated with vehicle or rosiglitazone. Student’s t-test, *p < 0.05; n = 6 per group. Bars/data points represent mean + s.e.m. o Percentage of perilipin-positive adipocytes expressing GFP in the indicated fat depots of mice treated with vehicle or rosiglitazone. Welch’s t-test, *p < 0.05; n = 12 randomly chosen ×63 magnification fields from three individual reporter animals. Bars/data points represent mean + s.e.m. p Average adipocyte size and q distribution of adipocyte size in gonadal WAT from mice treated with vehicle or rosiglitazone. Student’s t-test, *p < 0.05; n = 6 per group. Bars/data points represent mean + s.e.m. r Average adipocyte size and s distribution of adipocyte size in perirenal WAT from mice treated with vehicle or rosiglitazone. Student’s t-test, *p < 0.05; n = 6 per group. Bars/data points represent mean + s.e.m. t Average adipocyte size and u distribution of adipocyte size in inguinal WAT from mice treated with vehicle or rosiglitazone. n = 6 per group. Bars/data points represent mean + s.e.m.
Fig. 6
Fig. 6
Mural cell Pparg is required for TZD-driven visceral WAT remodeling. a, b Control and Mural-PpargKO mice were treated as described in Supplemental Figure 10a. Body weights were measured weekly. Control + Vehicle, n = 8; Mural-PpargKO + Vehicle, n = 9; Control + Rosi, n = 11; Mural-PpargKO + Rosi, n = 19. n.s. denotes not statistically significant from two-way ANOVA. Data points represent mean + s.e.m. c Fat mass and lean mass (normalized to body weight) of control and Mural-PpargKO mice after 4 weeks of vehicle or rosiglitazone treatment. Control + Vehicle, n = 8; Mural-PpargKO + Vehicle, n = 8; Control + Rosi, n = 8; Mural-PpargKO + Rosi, n = 9. * denotes p < 0.05 from Student’s t-test. n.s. denotes not statistically significant. Bars represent mean + s.e.m. d Fat pad weight (normalized to body weight) of control and Mural-PpargKO mice after 4 weeks of vehicle or rosiglitazone treatment. Control + Vehicle, n = 8; Mural-PpargKO + Vehicle, n = 8; Control + Rosi, n = 8; Mural-PpargKO + Rosi, n = 9. * denotes p < 0.05 from Student’s t-test. n.s. denotes not statistically significant. Bars represent mean + s.e.m. el Representative immunofluorescence staining of Perilipin (green) and Mac-2 (red) in eh gonadal and il perirenal WAT paraffin sections obtained from control and Mural-PpargKO mice after 4 weeks of vehicle or rosiglitazone treatment. Scale bar, 200 μm. m, n Average adipocyte size in m gonadal and n perirenal WAT from control and Mural-PpargKO mice treated with vehicle or rosiglitazone. Two-way ANOVA, *p < 0.05; Control + Vehicle, n = 6; Mural-PpargKO + Vehicle, n = 6; Control + Rosi, n = 7; Mural-PpargKO + Rosi, n = 8. Bars represent mean + s.e.m. o, p Number of crown-like structures (Mac-2 positive) in o gonadal and p perirenal WAT from control and Mural-PpargKO mice treated with vehicle or rosiglitazone. Two-way ANOVA, *p < 0.05. n = 24 randomly chosen ×10 magnification fields from six individual animals. Bars represent mean + s.e.m. q, r Relative mRNA levels of indicated rosiglitazone-induced genes in q gonadal and r perirenal WAT obtained from control and Mural-PpargKO mice treated with vehicle or rosiglitazone. Two-way ANOVA, *p < 0.05. n = 6 per group. Bars represent mean + s.e.m.

References

    1. Appleton SL, et al. Diabetes and cardiovascular disease outcomes in the metabolically healthy obese phenotype: a cohort study. Diabetes Care. 2013;36:2388–2394. doi: 10.2337/dc12-1971. - DOI - PMC - PubMed
    1. Kissebah AH, Krakower GR. Regional adiposity and morbidity. Physiol. Rev. 1994;74:761–811. doi: 10.1152/physrev.1994.74.4.761. - DOI - PubMed
    1. Ohlson LO, et al. The influence of body fat distribution on the incidence of diabetes mellitus. 13.5 years of follow-up of the participants in the study of men born in 1913. Diabetes. 1985;34:1055–1058. doi: 10.2337/diab.34.10.1055. - DOI - PubMed
    1. Bergman RN, et al. Why visceral fat is bad: mechanisms of the metabolic syndrome. Obesity. 2006;14(Suppl. 1):16S–19S. doi: 10.1038/oby.2006.277. - DOI - PubMed
    1. Despres JP, Lemieux I. Abdominal obesity and metabolic syndrome. Nature. 2006;444:881–887. doi: 10.1038/nature05488. - DOI - PubMed

Publication types

MeSH terms

Substances