Clinical Trial
. 2018 Mar 1;9(1):896.
doi: 10.1038/s41467-018-03215-x.

Early circulating tumor DNA dynamics and clonal selection with palbociclib and fulvestrant for breast cancer

Affiliations
Clinical Trial

Early circulating tumor DNA dynamics and clonal selection with palbociclib and fulvestrant for breast cancer

Ben O'Leary et al. Nat Commun. .

Abstract

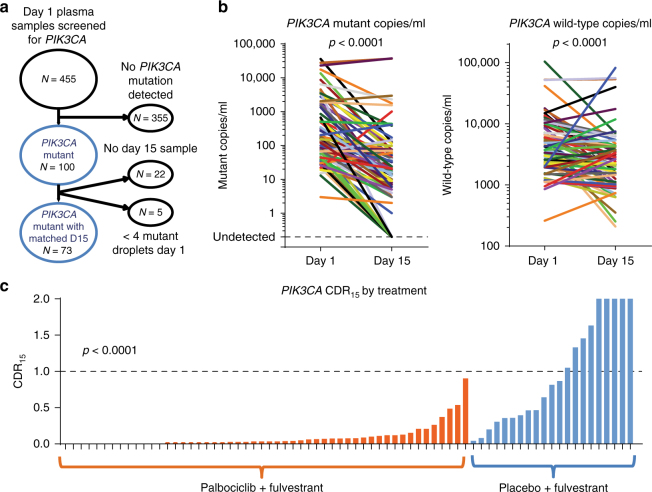
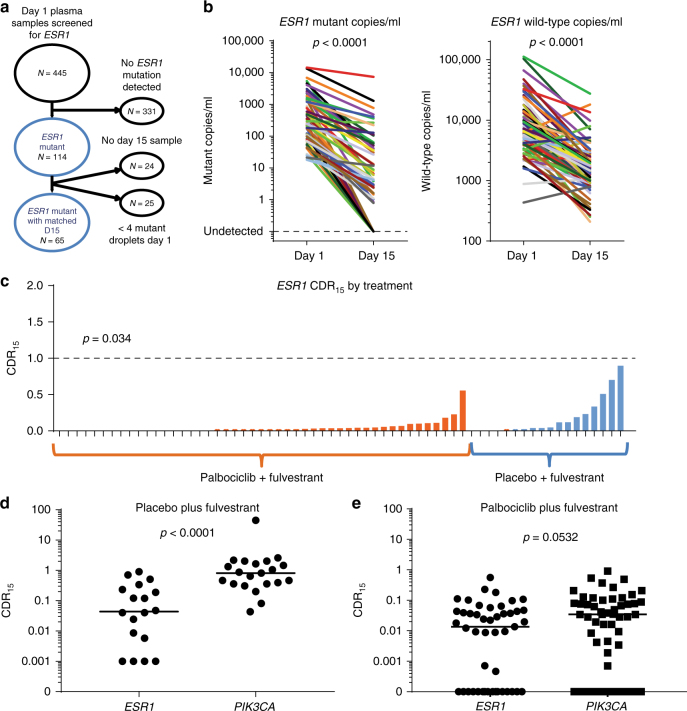
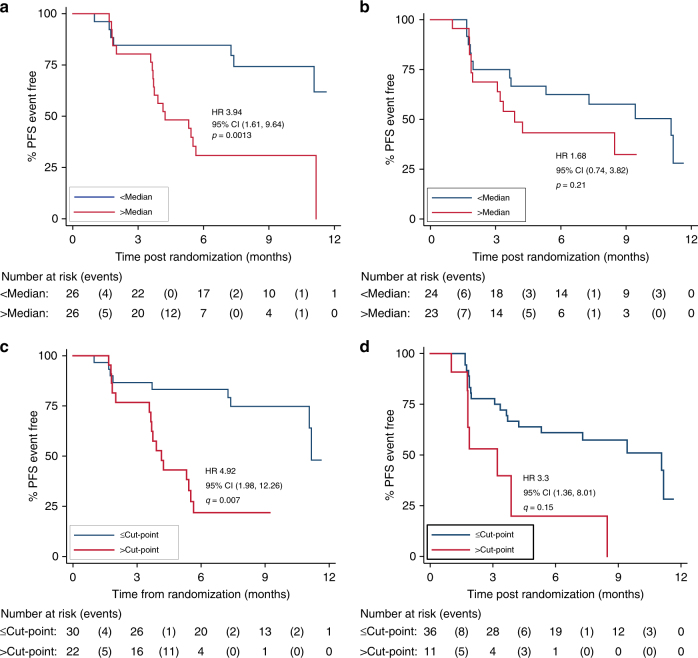
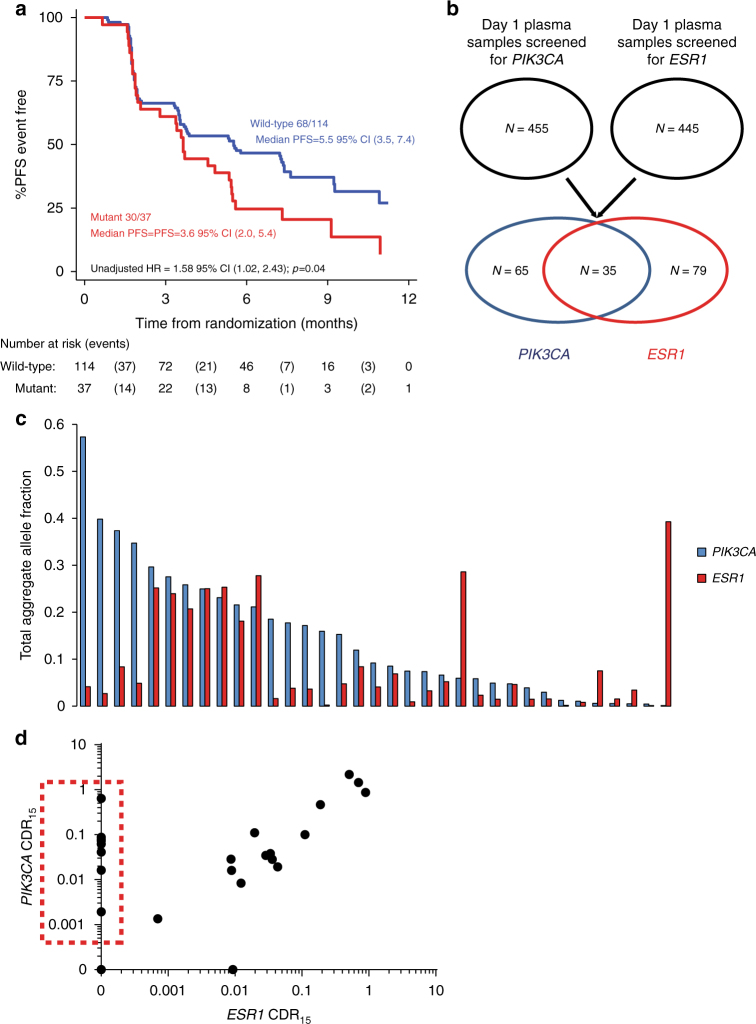
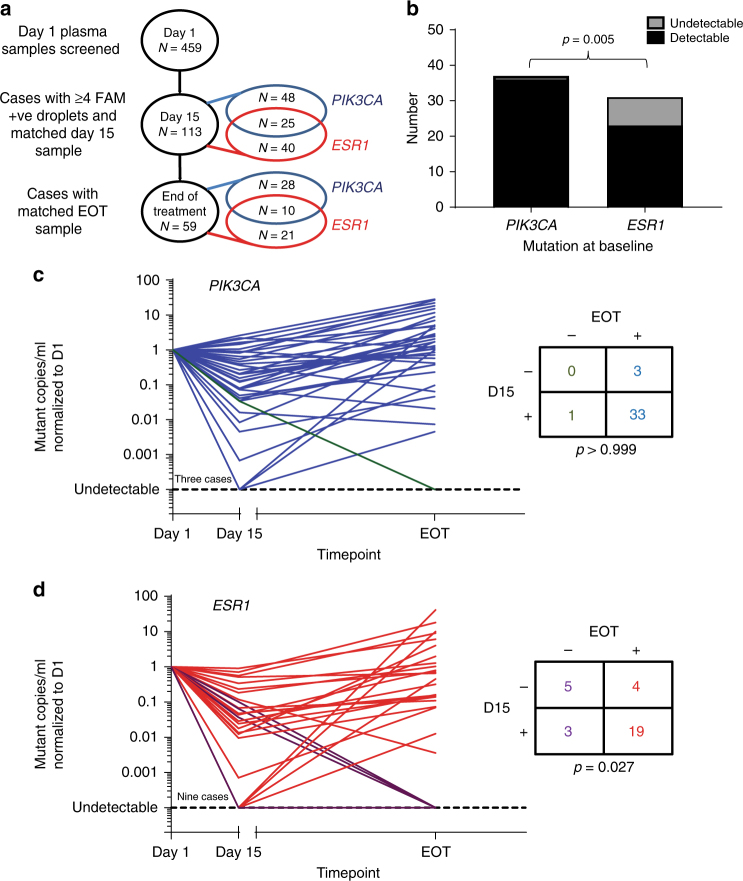
CDK4/6 inhibition substantially improves progression-free survival (PFS) for women with advanced estrogen receptor-positive breast cancer, although there are no predictive biomarkers. Early changes in circulating tumor DNA (ctDNA) level may provide early response prediction, but the impact of tumor heterogeneity is unknown. Here we use plasma samples from patients in the randomized phase III PALOMA-3 study of CDK4/6 inhibitor palbociclib and fulvestrant for women with advanced breast cancer and show that relative change in PIK3CA ctDNA level after 15 days treatment strongly predicts PFS on palbociclib and fulvestrant (hazard ratio 3.94, log-rank p = 0.0013). ESR1 mutations selected by prior hormone therapy are shown to be frequently sub clonal, with ESR1 ctDNA dynamics offering limited prediction of clinical outcome. These results suggest that early ctDNA dynamics may provide a robust biomarker for CDK4/6 inhibitors, with early ctDNA dynamics demonstrating divergent response of tumor sub clones to treatment.


Conflict of interest statement

B.O’L. received research funding from Pfizer (Inst). M.B. purchased stock from Randox Laboratories. X.H., Y.L., C.H.B., and M.K. are Pfizer employees and have Pfizer stock. M.C. received honoraria from Agendia, Dompe Farmaceutici, Celgene, Pfizer and has a consulting or advisory role in Dompe Farmaceutici, Cynvenio Biosystems, and Newomics. J.M.B. received research funding from AstraZeneca (Inst), Pfizer (Inst), Janssen Cilag (Inst), Novartis (Inst), Roche (Inst), and Clovis Oncology (Inst). N.C.T. has a consulting or advisory role in Roche, Pfizer, Novartis, AstraZeneca, and received research funding from Pfizer (Inst), Roche (Inst), and AstraZeneca. The remaining authors declare no competing financial interests.

Figures

Fig. 1
Fig. 1
Palbociclib and fulvestrant suppresses ctDNA after two weeks of treatment. a CONSORT diagram of plasma samples analyzed from PALOMA-3 for PIK3CA mutation with droplet digital PCR assays. b Dynamics of PIK3CA mutant and wild-type DNA copies/ml between day 1 and day 15 of treatment, n = 73, median day15:day1 ratio for mutant 0.076, median ratio for wild-type 0.54, p < 0.0001, Wilcoxon signed-rank test. c Circulating DNA ratio day15 copies/ml relative to day 1 copies/ml (CDR15) for circulating PIK3CA mutation split by treatment. p value Mann–Whitney test comparison between treatments. Lines are at median
Fig. 2
Fig. 2
ESR1 mutant sub clones have different early ctDNA dynamics to PIK3CA mutations. a CONSORT diagram for samples from PALOMA-3 used for the ESR1 mutation analysis. b Dynamics of ESR1 mutant and wild-type DNA copies/ml between day 1 and day 15 of treatment, n = 65, median ratio for mutant 0.022, median ratio for wild-type 0.21, p value Wilcoxon signed-rank test. c Mutant ESR1 CDR15 split by treatment. p value Mann–Whitney test comparing treatments. d CDR15 for PIK3CA mutations vs ESR1 mutations in patients randomized to fulvestrant plus placebo. p value Mann–Whitney test. Line at median. e CDR15 for PIK3CA mutations vs ESR1 mutations in patients receiving palbociclib plus fulvestrant. p value Mann–Whitney test. Line at median
Fig. 3
Fig. 3
Early PIK3CA ctDNA dynamics predict progression-free survival (PFS) on palbociclib and fulvestrant more strongly than ESR1 dynamics. a Kaplan–Meier plot for PFS of patients randomized to palbociclib and fulvestrant split by median PIK3CA CDR15. b Kaplan–Meier plot for PFS of patients randomized to palbociclib and fulvestrant split by median ESR1 CDR15. c Kaplan–Meier plot for PFS of patients receiving palbociclib and fulvestrant split by high or low PIK3CA CDR15 using an optimized cut-off calculated with Harrell’s c-index. q value log-rank test corrected for false discovery with Benjamini–Hochberg. d Kaplan–Meier plot for PFS of patients receiving palbociclib and fulvestrant split by high or low ESR1 CDR15 using an optimized cut-off calculated with Harrell’s c-index. q value log-rank test corrected for false discovery with Benjamini–Hochberg
Fig. 4
Fig. 4
ESR1 mutations may be sub clonal with distinct response to therapy. a Kaplan–Meier curves for PFS of patients with and without ESR1 mutations in day 1 baseline plasma randomized to placebo and fulvestrant in the PALOMA-3 trial, n = 151, updated from ref. . b Overlap of baseline plasma PIK3CA and ESR1 mutations. c Baseline day 1 allele fraction comparison of aggregate PIK3CA mutations and aggregate ESR1 mutations in patients with mutations detected in both genes, n = 35. d Comparison of CDR15 for PIK3CA mutation and ESR1 mutation in the same patient plasma samples, n = 25. The red dashed box highlights patients with loss of ESR1 mutation in plasma after 15 days treatment where PIK3CA mutation remained detectable
Fig. 5
Fig. 5
Clonal composition at relapse is anticipated by early ctDNA dynamics. a Samples with PIK3CA and ESR1 mutations used in longitudinal clonal analysis. b Comparison of PIK3CA mutation and ESR1 mutation detection at end of treatment. p value two sample t test. c Spider plot for 37 patients with PIK3CA mutation in longitudinal clonality analysis. Mutant copies/ml normalized to day 1. Lines are colored as for the accompanying contingency table, patients with detectable end of treatment mutation colored blue and undetectable colored green. p value Fisher’s exact test. d Spider plot for 31 patients with ESR1 mutation in longitudinal clonality analysis. Mutant copies/ml are normalized to the value at day 1. Lines are colored as for the accompanying contingency table, patients with detectable end of treatment mutation colored red and undetectable colored purple. p value Fisher’s exact test

Comment in

References

    1. Dawson SJ, et al. Analysis of circulating tumor DNA to monitor metastatic breast cancer. New Engl. J. Med. 2013;368:1199–1209. doi: 10.1056/NEJMoa1213261. - DOI - PubMed
    1. Murtaza M, et al. Non-invasive analysis of acquired resistance to cancer therapy by sequencing of plasma DNA. Nature. 2013;497:108–112. doi: 10.1038/nature12065. - DOI - PubMed
    1. Forshew T, et al. Noninvasive Identification and monitoring of cancer mutations by targeted deep sequencing of plasma DNA. Sci. Transl. Med. 2012;4:136ra168. doi: 10.1126/scitranslmed.3003726. - DOI - PubMed
    1. Mok T, et al. Detection and dynamic changes of egfr mutations from circulating tumor DNA as a predictor of survival outcomes in NSCLC patients treated with first-line intercalated erlotinib and chemotherapy. Clin. Cancer Res. 2015;21:3196–3203. doi: 10.1158/1078-0432.CCR-14-2594. - DOI - PubMed
    1. Garcia-Murillas I, et al. Mutation tracking in circulating tumor DNA predicts relapse in early breast cancer. Sci. Transl. Med. 2015;7:302ra133. doi: 10.1126/scitranslmed.aab0021. - DOI - PubMed

Publication types

MeSH terms