. 2018 Mar 1;8(1):3872.
doi: 10.1038/s41598-018-22209-9.

Disturbance Regimes Drive The Diversity of Regional Floristic Pools Across Guianan Rainforest Landscapes

Affiliations

Disturbance Regimes Drive The Diversity of Regional Floristic Pools Across Guianan Rainforest Landscapes

Stéphane Guitet et al. Sci Rep. .

Erratum in

Abstract

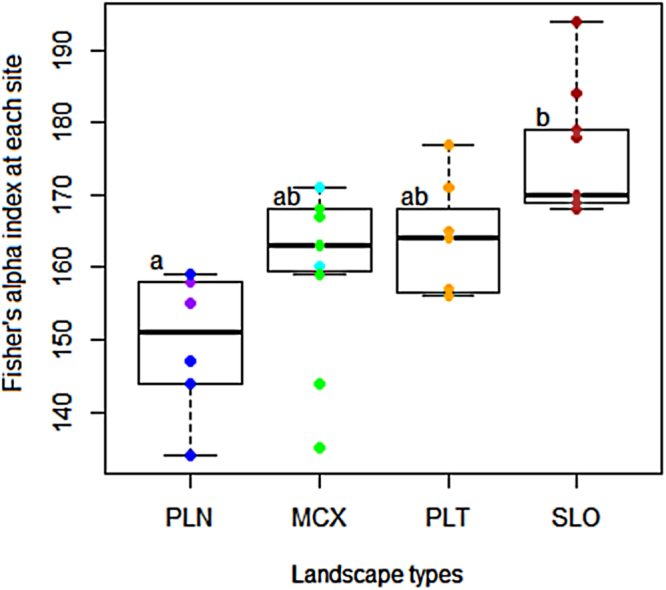
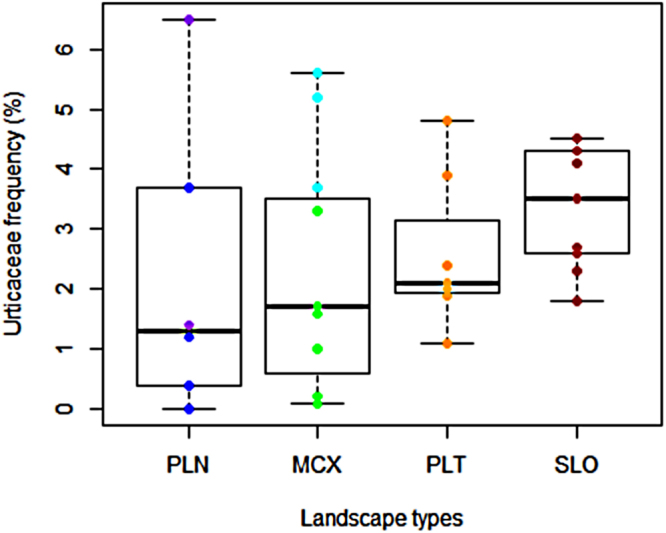
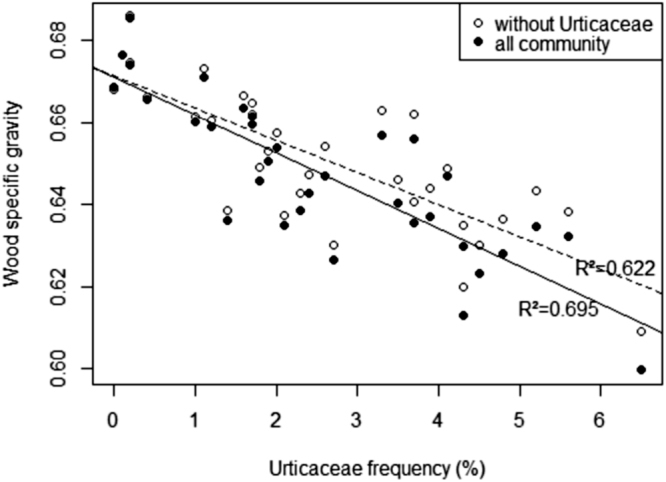
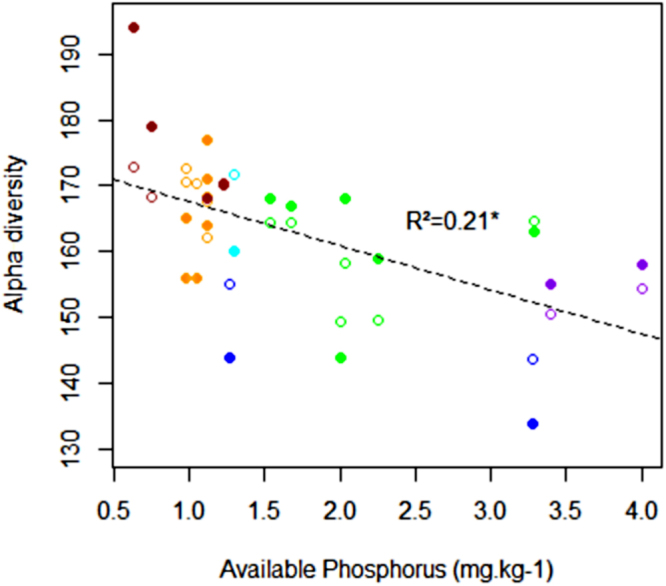
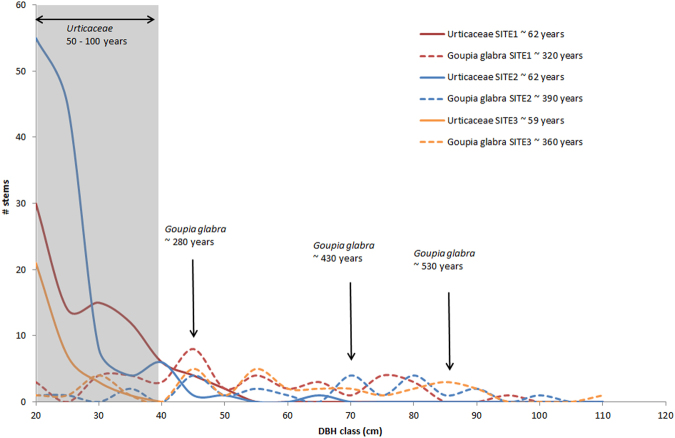
Disturbances control rainforest dynamics, and, according to the intermediate disturbance hypothesis (IDH), disturbance regime is a key driver of local diversity. Variations in disturbance regimes and their consequences on regional diversity at broad spatiotemporal scales are still poorly understood. Using multidisciplinary large-scale inventories and LiDAR acquisitions, we developed a robust indicator of disturbance regimes based on the frequency of a few early successional and widely distributed pioneer species. We demonstrate at the landscape scale that tree-species diversity and disturbance regimes vary with climate and relief. Significant relationships between the disturbance indicator, tree-species diversity and soil phosphorus content agree with the hypothesis that rainforest diversity is controlled both by disturbance regimes and long-term ecosystem stability. These effects explain the broad-scale patterns of floristic diversity observed between landscapes. In fact, species-rich forests in highlands, which have benefited from long-term stability combined with a moderate and regular regime of local disturbances, contrast with less diversified forests on recently shaped lowlands, which have undergone more recent changes and irregular dynamics. These results suggest that taking the current disturbance regime into account and including geomorphological stratifications in climate-vegetation models may be an effective way to improve the prediction of changes in species diversity under climate change.


Conflict of interest statement

The authors declare no competing interests.

Figures

Figure 1
Figure 1
Variation in tree species diversity (site scale) according to geomorphological landscape categories. PLN stands for coastal plains (in blue) and inland plains (in purple), MCX stands for multiconvex reliefs with hills (in green) and large valleys (in cyan), PLT stands for tablelands (in orange) and SLO stands for all-slope relief (in brown). Letters indicate between-group significant differences based on the HSD test.
Figure 2
Figure 2
Variation in Urticaceae frequency expressed as the proportion of stems (site scale) according to geomorphological landscape categories. The different colours indicate the categories of relief (see legend of Fig. 1).
Figure 3
Figure 3
Correlation between mean wood specific gravity and Urticaceae frequency at the site scale. The black circles indicate the WSG of the whole-tree community, and the empty circles indicate mean WSG after excluding Urticaceae.
Figure 4
Figure 4
Relationship between Urticaceae frequency (proportion of stems) and Fisher’s alpha diversity index for the whole dataset (33 sites). Full circles represent mean Fisher’s alpha values, and vertical lines show the range of Fisher’s alpha simulations. Colours show the relief categories (see legend of Fig. 1). The solid black line shows the disturbance effect on Fisher’s alpha at maximum likelihood. The grey portion indicates the confidence intervals at 95% from the Bayesian inference. The dashed lines indicate the same effect and confidence intervals if two extreme sites (indicated by *) were removed.
Figure 5
Figure 5
Correlation between alpha diversity at the site scale and Bray-2 extractable phosphorus. Full circles represent measurements, and empty circles represent the values predicted by the best predictive model, including phosphorus and disturbance effects (first order and second order for Urticaceae frequency). Colours indicate the relief categories (see legend of Fig. 1), and the dashed line represents the effects of phosphorus alone.
Figure 6
Figure 6
Examples of diameter distribution of short-lived pioneers (solid lines: Urticaceae) and a long-lived pioneer (dashed lines: Goupia Glabra) at 3 sites. Sites 1 and 2 have a similar pioneer frequency (3.6%) but different Urticaceae frequency (1.6% and 3.5%, respectively). Site 3 has a similar Urticaceae frequency as does site 2 (3.7% vs 3.5%) but a higher pioneer frequency (11.5%). The estimated mean ages of the different cohorts (indicated with arrows) were inferred from the growth rate and the methodology described previously. The mean ages of the all populations were estimated from the diameter distributions and are listed in the key in the top-right corner of the figure.
Figure 7
Figure 7
Location of the study sites across French Guiana. Transects are in black, focal sites with LiDAR cover are in white, and colours indicate the main geomorphological landscape categories across French Guiana. This map was modified from a previous version using ArcMap10.1 (http://esri.com). The abbreviations in brackets indicate the main landscape categories shown in the other figures.
Figure 8
Figure 8
Canopy height model generated from LiDAR acquisitions at two focal sites. The percentages of gaps were computed for the five buffer zones (in red) surrounding the line transects (in orange) using ArcMap 10.1 (http://esri.com).

References

    1. Sheil D. Disturbance and distributions: avoiding exclusion in a warming world. Ecology and Society. 2016;21(1):10. doi: 10.5751/ES-07920-210110. - DOI
    1. Catford JA, et al. The intermediate disturbance hypothesis and plant invasions: Implications for species richness and management. Perspectives in Plant Ecology, Evolution and Systematics. 2012;14(3):231–241. doi: 10.1016/j.ppees.2011.12.002. - DOI
    1. Fox JW. The intermediate disturbance hypothesis should be abandoned. Trends Ecol. Evol. 2013;28(2):86–92. doi: 10.1016/j.tree.2012.08.014. - DOI - PubMed
    1. Sheil D, Burslem D. Defining and defending Connell’s intermediate disturbance hypothesis: a response to Fox. Trends Ecol. Evol. 2013;28(10):571–572. doi: 10.1016/j.tree.2013.07.006. - DOI - PubMed
    1. Connell JH. Diversity in tropical rain forests and coral reefs. Science. 1978;199(4335):1302–1310. doi: 10.1126/science.199.4335.1302. - DOI - PubMed

Publication types