. 2016 Sep;21(7):2275-2291.
doi: 10.3934/dcdsb.2016047.

Controlling Stochasticity in Epithelial-Mesenchymal Transition Through Multiple Intermediate Cellular States

Affiliations

Controlling Stochasticity in Epithelial-Mesenchymal Transition Through Multiple Intermediate Cellular States

Catherine Ha Ta et al. Discrete Continuous Dyn Syst Ser B. 2016 Sep.

Abstract

Epithelial-mesenchymal transition (EMT) is an instance of cellular plasticity that plays critical roles in development, regeneration and cancer progression. Recent studies indicate that the transition between epithelial and mesenchymal states is a multi-step and reversible process in which several intermediate phenotypes might coexist. These intermediate states correspond to various forms of stem-like cells in the EMT system, but the function of the multi-step transition or the multiple stem cell phenotypes is unclear. Here, we use mathematical models to show that multiple intermediate phenotypes in the EMT system help to attenuate the overall fluctuations of the cell population in terms of phenotypic compositions, thereby stabilizing a heterogeneous cell population in the EMT spectrum. We found that the ability of the system to attenuate noise on the intermediate states depends on the number of intermediate states, indicating the stem-cell population is more stable when it has more sub-states. Our study reveals a novel advantage of multiple intermediate EMT phenotypes in terms of systems design, and it sheds light on the general design principle of heterogeneous stem cell population.

Keywords: Noise attenuation; cellular plasticity; heterogeneous cell population; multi-step EMT; multiple intermediate phenotypes; stem cell dynamics.


Figures

Figure 1
Figure 1
Four population dynamics models for four distinct EMT systems: two-state, three-state, four-state, and five-state transitions. In each model, E denotes the epithelial population, M mesenchymal population, and Ii the population corresponding to the ith intermediate state. In each model, the blue arrows describe the transitions of cells between two populations, where the arrow heads describe the direction of each transition. The black arrows indicate cell death, the yellow arrows the self-renewal of (stem) cells in the intermediate states, and the green arrows that point towards the mesenchymal population indicate a constant influx of cells into this population.
Figure 2
Figure 2
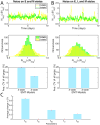
Comparison of the noise attenuation property between the two-state and three-state EMT systems in terms of the effects on the mesenchymal population size. A) Multiplicative noise is introduced to the epithelial and mesenchymal populations. B) Multiplicative noise is introduced to the epithelial, intermediate (three-state system), and mesenchymal populations. Top two panels are the time-course trajectories that represent the normalized number of mesenchymal cells NM/μ(NM) over a period of 10 days. To obtain the normalization, we perform stochastic simulations on the steady state population of mesenchymal cells, then divide the mesenchymal population size at each time point by its mean value obtained over the 10-day period. In the middle two panels, the normalized mesenchymal population size is plotted against the number of times that particular size occurs. Yellow: two-state EMT, green: three-state EMT. Bottom two panels display the quantification of the noise attenuation performance of the two-state and three-state systems using the mean and standard deviation of the coefficients of variation (CV) of the mesenchymal population. The mean is plotted here in the form of a bar graph (blue), while the standard deviation is described by the red error bar.
Figure 3
Figure 3
Comparison of the noise attenuation property between the two-state and three-state EMT systems in terms of the effects on the epithelial population size. A) Multiplicative noise is introduced to epithelial and mesenchymal populations. B) Multiplicative noise is introduced to the epithelial, intermediate (three-state system), and mesenchymal populations. Top two panels are the time-course trajectories that represent the normalized number of epithelial cells NE/μ(NE) over a period of 10 days. Middle two panels illustrate the distribution of the different population sizes of the normalized epithelial population. Here, the normalized epithelial population size is plotted against the number of times that particular size occurs. The color coding scheme for each system is similar to that of Figure 2. Bottom two panels display the quantification of the noise attenuation performance of the two-state and three-state systems.
Figure 4
Figure 4
Comparison of the noise attenuation property between the two-state and three-state EMT systems on the average population size. A) Noise is introduced to epithelial and mesenchymal populations. B) Noise is introduced to the epithelial, intermediate (three-state system), and mesenchymal populations. Top panels: trajectories of normalized average number of cells Navg/μ(Navg) over 10 days. Middle panels: distribution of the different sizes of the normalized average population using the color coding scheme of Figure 2. Bottom panels: quantification of the noise attenuation performance of both systems. C) Sensitivity analysis of the parameters representing unique cell transition rates in the three-state EMT system. Here, we plot the mean of the average change in the average CV as bar graphs (blue) accompanied by red error bars that describe the standard deviation of the average change.
Figure 5
Figure 5
Comparison of the noise attenuation property between the three-state, four-state, and five-state EMT systems in terms of the effects on the mesenchymal population size. A) Multiplicative noise is introduced to epithelial and mesenchymal populations. B) Multiplicative noise is introduced to the epithelial, mesenchymal, and one intermediate populations. C) Multiplicative noise is introduced to all the populations. Top three panels are the time-course trajectories that represent the normalized number of mesenchymal cells NM/μ(NM) over a period of 10 days. To obtain the normalization, we perform similar stochastic simulations to those in Figures 2-4. Middle three panels illustrate the distribution of the different population sizes of the normalized mesenchymal population. Here, the normalized mesenchymal population size is plotted against the number of times that particular size occurs. Green: three-state EMT, blue: four-state EMT, red: five-state EMT. Bottom three panels display the quantification of the noise attenuation performance of the three-state, four-state, and five-state systems.
Figure 6
Figure 6
Comparison of the noise attenuation property between the three-state, four-state, and five-state EMT systems in terms of the effects on the average intermediate population size. A) Multiplicative noise is introduced to epithelial and mesenchymal populations. B) Multiplicative noise is introduced to the epithelial, mesenchymal, and one intermediate populations. C) Multiplicative noise is introduced to all the populations. Top three panels are the time-course trajectories that represent the normalized average number of cells taken over all the intermediate states NI,avg/μ(NI,avg) over a period of 10 days. Middle three panels illustrate the distribution of the different population sizes of the normalized average intermediate population. Here, the normalized average intermediate population size is plotted against the number of times that particular size occurs. The color coding scheme for each system is similar to that of Figure 5. Bottom three panels display the quantification of the noise attenuation performance of the three-state, four-state, and five-state systems.
Figure 7
Figure 7
Comparison of the noise attenuation property between the three-state, four-state, and five-state EMT systems in terms of the effects on the epithelial population size. A) Multiplicative noise is introduced to epithelial and mesenchymal populations. B) Multiplicative noise is introduced to the epithelial, mesenchymal, and one intermediate populations. C) Multiplicative noise is introduced to all the populations. Top three panels are the time-course trajectories that represent the normalized number of epithelial cells NE/μ(NE) over a period of 10 days. Middle three panels illustrate the distribution of the different population sizes of the normalized epithelial population. Here, the normalized epithelial population size is plotted against the number of times that particular size occurs. The color coding scheme for each system is similar to that of Figure 5. Bottom three panels display the quantification of the noise attenuation performance of the three-state, four-state, and five-state systems.
Figure 8
Figure 8
Comparison of the noise attenuation property between the three-state, four-state, and five-state EMT systems in terms of the effects on the average population size. A) Multiplicative noise is introduced to epithelial and mesenchymal populations. B) Multiplicative noise is introduced to the epithelial, mesenchymal, and one intermediate populations. C) Multiplicative noise is introduced to all the populations. Top three panels are the time-course trajectories that represent the normalized average number of cells Navg/μ(Navg) over a period of 10 days. Middle three panels illustrate the distribution of the different population sizes of the normalized average population. The color coding scheme for each system is similar to that of Figure 5. Bottom three panels display the quantification of the noise attenuation performance of all the EMT systems. D) Sensitivity analysis of the parameters representing unique cell transition rates in the five-state EMT system. Here, we plot the mean of the average change in the average CV as bar graphs (blue) accompanied by red error bars that describe the standard deviation of the average change.

References

    1. Baulida J, Garcia de Herreros A. Snail1-driven plasticity of epithelial and mesenchymal cells sustains cancer malignancy. Biochim Biophys Acta. 2015;1856:55–61. - PubMed
    1. Brabletz T, Jung A, Reu S, et al. Variable beta-catenin expression in colorectal cancers indicates tumor progression driven by the tumor environment. Proc Natl Acad Sci U S A. 2001;98:10356–10361. - PMC - PubMed
    1. Cai AQ, Radtke K, Linville A, et al. Cellular retinoic acid-binding proteins are essential for hindbrain patterning and signal robustness in zebrafish. Development. 2012;139:2150–2155. - PMC - PubMed
    1. Chang HH, Hemberg M, Barahona M, et al. Transcriptome-wide noise controls lineage choice in mammalian progenitor cells. Nature. 2008;453:544–547. - PMC - PubMed
    1. Chen J, Han Q, Pei D. EMT and MET as paradigms for cell fate switching. J Mol Cell Biol. 2012;4:66–69. - PubMed