

Seasonal Influenza Forecasting in Real Time Using the Incidence Decay With Exponential Adjustment Model
- PMID: 29497629
- PMCID: PMC5781299
- DOI: 10.1093/ofid/ofx166
Seasonal Influenza Forecasting in Real Time Using the Incidence Decay With Exponential Adjustment Model
Abstract
Background: Seasonal influenza epidemics occur frequently. Rapid characterization of seasonal dynamics and forecasting of epidemic peaks and final sizes could help support real-time decision-making related to vaccination and other control measures. Real-time forecasting remains challenging.
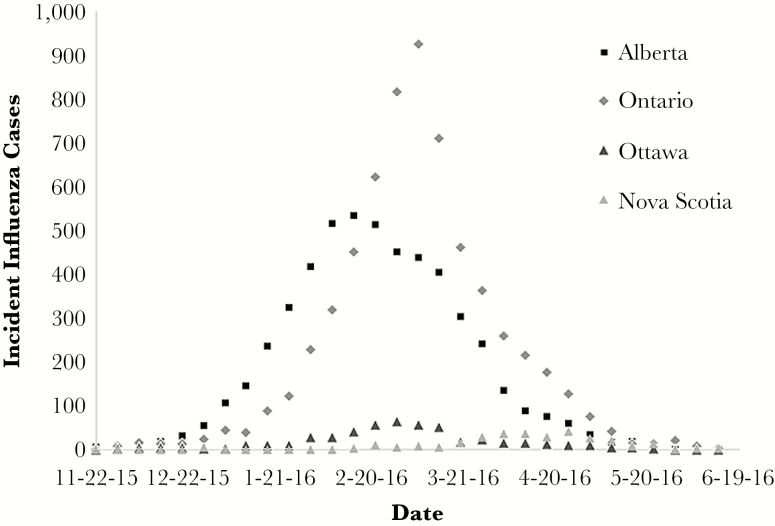
Methods: We used the previously described "incidence decay with exponential adjustment" (IDEA) model, a 2-parameter phenomenological model, to evaluate the characteristics of the 2015-2016 influenza season in 4 Canadian jurisdictions: the Provinces of Alberta, Nova Scotia and Ontario, and the City of Ottawa. Model fits were updated weekly with receipt of incident virologically confirmed case counts. Best-fit models were used to project seasonal influenza peaks and epidemic final sizes.
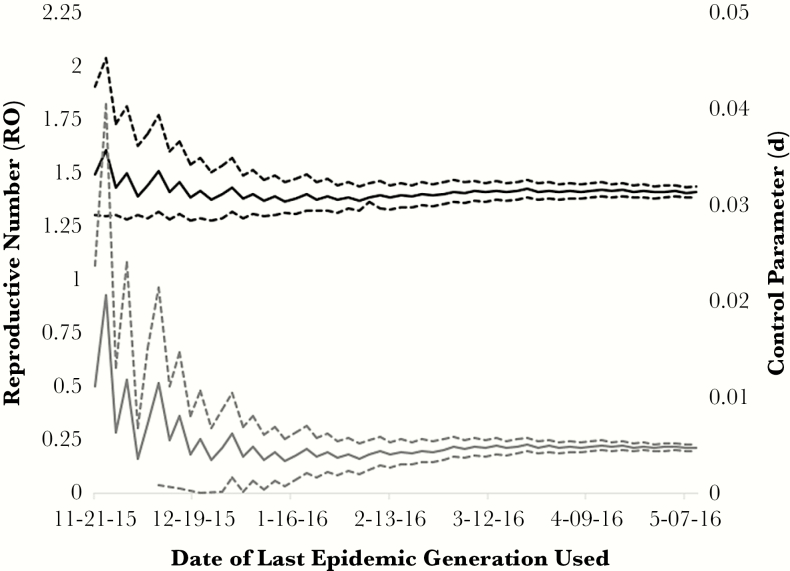
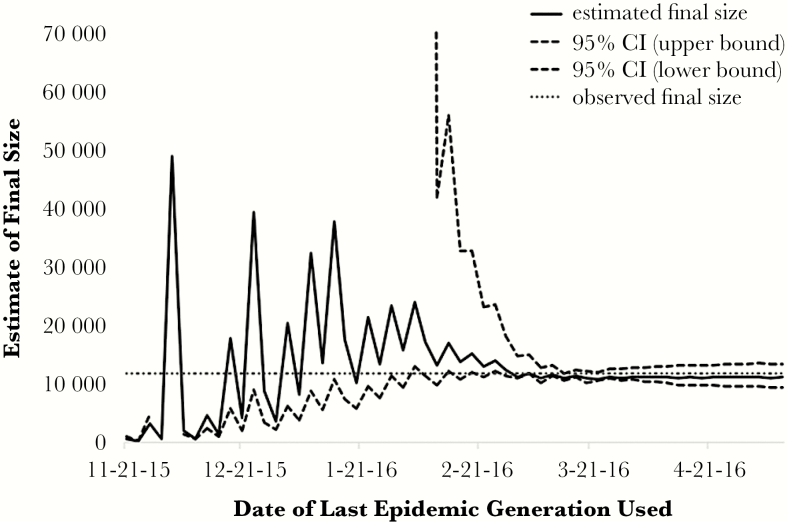
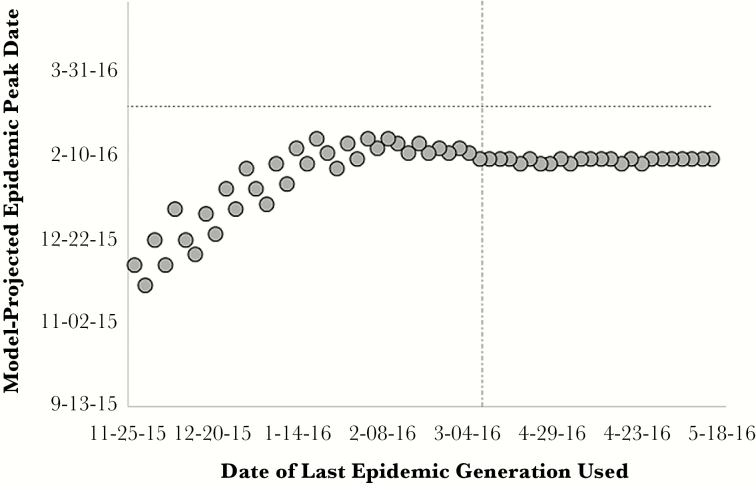
Results: The 2015-2016 influenza season was mild and late-peaking. Parameter estimates generated through fitting were consistent in the 2 largest jurisdictions (Ontario and Alberta) and with pooled data including Nova Scotia counts (R0 approximately 1.4 for all fits). Lower R0 estimates were generated in Nova Scotia and Ottawa. Final size projections that made use of complete time series were accurate to within 6% of true final sizes, but final size was using pre-peak data. Projections of epidemic peaks stabilized before the true epidemic peak, but these were persistently early (~2 weeks) relative to the true peak.
Conclusions: A simple, 2-parameter influenza model provided reasonably accurate real-time projections of influenza seasonal dynamics in an atypically late, mild influenza season. Challenges are similar to those seen with more complex forecasting methodologies. Future work includes identification of seasonal characteristics associated with variability in model performance.
Keywords: epidemics; epidemiology; forecasting; influenza; mathematical modeling.
Figures
References
-
- Clark NM, Lynch JP 3rd. Influenza: epidemiology, clinical features, therapy, and prevention. Semin Respir Crit Care Med 2011; 32:373–92. - PubMed
-
- Levenson JE, Kaul DR, Saint S et al. Clinical problem-solving. A shocking development. N Engl J Med 2013; 369:2253–8. - PubMed
-
- Simonsen L, Clarke MJ, Schonberger LB et al. Pandemic versus epidemic influenza mortality: a pattern of changing age distribution. J Infect Dis 1998; 178:53–60. - PubMed
-
- Molinari NA, Ortega-Sanchez IR, Messonnier ML et al. The annual impact of seasonal influenza in the US: measuring disease burden and costs. Vaccine 2007; 25:5086–96. - PubMed
-
- Simonsen L, Fukuda K, Schonberger LB, Cox NJ. The impact of influenza epidemics on hospitalizations. J Infect Dis 2000; 181:831–7. - PubMed
LinkOut - more resources
Full Text Sources
Other Literature Sources
