Review
. 2019 Mar;105(3):625-640.
doi: 10.1002/cpt.1057. Epub 2018 Apr 2.

Genomic Variation and Pharmacokinetics in Old Age: A Quantitative Review of Age- vs. Genotype-Related Differences

Affiliations
Review

Genomic Variation and Pharmacokinetics in Old Age: A Quantitative Review of Age- vs. Genotype-Related Differences

Christof M Dücker et al. Clin Pharmacol Ther. 2019 Mar.

Abstract

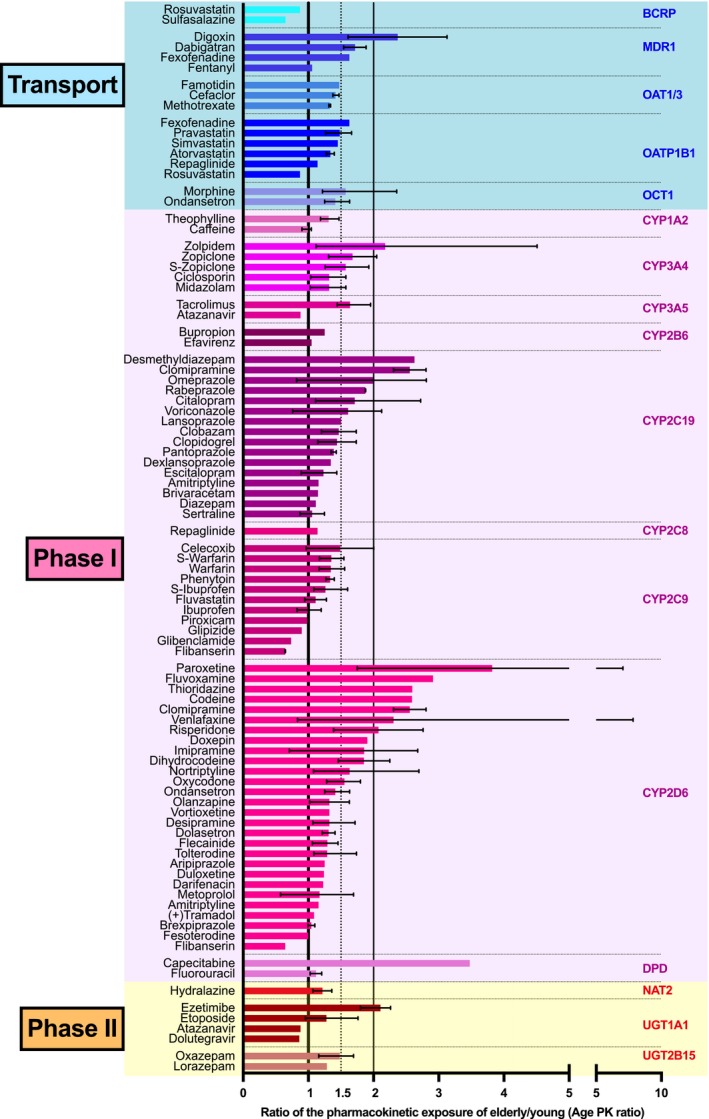
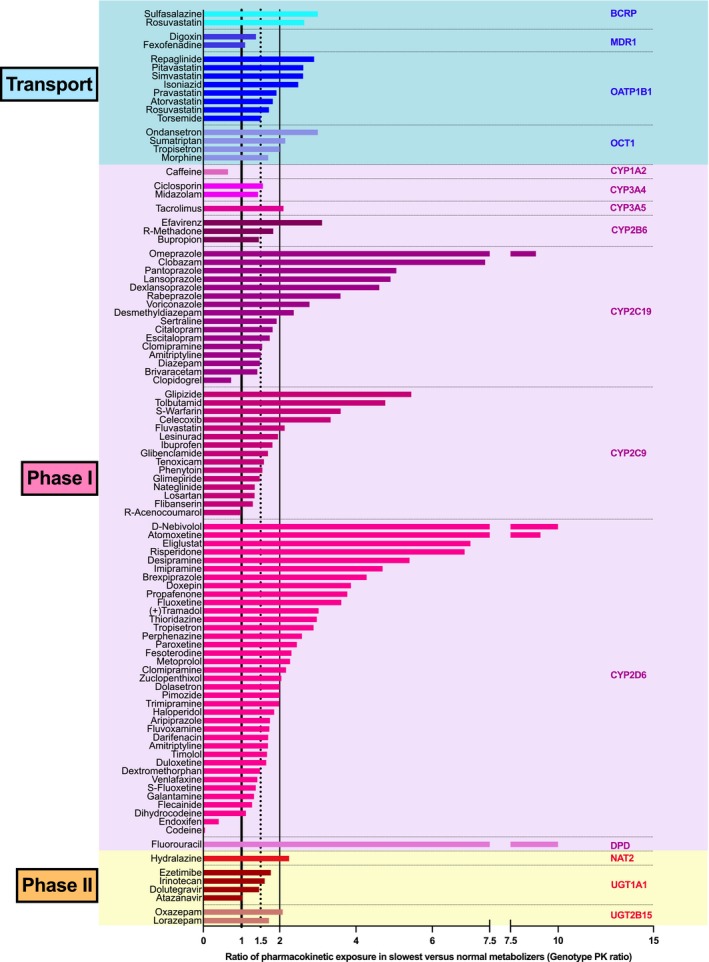
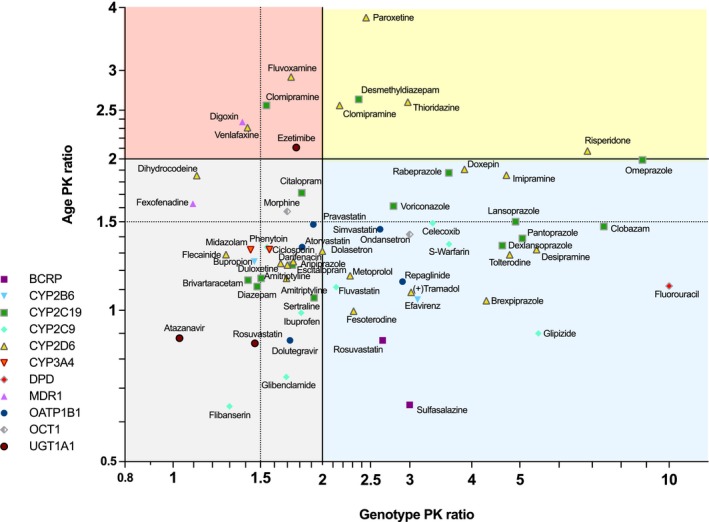
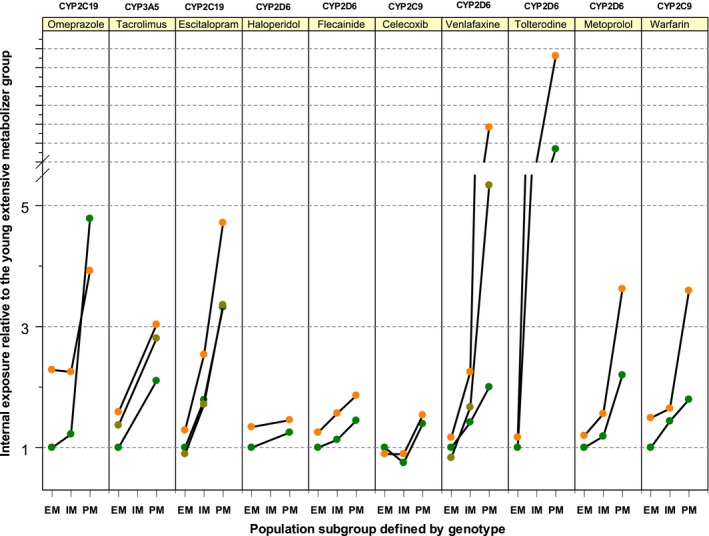
Older persons may particularly benefit from pharmacogenetic diagnostics, but there is little clinical evidence on that question. We quantitatively analyzed the effects of age and genotype in drugs with consensus on a therapeutically relevant impact of a genotype. Assuming additive effects of age and genotype, drugs may be classified in groups with different priorities to consider either age, or genotype, or both, in therapy. Particularly interesting were those studies specifically analyzing the age-by-genotype interaction.


Conflict of interest statement

The authors declare no competing interests for this work.

Figures

Figure 1
Figure 1
Age‐related increase in the systemic exposure to drugs. A PK ratio of 1 indicates no difference between younger and older people having received the same drug dose. Ratios indicating 1.5‐fold and 2‐fold increase in the systemic exposure in the elderly are marked by the dotted and the right solid line, respectively. If more than one study was available for a drug‐enzyme/transporter combination, we calculated means of ratios and in these instances; error bars indicate minimum and maximum of mean estimates of the multiple studies. The big age effect for capecitabine was not reproduced in other studies. As seen, a significant increase in the systemic exposure in old age was seen particularly for some CYP2C19 and CYP2D6 substrates, while for the majority of drugs only a moderate age‐dependent increase between 1‐ and 1.5‐fold was found.
Figure 2
Figure 2
(a) Mean age of the study samples. The black and red lines show the mean age of the young and elderly groups in the studies on age effect on pharmacokinetics. The blue line shows the mean age in the pharmacogenetic studies. Apparently, in the pharmacogenetic studies mean age tended to be even lower than in the young group of the age studies. The modal values were 23, 30, and 70 years in the pharmacogenetic, young age group, and old age samples, respectively. Several of the studies included in the present meta‐analysis did not report the mean age and were thus not included. (b) Age effect on drug exposure (expressed as ratio of exposure in elderly over drug exposure in young) in relation to the mean age in the elderly group. The solid line shows the linear regression line with 90% confidence intervals shown. Of course, optimally this quantitative relationship putting together all drugs for which the data were available (Table S1) should be established for each drug separately. (c) Age‐related increase in drug exposure in the elderly in relationship to the sample size of the respective study (sum of the sample sizes in the young and the elderly group). As illustrated by the linear regression line with 90% confidence intervals, there was no significant dependency, arguing against major publication bias. (d) Cumulative frequency distributions of the samples size in the relevant subgroups in the age studies and pharmacogenetic studies. Black and red lines show the sample size in the young and elderly groups, respectively, for age studies. The orange, blue and green lines show the distributions of samples size in pharmacogenetic studies for the subgroups of the poor (PM), intermediate (IM), and extensive (EM) metabolizers or transporters, respectively. The dotted line crosses the cumulative distribution curves at their medians.
Figure 3
Figure 3
This figure illustrates our analysis of whether and how much pharmacokinetic variation increases with old age. The age SD ratio was calculated as the ratio of the SD reported in the older participant sample over the younger participant sample from each study available. An SD ratio of 1 indicates the same SD in the young and old sample; SD ratios above 1 indicate higher SD in the elderly compared with the young samples. If more than one study was found, we calculated means of ratios; error bars indicate minimum and maximum. As shown, only for a few drugs there was a significant increase in variation in old age and in several drugs there was even lower variation in pharmacokinetics in old age compared with young age.
Figure 4
Figure 4
To allow comparison of age effects with genotype effects, we illustrate typical genotype effects. Relative drug exposure in carriers of the lowest activity in drug transport or metabolism is shown relative to the carriers of the genotypes coding for the normal function. A ratio of 1 indicates no difference and a ratio of 2 corresponding to a 2‐fold genotype‐dependent increase of systemic exposure. For the prodrugs clopidogrel (metabolite not specified), tamoxifen (endoxifen), and codeine (morphine) the data for the therapeutically relevant metabolite are given, thereby explaining why the ratio is below unity. As can be seen, the systemic exposure in carriers of the low activity genotypes was twice as high or even higher in about 50% if the drugs included in the present selection.
Figure 5
Figure 5
Combined presentation of age and genotype effects. The abscissa represents the age PK ratio representing the ratio of the systemic exposure in elderly over drug exposure in young given the same dose. The ordinate shows the genotype PK ratio representing the ratio of systemic drug exposure in the slowest metabolizer group (poor metabolizers if existing or intermediate metabolizer) over drug exposure in the normal metabolizer group. Four quadrants are highlighted illustrating the particular need to particularly consider age, genotype, or both parameters in therapy with the given drugs. The lines of 2 for age or genotype effect were highlighted because appropriate consideration of the respective factor in dosing would mean administering 50% of the standard dose only. Drugs in which both genotype and age ratios are above 2 may be of particular concern, but drugs above the 1.5 lines may also be of concern, depending on the therapeutic index of the respective drug.
Figure 6
Figure 6
Results from genotype–age interaction studies. The relevant enzyme–drug combinations are given on top. The ordinate illustrates the drug exposure relative to the young extensive metabolizers. The abscissa marks the metabolizer status with EM, IM, and PM corresponding to extensive, intermediate, and poor metabolism. The colored dots stand for separate groups within a study, with orange being the elderly, olive being middle age, and green being the young group. Only data from studies on both factors, age and genotype, could be included in this analysis. The left example (omeprazole) represents an interaction with less than additive effects (still existing but lower impact of genotype in old age), while the examples from tacrolimus to celecoxib represent no interactions, but just additive effects of age and genotype. The right examples (venlafaxine, tolterodine, metoprolol, and warfarin) represent more‐than‐additive interactions between age and genotype, with the genotype becoming even more important in old age.

Similar articles

Cited by

References

    1. Klotz, U. Pharmacokinetics and drug metabolism in the elderly. Drug Metab. Rev. 41, 67–76 (2009). - PubMed
    1. McLean, A.J. & Le Couteur, D.G. Aging biology and geriatric clinical pharmacology. Pharmacol. Rev. 56, 163–184 (2004). - PubMed
    1. Schlender, J.F. et al Development of a whole‐body physiologically based pharmacokinetic approach to assess the pharmacokinetics of drugs in elderly individuals. Clin. Pharmacokinet. 55, 1573–1589 (2016). - PMC - PubMed
    1. Yang, X. et al Systematic genetic and genomic analysis of cytochrome P450 enzyme activities in human liver. Genome Res. 20, 1020–1036 (2010). - PMC - PubMed
    1. Wynne, H.A. , Cope, L.H. , Mutch, E. , Rawlins, M.D. , Woodhouse, K.W. & James, O.F. The effect of age upon liver volume and apparent liver blood flow in healthy man. Hepatology 9, 297–301 (1989). - PubMed

MeSH terms

Substances