. 2018 May;175(10):1744-1759.
doi: 10.1111/bph.14188. Epub 2018 Apr 6.

Yoda1 analogue (Dooku1) which antagonizes Yoda1-evoked activation of Piezo1 and aortic relaxation

Affiliations

Yoda1 analogue (Dooku1) which antagonizes Yoda1-evoked activation of Piezo1 and aortic relaxation

Elizabeth L Evans et al. Br J Pharmacol. 2018 May.

Abstract

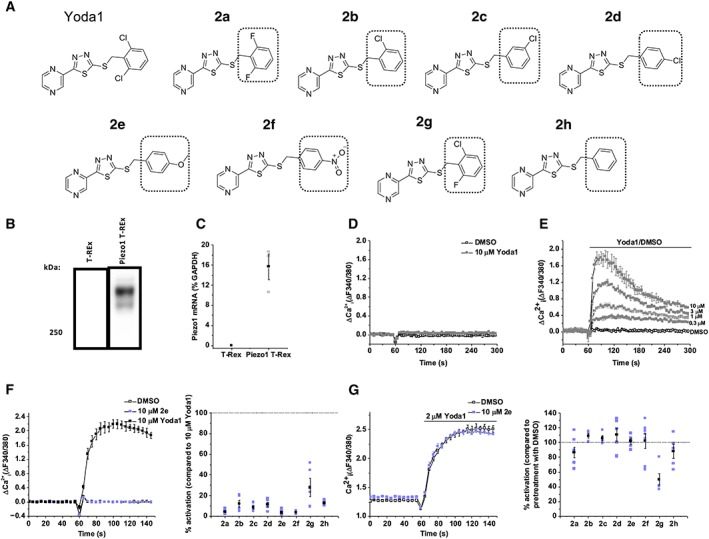
Background and purpose: The mechanosensitive Piezo1 channel has important roles in vascular physiology and disease. Yoda1 is a small-molecule agonist, but the pharmacology of these channels is otherwise limited.

Experimental approach: Yoda1 analogues were generated by synthetic chemistry. Intracellular Ca2+ and Tl+ measurements were made in HEK 293 or CHO cell lines overexpressing channel subunits and in HUVECs, which natively express Piezo1. Isometric tension recordings were made from rings of mouse thoracic aorta.

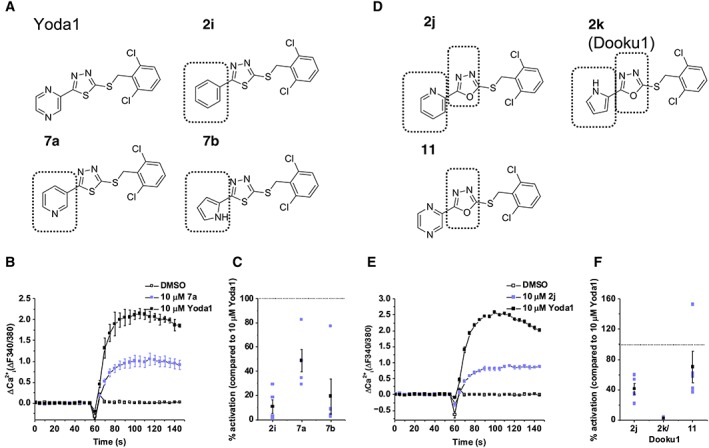
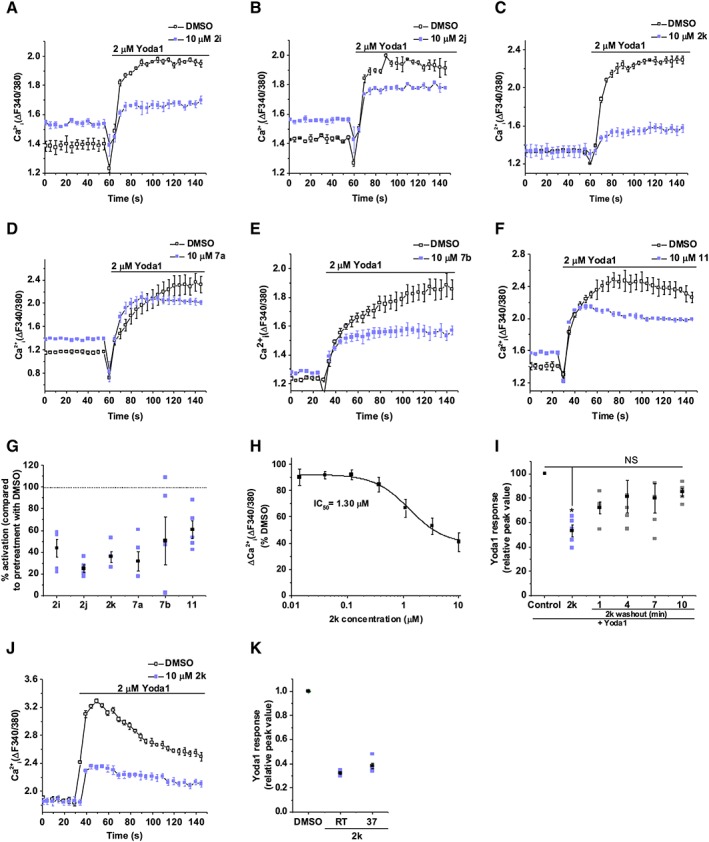
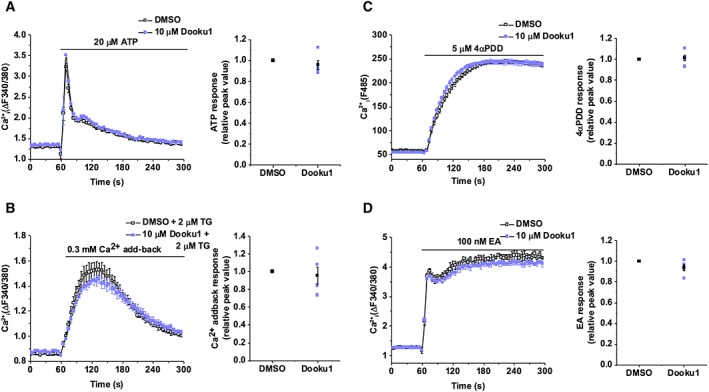
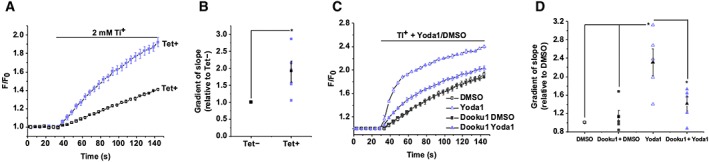
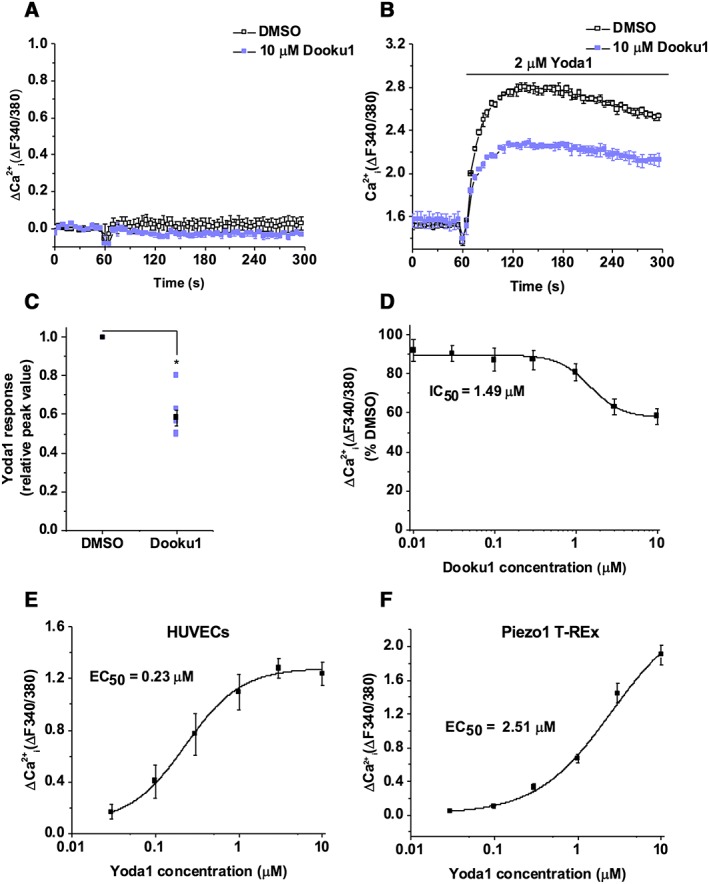
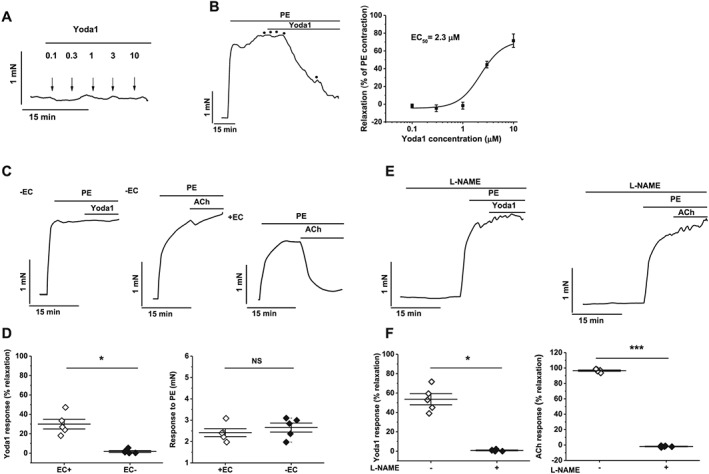
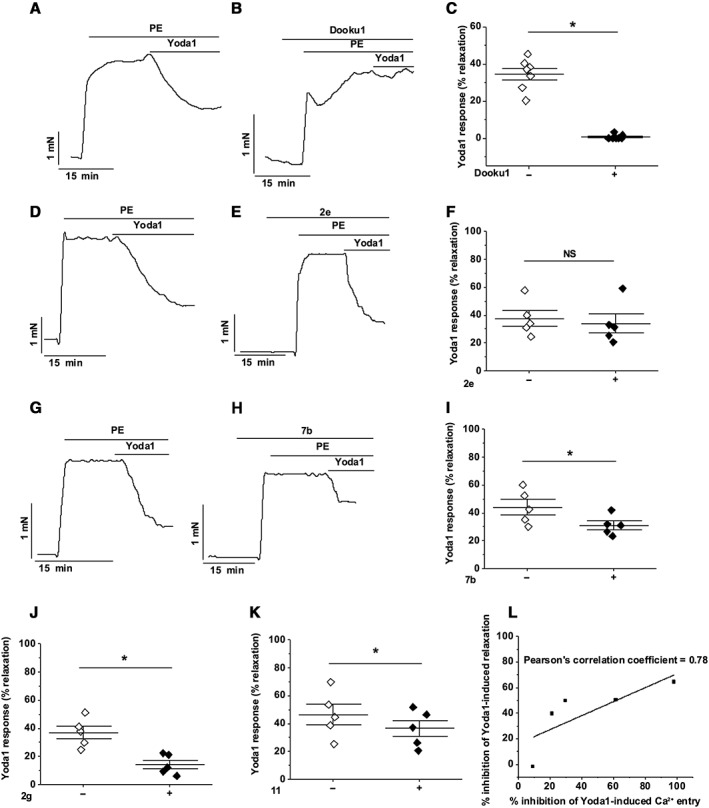
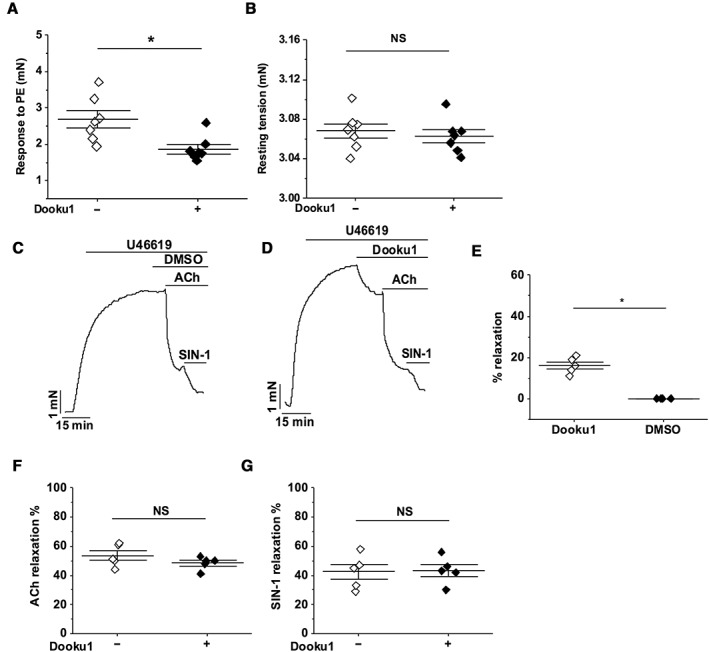
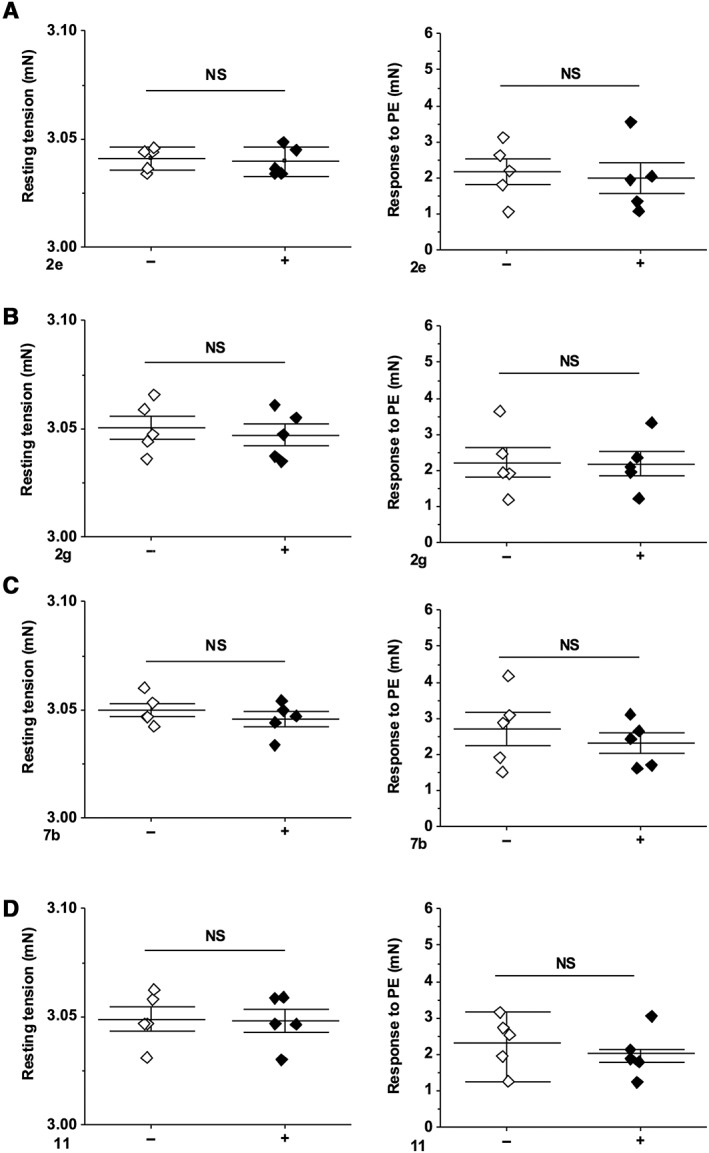
Key results: Modification of the pyrazine ring of Yoda1 yielded an analogue, which lacked agonist activity but reversibly antagonized Yoda1. The analogue is referred to as Dooku1. Dooku1 inhibited 2 μM Yoda1-induced Ca2+ -entry with IC50 s of 1.3 μM (HEK 293 cells) and 1.5 μM (HUVECs) yet failed to inhibit constitutive Piezo1 channel activity. It had no effect on endogenous ATP-evoked Ca2+ elevation or store-operated Ca2+ entry in HEK 293 cells or Ca2+ entry through TRPV4 or TRPC4 channels overexpressed in CHO and HEK 293 cells. Yoda1 caused dose-dependent relaxation of aortic rings, which was mediated by an endothelium- and NO-dependent mechanism and which was antagonized by Dooku1 and analogues of Dooku1.

Conclusion and implications: Chemical antagonism of Yoda1-evoked Piezo1 channel activity is possible, and the existence of a specific chemical interaction site is suggested with distinct binding and efficacy domains.


Figures

Figure 1
Figure 1
The 2,6‐dichlorophenyl group of Yoda1 is required for activation of Piezo1. (A) Structures of Yoda1 and analogues. Structural variation to Yoda1 is highlighted by the box outline. (B) Western blot of control T‐REx and Piezo1 T‐REx cells with anti‐Piezo1 antibody, confirming Piezo1 expression (predicted size, 286 kDa). (C) Real‐time PCR of Piezo1 mRNA levels relative to GAPDH mRNA in T‐REx and Piezo1 T‐REx cells. Error bars indicate SEM (n = 3). (D and E) FlexStation intracellular Ca2+ measurement data for T‐REx cells (D) and Piezo1 T‐REx cells (E) exposed to Yoda1 at the specified concentrations or exposed to the vehicle only (DMSO). (F) (Left) FlexStation intracellular Ca2+ measurement data for Piezo1 T‐REx cells exposed to 10 μM 2e or exposed to vehicle only (DMSO). Error bars indicate SEM (N = 3). (Right) Summary for experiments of the type shown on the left measured between 40–60 s after Yoda1 analogue application, expressed as a % of the 10 μM Yoda1 response. Each data point represents a value from an independent experiment with mean values and error bars representing SEM indicated in black (n = 5). (G) (Left) FlexStation intracellular Ca2+ measurement data for Piezo1 T‐REx cells exposed to 2 μM Yoda1 after pretreatment with 10 μM 2e or vehicle only (DMSO). Error bars indicate SEM (N = 3). (Right) Summary for experiments of the type shown on the left, as for (F, right) except data are expressed as a % of the Yoda1 response when pretreated with vehicle only (DMSO) (n = 5; 2b, 2c, 2e, 2g, 2h, n = 7; 2a, 2d, 2f).
Figure 2
Figure 2
Changes to the pyrazine ring or replacing the thiadiazole with an oxadiazole give rise to less active analogues. (A) Structures of Yoda1 and analogues with changes to the pyrazine ring. Structural variation to Yoda1 is highlighted by the box outline. (B) FlexStation intracellular Ca2+ measurement data for Piezo1 T‐REx cells exposed to 10 μM 7a or exposed to vehicle only (DMSO). Error bars indicate SEM (N = 3). (C) Summary for experiments of the type shown in (B) measured between 40–60 s after Yoda1 analogue application, expressed as a % of the 10 μM Yoda1 response. Each data point represents a value from an independent experiment with mean values and error bars representing SEM indicated in black (n = 5). (D) Structures of Yoda1 analogues with an oxadiazole. Structural variation to Yoda1 is highlighted by the box outline. (E) FlexStation intracellular Ca2+ measurement data for Piezo1 T‐REx cells exposed to 10 μM 2j or exposed to vehicle only (DMSO). Error bars indicate SEM (N = 3). (F) Summary for experiments of the type shown in (E), as for (C).
Figure 3
Figure 3
Yoda1 analogues are able to inhibit Yoda1‐induced Piezo1 activity. (A–F) FlexStation intracellular Ca2+ measurement data for Piezo1 T‐REx cells exposed to 2 μM Yoda1 after pretreatment with 10 μM 2i (A), 2j (B), 2k (C), 7a (D), 7b (E), 11 (F) or vehicle only (DMSO). Error bars indicate SEM (N = 3). (G) Summary for experiments of the type shown in (A–F) measured between 40–60 s after Yoda1 analogue application, expressed as a % of the Yoda1 response when pretreated with vehicle only (DMSO). Each data point represents a value from an independent experiment with mean values and error bars representing SEM indicated in black (n = 5). (H) Mean data for the type of experiment shown in (C) with cells pretreated with indicated concentrations of 2k. Expressed as a % of the Yoda1 response when pretreated with vehicle only (DMSO). The fitted curve is the Hill equation with IC50 1.30 μM (n = 5). (I) Summary of intracellular Ca2+ measurement data (as for G) for Tet + Piezo1 T‐REx cells exposed to 2 μM Yoda1, following pretreatment with 10 μM 2k or vehicle only (DMSO); 2k was washed out before the recording (n = 5). (J) As for (C) but conducted at 37°C. (K) Summary for experiments of the type shown in (J) (n = 5).
Figure 4
Figure 4
Selectivity of Dooku1. Ca2+ indicator dyes were fura‐2 (A, B, D) or fluo‐4 (C). Experiments conducted in native HEK 293 cells (A, B), CHO cells overexpressing TRPV4 (C) or HEK 293 cells overexpressing TRPC4 (D). Intracellular Ca2+ measurement data for cells exposed to 20 μM ATP (A), 0.3 mM Ca2+ addback (B), 5 μM 4α‐phorbol 12,13‐didecanoate (4α‐PDD) (C) or 100 nM (‐)‐Englerin A (EA) (D) following pretreatment with DMSO or 10 μM Dooku1 (left). Error bars indicate SEM (N = 3). Summary for experiments of the type shown on the left measured between 10–30 s (A), 60–90 s (B), 220–240 s (C) or 20–60 s (D) after treatment application and normalized to the peak amplitude values for the vehicle only (DMSO) pretreatment condition (right). Each data point represents a value from an independent experiment with mean values and error bars representing SEM indicated in black (n = 5).
Figure 5
Figure 5
Dooku1 does not affect Piezo1 constitutive activity (A) Intracellular Tl+ measurement data using FluxOR for Tet + Piezo1 T‐REx cells or control Tet− cells exposed to extracellular Tl+. The FluxOR measurements are displayed as the fluorescence intensity (F) divided by the initial fluorescence intensity (F0). Error bars indicate SEM (N = 3). (B) Summary for experiments of the type shown in (A) measured between 0–30 s after Tl+ application, normalized to rate of change of F in the Tet− response. Each data point represents a value from an independent experiment with mean values and error bars representing SEM indicated in black (n = 5). (C) Intracellular Tl+ measurement data for Tet + Piezo1 T‐REx cells exposed to extracellular Tl+ and 5 μM Yoda1 or vehicle (DMSO), following pretreatment with 10 μM Dooku1 or vehicle only (DMSO). Error bars indicate SEM (N = 3). (D) Summary for experiments of the type shown in (C), as for (B) except data are normalized to the rate of change of the vehicle only (DMSO) control condition (n = 5).
Figure 6
Figure 6
Dooku1 is effective against the endogenous Piezo1 channel. (A) Intracellular Ca2+ in HUVECs after exposure to 10 μM Dooku1 or vehicle only (DMSO). Error bars indicate SEM (N = 3). (B) Intracellular Ca2+ in HUVECs after exposure to 2 μM Yoda1 after pretreatment with 10 μM Dooku1 or vehicle only (DMSO). Error bars indicate SEM (N = 3). (C) Summary for experiments of the type shown in (B) measured 40–60 s after Yoda1 application and normalized to peak amplitudes for the vehicle only group. Each data point represents a value from an independent experiment with mean values and error bars representing SEM indicated in black (n = 7). (D) Mean data for the type of experiment shown in (B) with cells pretreated with indicated concentrations of Dooku1. Data are expressed as a % of the Yoda1 response when pretreated with vehicle only (DMSO). The fitted curve is the Hill equation with IC50 1.49 μM (n = 5). (E, F) Mean intracellular Ca2+ for HUVECs (E) or Piezo1 T‐REx cells (F) exposed to the indicated concentrations of Yoda1. The fitted curve is the Hill equation with EC50 of 0.23 μM (E) and 2.51 μM (F) (n = 3).
Figure 7
Figure 7
Yoda1‐induced relaxation in mouse thoracic aorta is endothelium‐ and NO‐dependent. (A) Isometric tension recording from aorta exposed to the indicated concentrations of Yoda1. (B) (left) As for (A) but following pre‐constriction with 0.3 μM phenylephrine (PE). (Right) Mean data for experiments of the type shown on the left expressed as % relaxation. The fitted curve is the Hill equation with EC50 of 2.3 μM (n = 5). (C) Isometric tension recording of aorta pre‐constricted with PE and exposed to 5 μM Yoda1 (left) or 5 μM ACh control (middle and right) with the endothelial layer removed (left and middle) or intact (right). (D) Summary data for experiments of the type shown in (B and C, left) expressed as % relaxation evoked by Yoda1 (left) or the response to PE (right) in the presence (EC+) or absence (EC−) of the endothelial cell layer. Each data point represents a value from an independent experiment with mean values and error bars representing SEM indicated by the black lines (n = 5). (E) As for (C) but following pre‐incubation with 100 μM Nω‐nitro‐L‐arginine methyl ester (L‐NAME). (F) As for (D) but for experiments of the type shown in (E).
Figure 8
Figure 8
Dooku1 inhibits Yoda1‐induced dilation in aorta. (A–K) Isometric tension data from mouse thoracic aorta with intact endothelium. (A) Pre‐constricted with PE and exposed to 5 μM Yoda1. (B) As for (A) but following 30 min pre‐incubation with 10 μM Dooku1. (C) Summary data for experiments of the type shown in (A, B) expressed as % relaxation evoked by Yoda1. Each data point represents a value from an independent experiment with mean values and error bars representing SEM indicated by the black lines (n = 7). (D–F) (G–I) As for (A–C) but following pre‐incubation with 10 μM 2e (D–F) or 7b (G–I) (n = 5 on F, I). (J, K) As for (C) but following pre‐incubation with 10 μM 2g (J) or 11 (K) (n = 5). (L) Comparison of the mean % inhibition of Yoda1‐induced relaxation in mouse thoracic aorta and the mean % inhibition of Yoda1‐induced Ca2+ entry by the five compounds: 2e, 2g, Dooku1, 7b and 11. The points are fit to a straight line with Pearson's correlation coefficient of 0.78.
Figure 9
Figure 9
Specificity of Dooku1 in aorta. All experiments were performed on mouse thoracic aorta with intact endothelium. (A, B) Summary data for experiments of the type shown in Figure 8A, B, expressed as the response to PE (A) or resting tension (B) before and after pre‐incubation with 10 μM Dooku1. Each data point represents a value from an independent experiment with mean values and error bars representing SEM indicated by the black lines (n = 7). (C) Aorta were pre‐constricted with 0.1 μM U46619 and treated consecutively with DMSO, 1 μM ACh and 10 μM SIN‐1. (D) As for C but pretreated with Dooku1 instead of DMSO. (E–G) Summary data for experiments of the type shown in (C, D) expressed as % of the effect of Dooku1 on the contraction by U46619 (E) or % relaxation evoked by ACh (F) or SIN‐1 (G) before and after pre‐incubation with 10 μM Dooku1. Each data point represents a value from an independent experiment with mean values and error bars representing SEM indicated by the black lines (n = 5).
Figure 10
Figure 10
Lack of effect of other Yoda1 analogues on PE‐induced contraction. Summary data for experiments of the type shown in Figure 8 D–E, G–H expressed as resting tension (left) or the response to PE (right) following pre‐incubation with 10 μM 2e (A), 2g (B), 7b (C) and 11 (D). Each data point represents a value from an independent experiment with mean values and error bars representing SEM indicated by the black lines (n = 5).

References

    1. Akbulut Y, Gaunt HJ, Muraki K, Ludlow MJ, Amer MS, Bruns A et al (2015). (−)‐Englerin A is a potent and selective activator of TRPC4 and TRPC5 calcium channels. Angew Chem Int Ed 54: 3787–3791. - PMC - PubMed
    1. Albuisson J, Murthy SE, Bandell M, Coste B, Louis‐Dit‐Picard H, Mathur J et al (2013). Dehydrated hereditary stomatocytosis linked to gain‐of‐function mutations in mechanically activated PIEZO1 ion channels. Nat Commun 4: 1884. - PMC - PubMed
    1. Alexander SPH, Kelly E, Marrion NV, Peters JA, Faccenda E, Harding SD et al (2017a). The Concise Guide to PHARMACOLOGY 2017/18: Other ion channels. Br J Pharmacol 174: S195–S207. - PMC - PubMed
    1. Alexander SPH, Striessnig J, Kelly E, Marrion NV, Peters JA, Faccenda E et al (2017b). The Concise Guide to PHARMACOLOGY 2017/18: Voltage‐gated ion channels. Br J Pharmacol 174: S160–S194. - PMC - PubMed
    1. Andolfo I, Alper SL, De Franceschi L, Auriemma C, Russo R, De Falco L et al (2013). Multiple clinical forms of dehydrated hereditary stomatocytosis arise from mutations in PIEZO1. Blood 121: 3925–3935. - PubMed

Publication types