Review
. 2018 May;11(3):267-276.
doi: 10.1111/cts.12536. Epub 2018 Mar 2.

Opportunities and Challenges in Implementation of Multiparameter Single Cell Analysis Platforms for Clinical Translation

Affiliations
Review

Opportunities and Challenges in Implementation of Multiparameter Single Cell Analysis Platforms for Clinical Translation

Susan M Keating et al. Clin Transl Sci. 2018 May.

Abstract

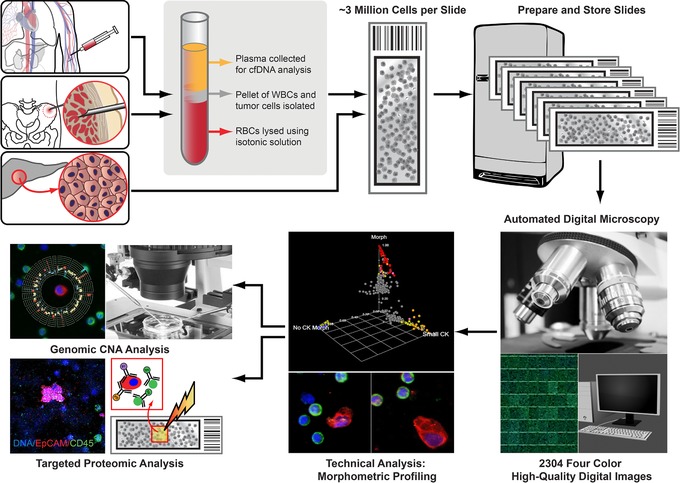
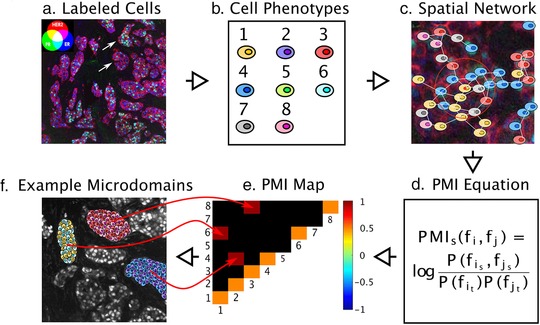
The high-content interrogation of single cells with platforms optimized for the multiparameter characterization of cells in liquid and solid biopsy samples can enable characterization of heterogeneous populations of cells ex vivo. Doing so will advance the diagnosis, prognosis, and treatment of cancer and other diseases. However, it is important to understand the unique issues in resolving heterogeneity and variability at the single cell level before navigating the validation and regulatory requirements in order for these technologies to impact patient care. Since 2013, leading experts representing industry, academia, and government have been brought together as part of the Foundation for the National Institutes of Health (FNIH) Biomarkers Consortium to foster the potential of high-content data integration for clinical translation.


Figures

Figure 1
Figure 1
The high definition single cell analysis (HD‐SCA) generic temporal and spatial analysis. The HD‐SCA workflow is a single‐cell analysis system generating morphometric, proteomic, and genomic characterization of any rare cell from either liquid (blood draw or bone marrow aspirate) or solid tissue biopsy.17, 19, 52 Representative circulating tumor cells (CTCs) and solid tissue samples from patients with cancer are isolated and imaged using the same HD‐SCA system. Blood cells after red blood cell depletion and tissue cells obtained from touch preparations of either metastases or primary tumor are plated. Slides with nucleated blood cells and cell monolayers from touch preparations are immunofluorescently labeled in the same batch in three wavelengths, and the resultant stained slides are imaged at 40× magnification to generate high‐resolution digital images with detailed nuclear and cytoplasmic features for morphological cellular characteristics and protein expression. Captured CTCs are classified as CK+ (red), CD45– (green) cells of epithelial origin with an intact, nonapoptotic‐appearing nucleus by DAPI (blue) imaging, morphologically distinct from surrounding white blood cells by shape and/or size. Cells of interest can be picked individually and isolated for single‐cell genomic copy number alteration (CNA) or targeted proteomic analysis via imaging mass cytometry.
Figure 2
Figure 2
Pointwise mutual information (PMI) for quantifying spatial heterogeneity. (a) A pseudo‐colored multichannel fluorescence image labeled iteratively by the MultiOmyx platform is shown for an estrogen receptor (ER)+ invasive ductal carcinoma from a tissue microarray. Three biomarker channels were used to demonstrate the approach: HER2 (red), ER (blue), and PR (green), although this method can be scaled for >50 biomarkers. Areas of PR/ER co‐activation will appear in cyan, HER2/ER co‐activation in magenta, and PR/HER2 co‐activation in yellow. The upper and lower arrows indicate heterogeneous tumor microdomains with higher than average ER+/PR+ phenotyped cells and mostly ER+ cells, respectively. (b) Machine learning methods can be used to identify dominant cellular phenotypes from biomarker expression patterns over an entire tissue microarray, which in this case were eight. Each cell is then classified with the most similar dominant phenotype. (c) In order to represent the tumor topology, a spatial network of the cells in each tissue microarray spot or whole tissue section is constructed, in which each cell has the ability to communicate with nearby cells up to a certain limit, 250 μm,59 and the communication propensity is assumed to be inversely proportional to the cellular distance. (d) PMI quantifies the statistical associations, both linear and non‐linear, between each pair of cellular phenotypes. In particular, PMI calculates the logarithmic joint probability of finding a particular pair of cellular phenotypes occurring in close proximity, relative to the probability of these phenotypes co‐occurring at random. (e) By referencing a specific interaction pair in the PMI plot, one can interrogate the network subgraphs/motifs that contribute to the PMI dependencies. A PMI map with strong diagonal entries and weak off‐diagonal entries describes a globally heterogeneous but locally homogeneous tumor. On the contrary, a PMI map with strong off‐diagonal entries describes a tumor that is locally heterogeneous. (f) An example TMA spot with three locally heterogeneous tumor microdomains denoted by the off‐diagonal entries in the PMI map, containing phenotypes 1 and 6, 2 and 4, and 3 and 8. PMI maps can also portray anti‐associations (e.g., if phenotype 1 never occurs spatially near phenotype 3). The ensemble of associations and anti‐associations of varying intensities along or off the diagonal represent the true complexity of tumor images in a format that can be summarized and interrogated. PMI maps are predicted to become diagnostic and prognostic biomarkers.

References

    1. Gerlinger, M. et al Intratumor heterogeneity and branched evolution revealed by multiregion sequencing. N. Engl. J. Med. 366, 883–892 (2012). - PMC - PubMed
    1. Sutherland, K.D. & Visvader, J.E. Cellular mechanisms underlying intertumoral heterogeneity. Trends Cancer 1, 15–23 (2015). - PubMed
    1. Axelrod, D.E. , Miller, N. & Chapman, J.A . Avoiding pitfalls in the statistical analysis of heterogeneous tumors. Biomed. Inform. Insights 2, 11–18 (2009). - PMC - PubMed
    1. Weaver, W.M. et al Advances in high‐throughput single‐cell microtechnologies. Curr. Opin. Biotechnol. 25, 114–123 (2014). - PMC - PubMed
    1. Heath, J.R. , Ribas, A. & Mischel, P.S . Single‐cell analysis tools for drug discovery and development. Nat. Rev. Drug Discov. 15, 204–216 (2016). - PMC - PubMed

Publication types

MeSH terms