

Predictive Movements and Human Reinforcement Learning of Sequential Action
- PMID: 29498434
- PMCID: PMC6001690
- DOI: 10.1111/cogs.12599
Predictive Movements and Human Reinforcement Learning of Sequential Action
Abstract
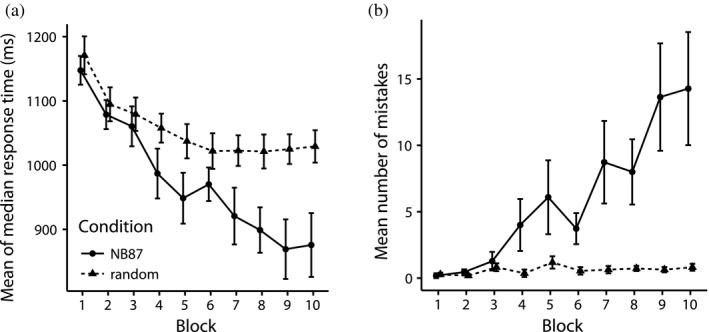
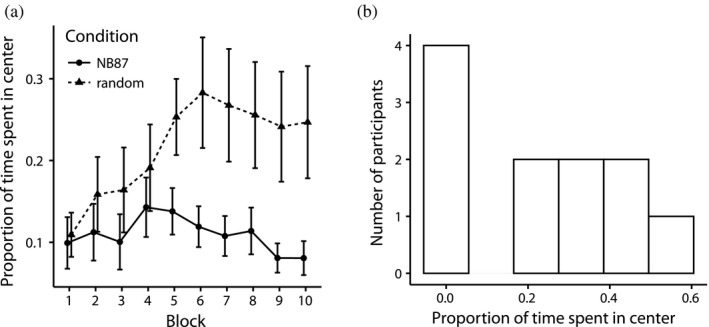
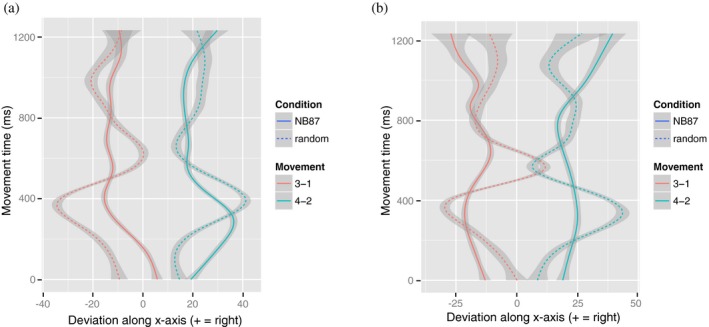
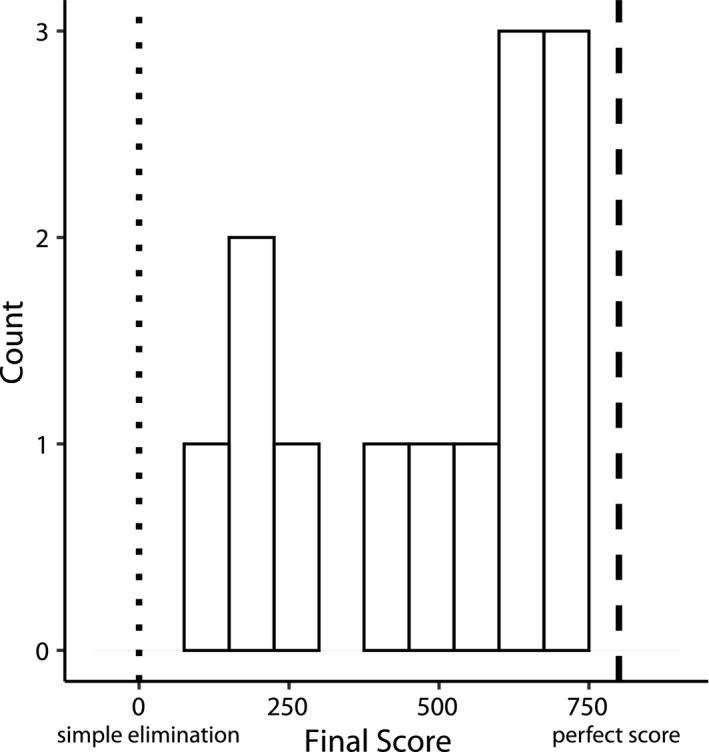
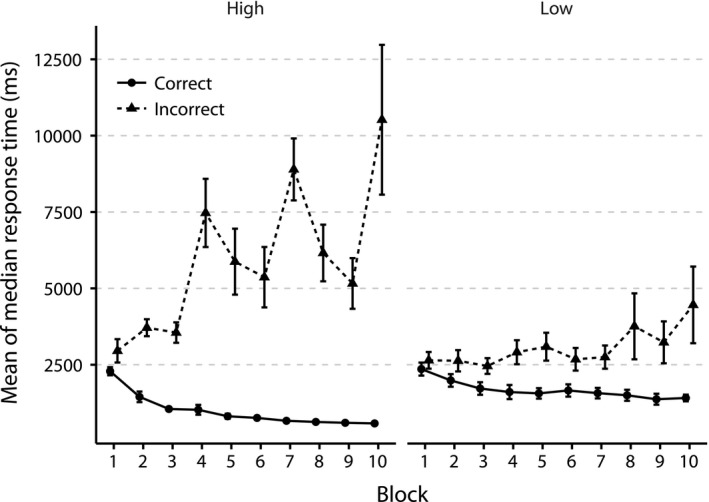
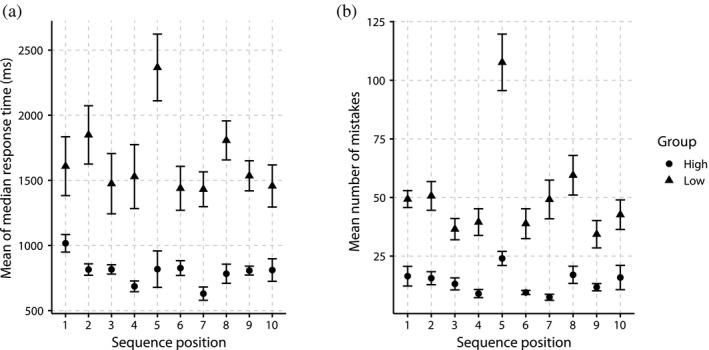
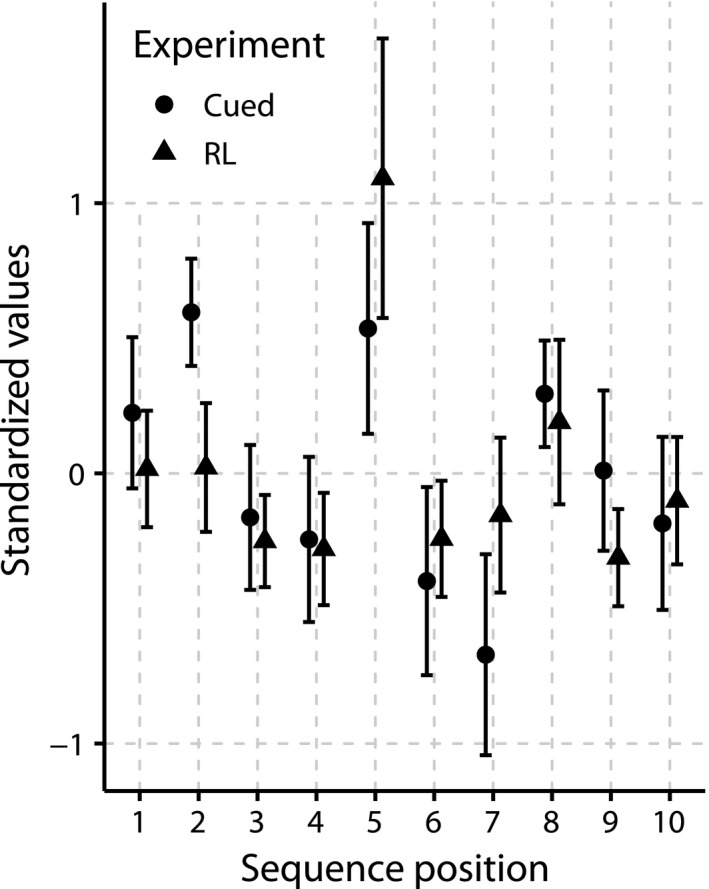
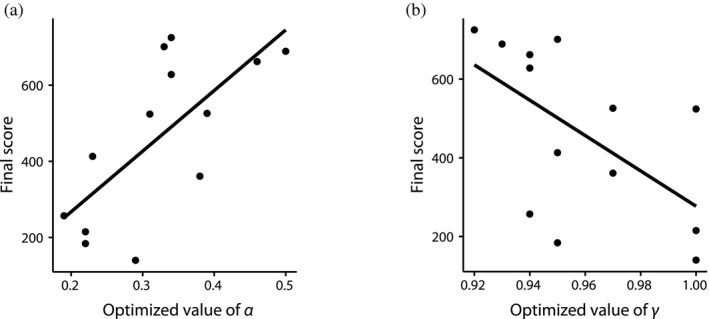
Sequential action makes up the bulk of human daily activity, and yet much remains unknown about how people learn such actions. In one motor learning paradigm, the serial reaction time (SRT) task, people are taught a consistent sequence of button presses by cueing them with the next target response. However, the SRT task only records keypress response times to a cued target, and thus it cannot reveal the full time-course of motion, including predictive movements. This paper describes a mouse movement trajectory SRT task in which the cursor must be moved to a cued location. We replicated keypress SRT results, but also found that predictive movement-before the next cue appears-increased during the experiment. Moreover, trajectory analyses revealed that people developed a centering strategy under uncertainty. In a second experiment, we made prediction explicit, no longer cueing targets. Thus, participants had to explore the response alternatives and learn via reinforcement, receiving rewards and penalties for correct and incorrect actions, respectively. Participants were not told whether the sequence of stimuli was deterministic, nor if it would repeat, nor how long it was. Given the difficulty of the task, it is unsurprising that some learners performed poorly. However, many learners performed remarkably well, and some acquired the full 10-item sequence within 10 repetitions. Comparing the high- and low-performers' detailed results in this reinforcement learning (RL) task with the first experiment's cued trajectory SRT task, we found similarities between the two tasks, suggesting that the effects in Experiment 1 are due to predictive, rather than reactive processes. Finally, we found that two standard model-free reinforcement learning models fit the high-performing participants, while the four low-performing participants provide better fit with a simple negative recency bias model.
Keywords: Implicit motor learning; Movement trajectory; Reinforcement learning; Sequence learning; Sequential action; Serial reaction time task.
Copyright © 2018 The Authors. Cognitive Science - A Multidisciplinary Journal published by Wiley Periodicals, Inc. on behalf of Cognitive Science Society.
Figures
Similar articles
-
A Critical Period for Robust Curriculum-Based Deep Reinforcement Learning of Sequential Action in a Robot Arm.Top Cogn Sci. 2022 Apr;14(2):311-326. doi: 10.1111/tops.12595. Epub 2022 Jan 10. Top Cogn Sci. 2022. PMID: 35005844 Free PMC article.
-
The "Motor" in Implicit Motor Sequence Learning: A Foot-stepping Serial Reaction Time Task.J Vis Exp. 2018 May 3;(135):56483. doi: 10.3791/56483. J Vis Exp. 2018. PMID: 29781982 Free PMC article.
-
Social Cues Alter Implicit Motor Learning in a Serial Reaction Time Task.Front Hum Neurosci. 2018 May 14;12:197. doi: 10.3389/fnhum.2018.00197. eCollection 2018. Front Hum Neurosci. 2018. PMID: 29867420 Free PMC article.
-
On the role of eye movement monitoring and discouragement on inhibition of return in a go/no-go task.Vision Res. 2014 Mar;96:133-9. doi: 10.1016/j.visres.2013.11.008. Epub 2013 Dec 13. Vision Res. 2014. PMID: 24333328 Review.
-
Implicit learning in individuals with autism spectrum disorders: a meta-analysis.Psychol Med. 2015 Apr;45(5):897-910. doi: 10.1017/S0033291714001950. Epub 2014 Aug 15. Psychol Med. 2015. PMID: 25126858 Review.
Cited by
-
A Critical Period for Robust Curriculum-Based Deep Reinforcement Learning of Sequential Action in a Robot Arm.Top Cogn Sci. 2022 Apr;14(2):311-326. doi: 10.1111/tops.12595. Epub 2022 Jan 10. Top Cogn Sci. 2022. PMID: 35005844 Free PMC article.
-
Implicit motor sequence learning using three-dimensional reaching movements with the non-dominant left arm.Exp Brain Res. 2024 Dec;242(12):2715-2726. doi: 10.1007/s00221-024-06934-4. Epub 2024 Oct 8. Exp Brain Res. 2024. PMID: 39377917 Free PMC article.
-
The impact of implicit and explicit suggestions that 'there is nothing to learn' on implicit sequence learning.Psychol Res. 2021 Jul;85(5):1943-1954. doi: 10.1007/s00426-020-01385-2. Epub 2020 Aug 4. Psychol Res. 2021. PMID: 32749535
References
-
- Averbeck, B. B. , & Costa, V. D. (2017). Motivational neural circuits underlying reinforcement learning. Nature Neuroscience, 20, 505–512. - PubMed
-
- Botvinick, M. , & Plaut, D. C. (2004). Doing without schema hierarchies: A recurrent connectionist approach to routine sequential action and its pathologies. Psychological Review, 111, 395–429. - PubMed
-
- Boyer, M. , Destrebecqz, A. , & Cleeremans, A. (2005). Processing abstract sequence structure: Learning without knowing, or knowing without learning? Psychological Research, 69, 383–398. - PubMed
-
- Bruhn, P. , Huette, S. , & Spivey, M. (2014). Degree of certainty modulates anticipatory processes in real time. Journal of Experimental Psychology: Human Perception and Performance, 40, 525–538. - PubMed
Publication types
MeSH terms
LinkOut - more resources
Full Text Sources
Other Literature Sources
