. 2019 Aug;39(8):1557-1569.
doi: 10.1177/0271678X18756218. Epub 2018 Mar 2.

Quantitative blood flow measurement in rat brain with multiphase arterial spin labelling magnetic resonance imaging

Affiliations

Quantitative blood flow measurement in rat brain with multiphase arterial spin labelling magnetic resonance imaging

James R Larkin et al. J Cereb Blood Flow Metab. 2019 Aug.

Abstract

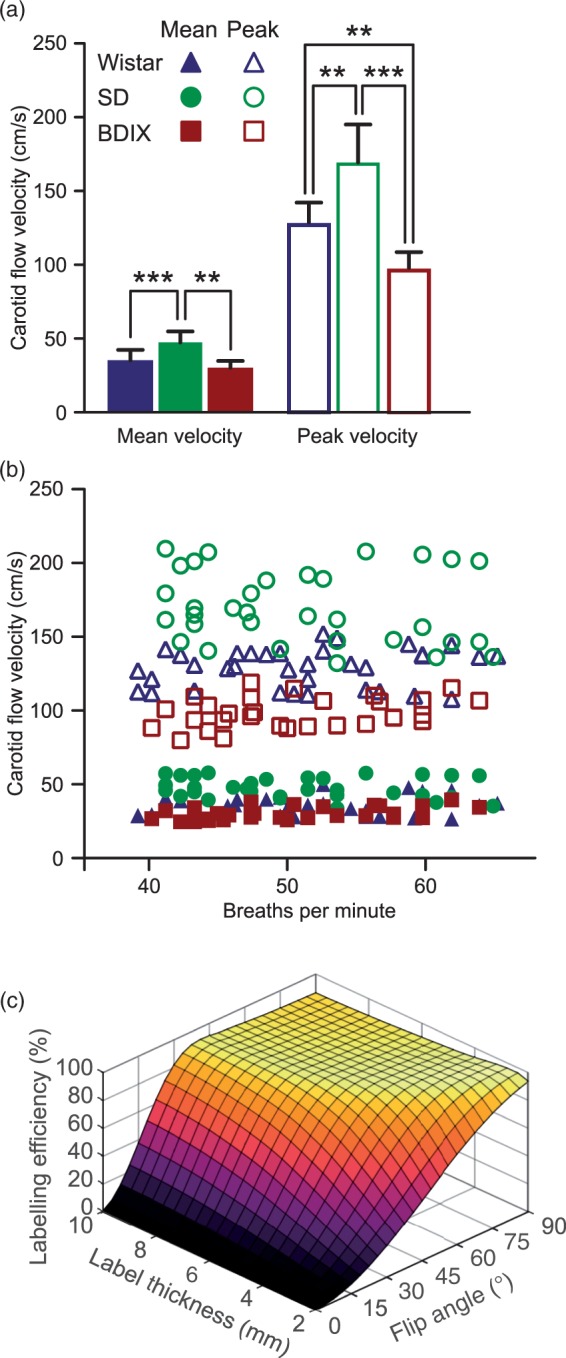
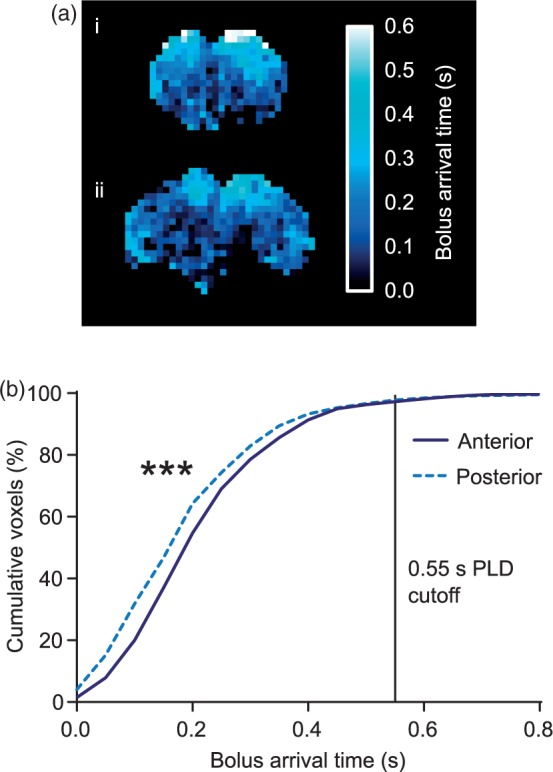
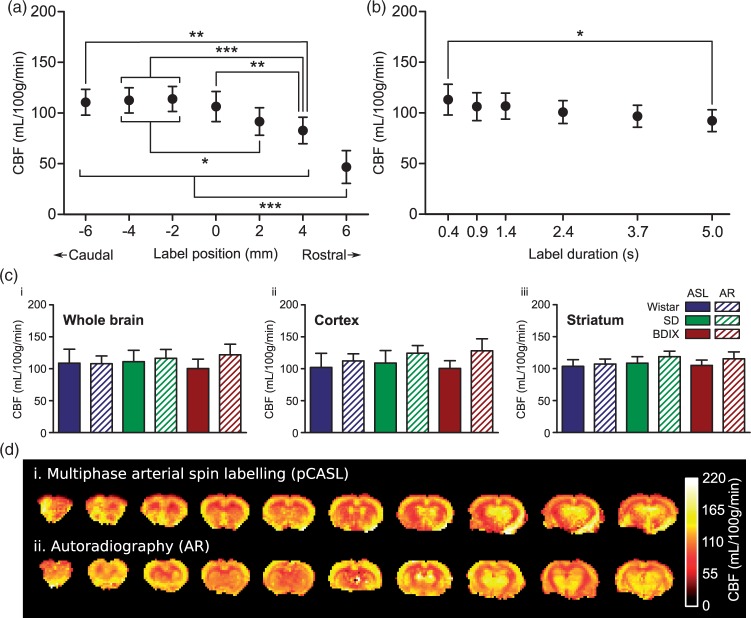
Cerebral blood flow is an important parameter in many diseases and functional studies that can be accurately measured in humans using arterial spin labelling (ASL) MRI. However, although rat models are frequently used for preclinical studies of both human disease and brain function, rat CBF measurements show poor consistency between studies. This lack of reproducibility is due, partly, to the smaller size and differing head geometry of rats compared to humans, as well as the differing analysis methodologies employed and higher field strengths used for preclinical MRI. To address these issues, we have implemented, optimised and validated a multiphase pseudo-continuous ASL technique, which overcomes many of the limitations of rat CBF measurement. Three rat strains (Wistar, Sprague Dawley and Berlin Druckrey IX) were used, and CBF values validated against gold-standard autoradiography measurements. Label positioning was found to be optimal at 45°, while post-label delay was optimised to 0.55 s. Whole brain CBF measures were 109 ± 22, 111 ± 18 and 100 ± 15 mL/100 g/min by multiphase pCASL, and 108 ± 12, 116 ± 14 and 122 ± 16 mL/100 g/min by autoradiography in Wistar, SD and BDIX cohorts, respectively. Tumour model analysis shows that the developed methods also apply in disease states. Thus, optimised multiphase pCASL provides robust, reproducible and non-invasive measurement of CBF in rats.

Keywords: Arterial spin labelling; autoradiography; cerebral blood flow; multiphase; rats.


Figures

Figure 1.
Figure 1.
(a) Schematic of the multiphase pCASL sequence. (b) Pulse timing diagram of the sequence. (c and d) Location of the labelling and imaging regions shown in relation to the brain and the major vessels of the neck, superimposed over (c) an anatomical, fast spin-echo sagittal midline image of an SD rat head, and (d) a maximum intensity projection of time-of-flight angiography with the same field of view. Positions of C1 and C2 vertebra are visible and the notch immediately caudal to the gracile fasciculus is easily identified.
Figure 2.
Figure 2.
Schematic showing the use of supervoxels in preparing high precision phase map priors. The raw multiphase data (a) are initially fitted to the Fermi function with low precision priors (1) to yield a raw phase map (b). This raw phase map contains good spatial information but the phase values themselves are overestimated. The data are smoothed and clustered using supervoxels (2) to yield ROIs for each supervoxel phase cluster present (c). The raw multiphase data are then combined with the supervoxel ROIs (3) to yield high SNR supervoxel-ROI means of the multiphase data (d). This high SNR multiphase dataset is then fitted again (4) yielding a high precision phase map (e) which can be used to generate the final CBF maps (f), in combination with the raw data (5).
Figure 3.
Figure 3.
(a) Mean and peak carotid artery flow velocities in three strains of rats; Wistar, SD and BDIX. (b) Mean and peak carotid artery flow velocities as a function of anaesthetic depth, as indicated by breathing rate. (c) Bloch simulation results showing labelling efficiency (inversion achieved as a percentage of theoretical inversion possible), for blood as it passes through labelling planes of 2–10 mm thickness with flip angles in the labelling pulse train between 2° and 90° at 37 cm/s (mean carotid velocity for all rats studied).
Figure 4.
Figure 4.
(a) Bolus arrival time maps from (i) anterior slice (immediately caudal to the olfactory sulcus), and (ii) posterior slice (10 mm caudal to the anterior slice) from an example BDIX rat brain. (b) Cumulative frequency distributions of voxel arrival time in the anterior and posterior slices from all rat strains (n = 18; ***p < 0.001). The PLD cut-off represents the point at which arterial transit (cumulative voxels) had occurred in 97% of voxels imaged.
Figure 5.
Figure 5.
(a) Effect of labelling plane location on CBF measurements. Negative label positions are located towards the tail of the animals, positive positions towards the nose; 0 mm is the position of the labelling plane shown in Figure 1, at which the labelling plane is entirely spanning straight and parallel vessels, each passing close to perpendicular through the labelling plane. ***p < 0.001, **p < 0.01, *p < 0.05; n = 9 across three strains. (b) Effect of label duration on CBF measurements: *p < 0.05; n = 9 across three strains. (c) Comparison between autoradiography (AR) and pCASL (1.4 s label duration) derived CBF values from ROIs covering (i) the whole brain, (ii) the cortex, or (iii) the striatum. (d) Example CBF maps obtained using (i) multiphase pCASL MRI and (ii) autoradiography in a Wistar rat.
Figure 6.
Figure 6.
Comparison of CBF maps from single-average multiphase pCASL acquisitions and four-average label-control acquisitions in the same animal; total imaging time 89 s in each case. Note the lower CBF values, areas of greater heterogeneity and the regions with decreased apparent perfusion in the label-control maps.
Figure 7.
Figure 7.
(a) Example cerebral blood flow maps acquired using the optimised multiphase pCASL sequence for three strains of rat; Wistar, SD and BDIX. Eight averages were acquired per image, total imaging time = 11 min 52 s. (b) CBF mean of whole brain (WB), cortex (c), and striatum (S) in three strains of rats. n = 7 rats/strain; *p < 0.05.

References

    1. Miyaji Y, Yokoyama M, Kawabata Y, et al. Arterial spin-labeling magnetic resonance imaging for diagnosis of late seizure after stroke. J Neurol Sci 2014; 339: 87–90. - PubMed
    1. Zhang S, Yao Y, Zhang S, et al. Comparative study of DSC-PWI and 3D-ASL in ischemic stroke patients. J Huazhong Univ Sci Technolog Med Sci 2015; 35: 923–927. - PubMed
    1. Silva AC, Kim SG, Garwood M. Imaging blood flow in brain tumors using arterial spin labeling. Magn Reson Med 2000; 44: 169–173. - PubMed
    1. Qiao XJ, Ellingson BM, Kim HJ, et al. Arterial spin-labeling perfusion MRI stratifies progression-free survival and correlates with epidermal growth factor receptor status in glioblastoma. Am J Neuroradiol 2015; 36: 672–677. - PMC - PubMed
    1. Alsop DC, Detre JA, Golay X, et al. Recommended implementation of arterial spin-labeled perfusion MRI for clinical applications: a consensus of the ISMRM perfusion study group and the European consortium for ASL in dementia. Magn Reson Med 2015; 73: 102–116. - PMC - PubMed

Publication types

LinkOut - more resources