. 2018 Apr;285(8):1403-1418.
doi: 10.1111/febs.14426. Epub 2018 Mar 24.

Differential effects of Vav-promoter-driven overexpression of BCLX and BFL1 on lymphocyte survival and B cell lymphomagenesis

Affiliations

Differential effects of Vav-promoter-driven overexpression of BCLX and BFL1 on lymphocyte survival and B cell lymphomagenesis

Selma Tuzlak et al. FEBS J. 2018 Apr.

Abstract

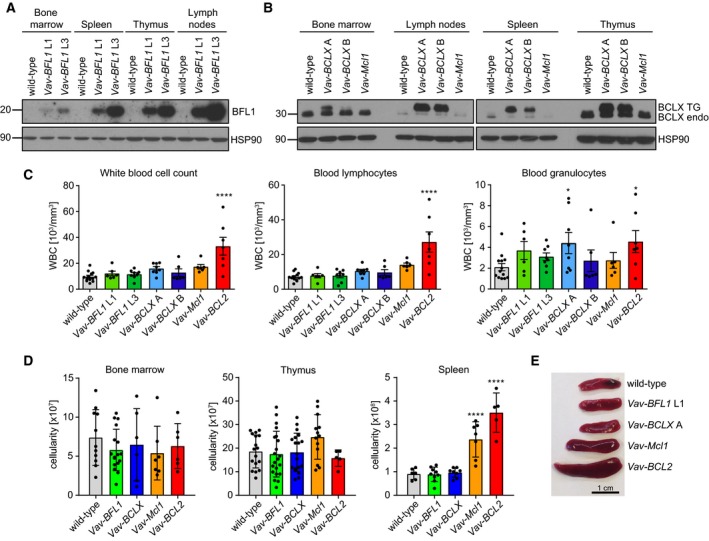
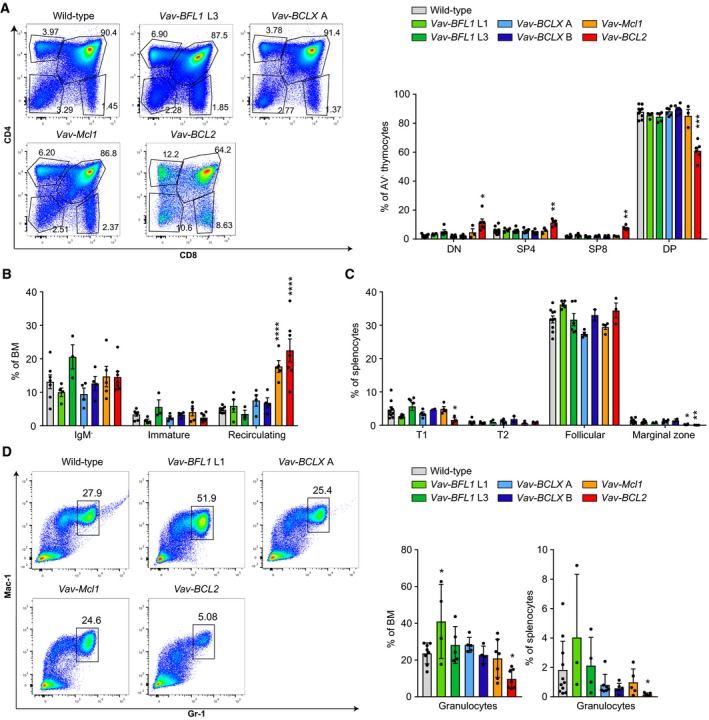
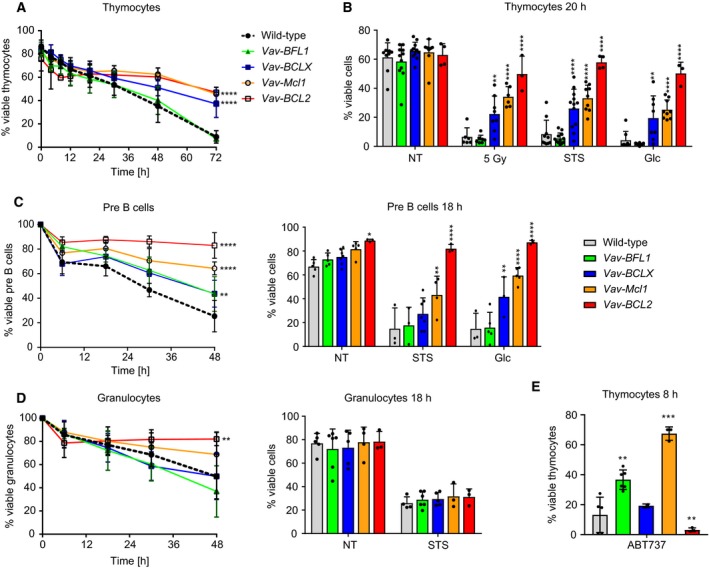
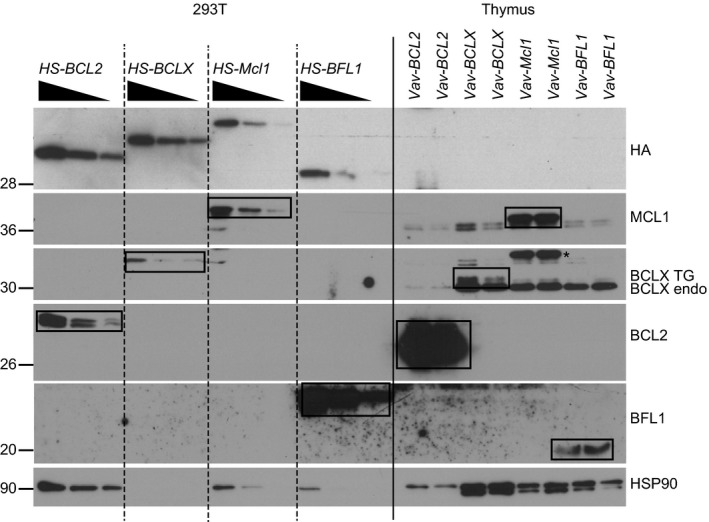
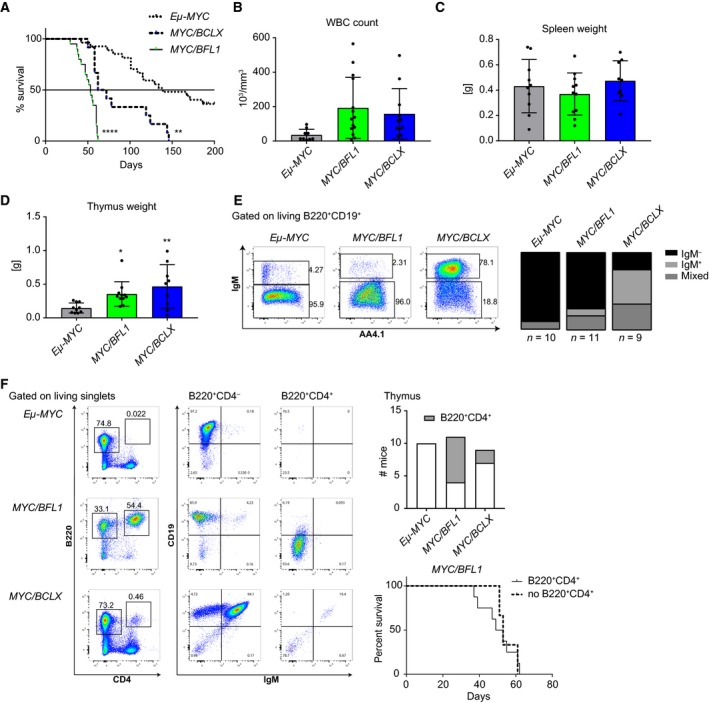
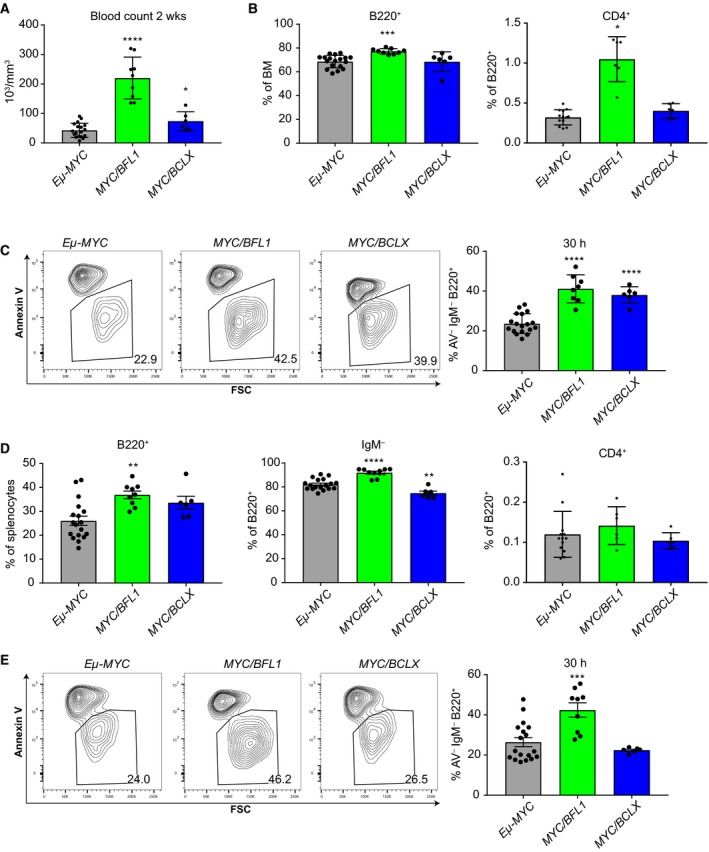
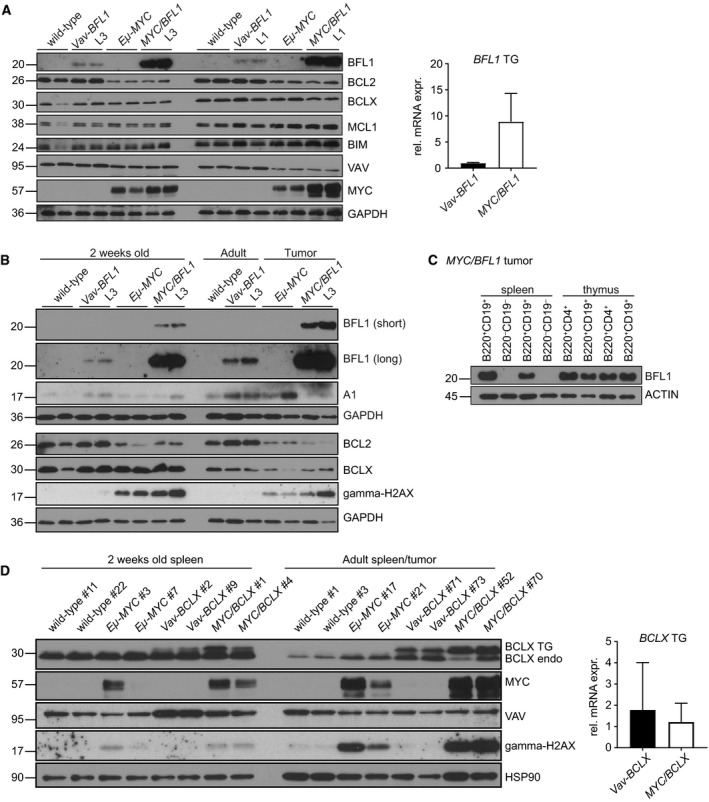
Overexpression of BCLX and BFL1/A1 has been reported in various human malignancies and is associated with poor prognosis and drug resistance, identifying these prosurvival BCL2 family members as putative drug targets. We have generated transgenic mice that express human BFL1 or human BCLX protein throughout the haematopoietic system under the control of the Vav gene promoter. Haematopoiesis is normal in both the Vav-BFL1 and Vav-BCLX transgenic (TG) mice and susceptibility to spontaneous haematopoietic malignancies is not increased. Lymphoid cells from Vav-BCLX TG mice exhibit increased resistance to apoptosis in vitro while most blood cell types form Vav-BFL1 TG mice were poorly protected. Both transgenes significantly accelerated lymphomagenesis in Eμ-MYC TG mice and, surprisingly, the Vav-BFL1 transgene was the more potent. Unexpectedly, expression of transgenic BFL1 RNA and protein is significantly elevated in B lymphoid cells of Vav-BFL1/Eμ-MYC double-transgenic compared to Vav-BFL1 mice, even during the preleukaemic phase, providing a rationale for the potent synergy. In contrast, Vav-BCLX expression was not notably different. These mouse models of BFL1 and BCLX overexpression in lymphomas should be useful tools for the testing the efficacy of novel human BFL1- and BCLX-specific inhibitors.

Keywords: BCLX; BFL1/A1; MYC; Vav-promoter; apoptosis; lymphomagenesis.


Figures

Figure 1
Figure 1
Characterization of transgene expression and composition of haematopoietic organs in Vav‐BFL1 and Vav‐BCLX TG mice. (A) Bone marrow, spleen, thymus and lymph nodes were isolated from 8–12‐week‐old wild‐type, Vav‐BFL1 (L1) and Vav‐BFL1 (L3) mice, respectively, and processed for western blotting using anti‐BFL1‐ and anti‐HSP90‐specific antibodies. (B) Bone marrow, lymph nodes, spleen and thymus were isolated from wild‐type, Vav‐BCLX (A), Vav‐BCLX (B) or Vav‐Mcl1 mice and processed for western analysis using anti‐BCLX‐ and anti‐HSP90‐specific antibodies. (C) Peripheral blood was sampled from mice of the indicated genotypes and white blood cell counts were determined by using a ScilVet abc blood counter (left bar graph). WBCs were further characterized as either lymphocytes (middle bar graph) or granulocytes (right bar graph). (D) Cell counts were determined from bone marrow (both femurs, left bar graph), thymus (middle bar graph) and spleen‐derived single‐cell suspensions (right bar graph). Data from Vav‐BFL1 TG line L1 and L3 and from Vav‐BCLX TG line A and line B were comparable and pooled for easier representation. (E) Representative spleen specimens from wild‐type, Vav‐BFL1 line L1, Vav‐BCLX line A, Vav‐Mcl1 and Vav‐BCL2 mice. Statistical analysis was performed using one‐way ANOVA with Dunnett's multiple comparison. *P < 0.05; ****P < 0.0001; n ≥ 4 ± SD.
Figure 2
Figure 2
Leukocyte subset composition in Vav‐BFL1 and Vav‐BCLX TG mice. (A) Representative dot‐plots of thymocytes from wild‐type, Vav‐BFL1 TG line L3, Vav‐BCLX TG line A, Vav‐Mcl1 TG and Vav‐BCL2 TG mice stained with antibodies specific for CD8 or CD4; bar graph summarizing the results (n = 3–4/genotype). (B) Flow cytometry was used to assess the distribution of B220loIgM pro‐/pre‐B cells, B220loIgM+IgD immature B cells, and B220hiIgM+IgD+ recirculating B cells in the bone marrow (BM). (C) Splenocytes were analysed for the presence of B220+CD23CD21loIgM+ transitional 1 (T1) B cells, B220+CD23+CD21hiIgMhi transitional 2 (T2) B cells, B220+CD23+CD21+IgM+ follicular B cells, and B220+CD23CD21hiIgMhi marginal zone B cells. (D) Representative dot‐plots of bone marrow from wild‐type, Vav‐BFL1, Vav‐BCLX, Vav‐Mcl1 and Vav‐BCL2 TG mice showing CD11b/Mac‐1+Gr‐1hi granulocytes. Bar graphs: quantification of the granulocytes in the bone marrow (left graph) and spleen (right graph). Statistical analysis was performed by using one‐way ANOVA with Dunnett's multiple comparison. *P < 0.05; **P < 0.01; ***P < 0.001; ****P < 0.0001; n ≥ 3 ± SD.
Figure 3
Figure 3
Transgenic BCLX protects lymphocytes more potently from apoptosis than BFL1. (A) Thymocytes from wild‐type, Vav‐BFL1 (both TG lines pooled), Vav‐BCLX (both TG lines pooled), Vav‐Mcl1 and Vav‐BCL2 TG mice were cultured in vitro for 72 h and apoptosis was assessed over time by flow cytometry. Cells negative for Annexin V and 7AAD were considered viable. (B) Thymocytes from wild‐type, Vav‐BFL1 (both lines pooled), Vav‐BCLX (both lines pooled), Vav‐Mcl1 and Vav‐BCL2 TG mice were either left untreated or exposed to 5 Gy γ‐irradiation, 100 nm staurosporine (STS) or 625 nm of the glucocorticoid (Glc), corticosterone respectively. Apoptosis was assessed after 20 h by flow cytometric analysis. (C) CD19+B220loIgMCD25+ pre‐B cells from the same mice were sorted by FACS from bone marrow and cultured for 48 h. Spontaneous apoptosis was assessed over time (left graph). In addition, sorted pre‐B cells were either left untreated or treated with 100 nm staurosporine (STS) or 625 nm corticosterone (Glc), respectively and apoptosis was assessed after 18 h by flow cytometry (right graph). (D) Gr‐1+ Granulocytes from mice of the indicated genotypes were sorted from the bone marrow and cultured for 48 h. Spontaneous apoptosis was assessed over time (left graph). Additionally, sorted granulocytes were cultured for 18 h either in the absence or presence of STS and apoptosis was assessed by flow cytometry (right graph). (E) Thymocytes were cultured in vitro for 8 h in the presence of 5 μm ABT‐737 and thereafter analysed for Annexin V and 7AAD positivity by flow cytometry. Statistical analysis was performed by using a two‐way ANOVA with Dunnett's multiple comparison. *P < 0.05; **P < 0.01; ***P < 0.001; ****P < 0.0001; n ≥ 3 ± SD.
Figure 4
Figure 4
Comparative analysis reveals substantial differences in transgene expression levels across different Vav‐TG mice. 293T cells were transiently transfected with plasmids encoding HA/Streptavidin‐tagged BCL2, BCLX, MCL1 and BFL1 respectively. Comparable amounts of HA‐tagged proteins were loaded in different dilution next to 20 μg total thymocyte extract from Vav‐BCL2, Vav‐BCLX, Vav‐Mcl1 and Vav‐BFL1 TG mice respectively. Protein levels of HA‐tagged and transgenic BFL1, MCL1, BCLX, BCL2 and, for reference, HSP90 were assessed by western blotting.
Figure 5
Figure 5
Vav‐BFL1 and Vav‐BCLX transgenes accelerate lymphomagenesis in Eμ‐Myc mice. (A) Kaplan–Meier plot of MYC‐induced lymphomagenesis in Eμ‐MYC TG (n = 27), Eμ‐MYC/Vav‐BFL1 (L3 and L1 pooled, n = 17) and Eμ‐MYC/Vav‐BCLX (A, n = 11) DT mice. (B) White blood cell counts (WBC) were analysed in tumour‐bearing mice. Thereafter, mice were sacrificed and (C) spleen and (D) thymus weights were assessed. (E) Representative dot‐plots of the tumour phenotype found in the spleen. Overall tumour phenotype quantification (see Tables S1–S3) is shown on the right. IgM refers to CD19+B220+IgM lymphoma cells, IgM+ refers to CD19+B220+IgM+ lymphoma cells, mixed refers to lymphomas containing both, CD19+B220+IgM and CD19+B220+IgM+ tumour cell types (F) Representative dot‐plots of stem/progenitor cell lymphomas in the thymus. Other than B220+CD4 lymphoma cells B220+CD4+ lymphoma cells do not express CD19. Bar graph: Quantification of CD19B220+CD4+ stem/progenitor cell lymphomas in the thymus. Kaplan–Meier plot: Survival curve of Eμ‐MYC/Vav‐BFL1 DT mice with or without B220+CD4+ stem/progenitor cell lymphomas in their thymus. Statistical analysis for tumour‐free survival was performed by using a log‐rank (Mantel–Cox) test. All other statistical analyses were performed by using a one‐way ANOVA with Holm‐Sidak's multiple comparison test compared to Eμ‐MYC TG. *P < 0.05; **P < 0.01; ****P < 0.0001; n ≥ 9 ± SD.
Figure 6
Figure 6
BFL1 overexpression protects premalignant immature B cells from MYC‐induced apoptosis. (A) White blood cell counts from 2–week‐old premalignant Eμ‐MYC, Eμ‐MYC/Vav‐BFL1 (L1 and L3 pooled), and Eμ‐MYC/Vav‐BCLX (line A) mice were assessed. (B) Percentage of B220+ B lymphoid cells in the bone marrow was analysed by flow cytometry (left bar). B220+ cells were further discriminated into CD19CD4+ cells (right bar). (C) Total bone marrow was cultured for 30 h and the abundance of living (Annexin V) B220+IgM immature B lymphoid cells was assessed by flow cytometry. (D) Abundance of total B220+ B lymphoid cells in the spleen was analysed by flow cytometry (left graph). B220+ cells were further discriminated into CD19+IgM (middle graph) and CD19CD4+ cells (right graph). (E) Total splenocytes were cultured for 30 h and abundance of living (Annexin V) B220+IgM immature B lymphoid cells was assessed by flow cytometry. Statistical analysis was performed by using a one‐way ANOVA with Dunnett's multiple comparison test compared to Eμ‐MYC control. *P < 0.05; **P < 0.01; ***P < 0.001; ****P < 0.0001; n ≥ 3 ± SD.
Figure 7
Figure 7
MYC elevates BFL1 mRNA and protein levels (A) Spleens were dissected from 2‐week‐old wild‐type, Vav‐BFL1 (L3) TG, Eμ‐MYC TG, Eμ‐MYC/Vav‐BFL1 (L3) DT, Vav‐BFL1 (L1) TG and Eμ‐MYC/Vav‐BFL1 (L1) DT mice and, following erythrocyte depletion, cells were lysed in NP‐40 containing buffer for western analysis using antibodies specific for the indicated proteins. mRNA was isolated from spleens from 2‐week‐old Vav‐BFL1 (L3) TG and Eμ‐MYC/Vav‐BFL1 (L3) DT mice, transcribed into cDNA and assessed for BFL1 expression levels. (B) Spleens from 2‐week‐old wild‐type, Vav‐BFL1 (L3) TG, Eμ‐MYC TG and Eμ‐MYC/Vav‐BFL1 (L3) DT mice as well as from adult wild‐type and Vav‐BFL1 (L3) TG and tumour‐bearing Eμ‐MYC TG and Eμ‐MYC/Vav‐BFL1 (L3) DT mice were isolated and erythrocyte‐depleted cell preparations were lysed in NP‐40 containing lysis buffer. Western blots were probed for indicated proteins. (C) B220+CD19+ B lymphoid and B220CD19 non‐B lymphoid cells were isolated by FACS from spleens of tumour‐bearing Eμ‐MYC/Vav‐BFL1 DT mice. Furthermore, B220+CD19+ and B220+CD19CD4+ cells, respectively, were isolated from thymocytes of tumour‐bearing Eμ‐MYC/Vav‐BFL1 DT mice. Western blot analysis was performed as described in (A). (D) Spleens from 2‐week‐old wild‐type, Vav‐BCLX (line A) TG, Eμ‐MYC TG and Eμ‐MYC/Vav‐BCLX (A) DT mice as well as from adult wild‐type and Vav‐BCLX (A) TG and tumour‐bearing Eμ‐MYC TG and Eμ‐MYC/Vav‐BCLX (line A) DT mice were isolated and erythrocyte‐depleted cells were lysed in NP‐40 containing lysis buffer. Western blots were probed for the indicated proteins using specific antibodies. mRNA was isolated from spleens from 2‐week‐old Vav‐BCLX (line A) TG, and Eμ‐MYC/Vav‐BCLX (line A) DT mice, transcribed into cDNA and assessed for FLAG‐BCLX expression levels.

Similar articles

Cited by

References

    1. Lin EY, Orlofsky A, Berger MS & Prystowsky MB (1993) Characterization of A1, a novel hemopoietic‐specific early‐response gene with sequence similarity to bcl‐2. J Immunol 151, 1979–1988. - PubMed
    1. Orlofsky A, Somogyi RD, Weiss LM & Prystowsky MB (1999) The murine antiapoptotic protein A1 is induced in inflammatory macrophages and constitutively expressed in neutrophils. J Immunol 163, 412–419. - PubMed
    1. Verschelde C, Walzer T, Galia P, Biemont MC, Quemeneur L, Revillard JP, Marvel J & Bonnefoy‐Berard N (2003) A1/Bfl‐1 expression is restricted to TCR engagement in T lymphocytes. Cell Death Differ 10, 1059–1067. - PubMed
    1. Grumont RJ, Rourke IJ & Gerondakis S (1999) Rel‐dependent induction of A1 transcription is required to protect B cells from antigen receptor ligation‐induced apoptosis. Genes Dev 13, 400–411. - PMC - PubMed
    1. Hatakeyama S, Hamasaki A, Negishi I, Loh DY, Sendo F & Nakayama K (1998) Multiple gene duplication and expression of mouse bcl‐2‐related genes, A1. Int Immunol 10, 631–637. - PubMed

Publication types

MeSH terms

Substances