. 2018 Mar 2;14(3):e1005983.
doi: 10.1371/journal.pcbi.1005983. eCollection 2018 Mar.

Population-specific design of de-immunized protein biotherapeutics

Affiliations

Population-specific design of de-immunized protein biotherapeutics

Benjamin Schubert et al. PLoS Comput Biol. .

Abstract

Immunogenicity is a major problem during the development of biotherapeutics since it can lead to rapid clearance of the drug and adverse reactions. The challenge for biotherapeutic design is therefore to identify mutants of the protein sequence that minimize immunogenicity in a target population whilst retaining pharmaceutical activity and protein function. Current approaches are moderately successful in designing sequences with reduced immunogenicity, but do not account for the varying frequencies of different human leucocyte antigen alleles in a specific population and in addition, since many designs are non-functional, require costly experimental post-screening. Here, we report a new method for de-immunization design using multi-objective combinatorial optimization. The method simultaneously optimizes the likelihood of a functional protein sequence at the same time as minimizing its immunogenicity tailored to a target population. We bypass the need for three-dimensional protein structure or molecular simulations to identify functional designs by automatically generating sequences using probabilistic models that have been used previously for mutation effect prediction and structure prediction. As proof-of-principle we designed sequences of the C2 domain of Factor VIII and tested them experimentally, resulting in a good correlation with the predicted immunogenicity of our model.


Conflict of interest statement

The authors have declared that no competing interests exist.

Figures

Fig 1
Fig 1
(A) Contact map of Factor VIII’s C2 domain. The gray circles represent the known crystal structure (pdb: 3hny), while the orange dots represent predicted evolutionary couplings. (B) The tertiary structure of Factor VIII’s C2 domain (pdb: 3hny). (C) Statistical energy/fitness change density separated by HA severity status (red and yellow) and the complete maximum entropy landscape of single point mutations (blue). As expected, all known single point mutations with known HA severity status reside in the lower percentile of the energy landscape. The severe and moderate HA cases are clearly separable from the mild cases using the maximum entropy model prediction. In contrast, the two distributions cannot be clearly separated using FoldX predictions (D).
Fig 2
Fig 2
(A) Immunogenicity screening for three DRB1 alleles (DRB1*15:01, DRB1*03:01 and DRB1*07:01) with TEPITOPEpan. All peptides who’s predicted binding affinity fell into the 95% percentile of TEPITOPEpan’s score distributions have been considered epitopes. The blue regions depict the cumulative number of predicted epitopes per position and the orange regions depict the EC cumulative summary scores of top 70 ECs. Six immunogenic regions can be identified based on the in silico screening, with region 2,321 to 2,340 having the highest number of overlapping epitopes (9 out of 16 predicted epitopes) and was thus chosen as de-immunization target. It is comprised of the highest evolutionary coupling pairs. (B) The tertiary structure of Factor VIII’s C2 domain of with highlight immunogenic region selected for de-immunization redesign in blue. (C) The tertiary structure of Factor VIII’s C2 domain with marked top eight EC (red spheres) that coincide with the identified immunogenic region (blue).
Fig 3
Fig 3
Pareto front of de-immunized designs in percent change compared to the wild type with k = 1,2,3 mutations. Each design is a tradeoff between the immunogenicity and the protein fitness function and represents a new sequence (here represented as tertiary structures). Immunogenicity is approximated by the HLA binding affinity predictions for a set of HLA molecules weighted by their HLA allele frequency in a specific population. The red spheres within the tertiary structures mark the mutated residues.
Fig 4
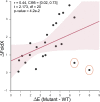
Fig 4. Evolutionary couplings-based model and FoldX prediction correlations.
The red line is a fitted linear regression, and the red tube represents its 95-confidence interval. The orange-circled dots are the two mutational designs with the highest discrepancy. FoldX predicted these two mutations less deleterious compared maximum entropy model, although both designs introduced a mutation at a membrane-binding site.
Fig 5
Fig 5
(A) Correlation of experimental and predicted immunogenicity of each peptide. The experimental immunogenicity score of a peptide is defined as the linear combination of the individual experimentally determined relative HLA binding affinity of each HLA allele h ∈ H weighted by the HLA allele frequency. (B) Correlation of experimental and predicted immunogenicity of the whole redesigned region. The summarized immunogenicity score of the whole region is the linear combination of the overlapping peptides used to reconstruct the region, normalized by total number of peptides used. The predicted immunogenicity scores per peptide were computed according to our immunogenicity objective function. The red lines are a fitted linear regression and the red tubes represent their 95-confidence interval.
Fig 6
Fig 6. Depiction of the parallel two-phase rectangle splitting approach.
(A) First, the boundaries of the Pareto front are identified. (B) Then, the space between the boundaries is evenly divided and searched in parallel for nondominated points using the ε-constraint method. (C) The identified nondominated points are used to initiate rectangle search spaces which can be processed in parallel using the standard rectangle-splitting approach, by splitting the rectangle in half and searching independently the bottom and top half (D). If the corner points of the rectangles are found during the search, it is proofs, that no further nondominated point resides within the search space and all points have been identified.

References

    1. Leader B, Baca QJ, Golan DE. Protein therapeutics: a summary and pharmacological classification. Nature Reviews Drug Discovery. 2008;7(1):21–39. doi: 10.1038/nrd2399 - DOI - PubMed
    1. Jiang K. Near-record number of approvals signals drug development shift. Nature medicine. 2013;19(2):114–. doi: 10.1038/nm0213-114 - DOI - PubMed
    1. Schellekens H. Bioequivalence and the immunogenicity of biopharmaceuticals. Nature reviews Drug discovery. 2002;1(6):457–62. doi: 10.1038/nrd818 - DOI - PubMed
    1. Krieckaert C, Rispens T, Wolbink G. Immunogenicity of biological therapeutics: from assay to patient. Current opinion in rheumatology. 2012;24(3):306–11. doi: 10.1097/BOR.0b013e3283521c4e - DOI - PubMed
    1. Ryu JK, Kim HS, Nam DH. Current status and perspectives of biopharmaceutical drugs. Biotechnology and Bioprocess Engineering. 2012;17(5):900–11.

Publication types

MeSH terms

Substances