. 2018 Mar 2;13(3):e0193596.
doi: 10.1371/journal.pone.0193596. eCollection 2018.

Ag85-focused T-cell immune response controls Mycobacterium avium chronic infection

Affiliations

Ag85-focused T-cell immune response controls Mycobacterium avium chronic infection

Bruno Cerqueira-Rodrigues et al. PLoS One. .

Abstract

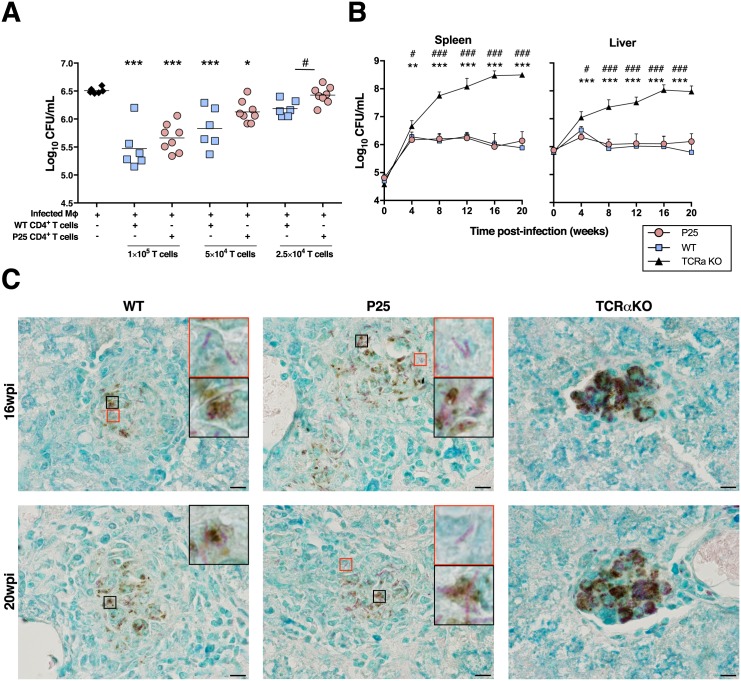
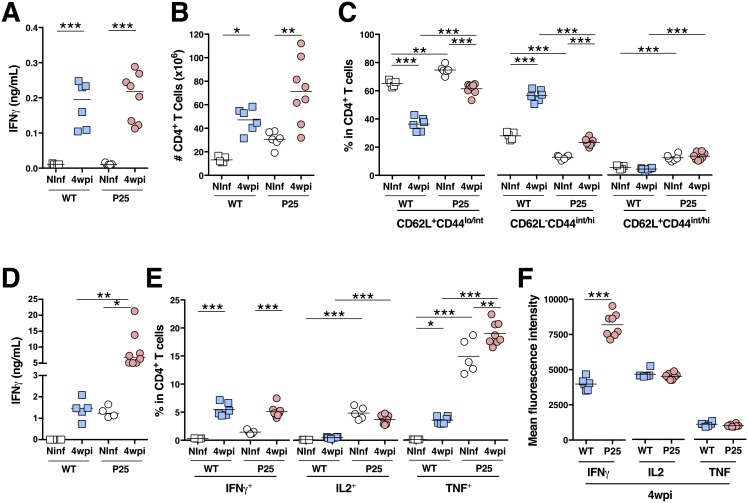
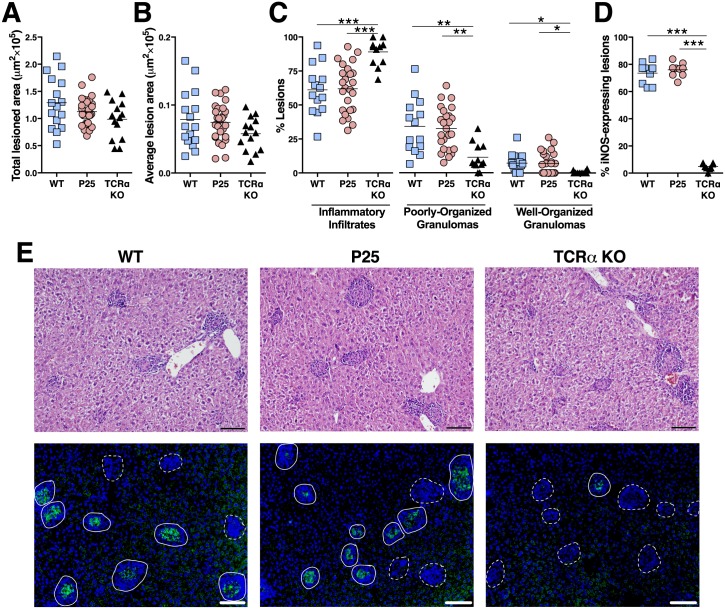
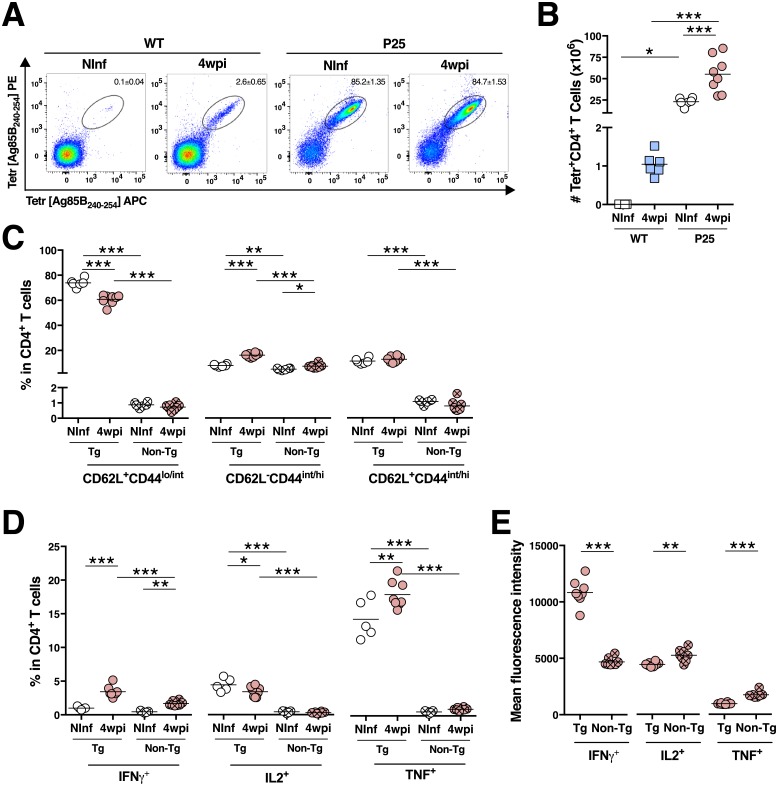
CD4+ T cells are essential players for the control of mycobacterial infections. Several mycobacterial antigens have been identified for eliciting a relevant CD4+ T cell mediated-immune response, and numerous studies explored this issue in the context of Mycobacterium tuberculosis infection. Antigen 85 (Ag85), a highly conserved protein across Mycobacterium species, is secreted at the early phase of M. tuberculosis infection leading to the proliferation of Ag85-specific CD4+ T cells. However, in the context of Mycobacterium avium infection, little is known about the expression of this antigen and the elicited immune response. In the current work, we investigated if a T cell receptor (TCR) repertoire mostly, but not exclusively, directed at Ag85 is sufficient to mount a protective immune response against M. avium. We show that P25 mice, whose majority of T cells express a transgenic TCR specific for Ag85, control M. avium infection at the same level as wild type (WT) mice up to 20 weeks post-infection (wpi). During M. avium infection, Ag85 antigen is easily detected in the liver of 20 wpi mice by immunohistochemistry. In spite of the propensity of P25 CD4+ T cells to produce higher amounts of interferon-gamma (IFNγ) upon ex vivo stimulation, no differences in serum IFNγ levels are detected in P25 compared to WT mice, nor enhanced immunopathology is detected in P25 mice. These results indicate that a T cell response dominated by Ag85-specific T cells is appropriate to control M. avium infection with no signs of immunopathology.


Conflict of interest statement

Competing Interests: The authors have declared that no competing interests exist.

Figures

Fig 1
Fig 1. P25 mice control M. avium growth to the same extent as WT mice.
A) CFU quantification on infected Mϕ, co-cultured with decreasing numbers CD4+ T cells isolated from WT or P25 mice at 4 wpi. * p<0.05, **p<0.005 and ***p<0.001 by one-way ANOVA test followed by Bonferroni post-hoc tests for the comparison of all groups to infected Mϕ, as a control; Student t-tests were performed for comparisons between the same amount of WT and P25 CD4+ T cells and represented by # for p<0.05. Depicted is one out of two independent experiments. B) Spleen (left) and liver (right) CFUs of WT, P25 and TCRα KO mice. Comparisons were performed by a two-way ANOVA test followed by Bonferroni post-hoc tests and differences marked with * are for comparisons of P25 vs. TCRα KO and with # for WT vs. TCRα KO; no significant differences are detected for the comparison of P25 vs. WT. * or # p<0.05, ** or ## p<0.005 and *** or ### p<0.001. Depicted is one (with 4 to 9 mice per group) out of two independent experiments. C) Representative liver sections stained for Ag58 (brown) of 16 and 20 wpi mice. Bacilli were detected by Ziehl-Neelsen staining (red). Scale bar, 10 μm.
Fig 2
Fig 2. P25 T cells expand and produce protective cytokines throughout M. avium infection.
A) IFNγ quantification in the serum from non-infected (Ninf) and from 4 wpi WT and P25 mice. B) Enumeration of splenic CD4+ T cells. C) Percentage of naive (CD62L+CD44lo/int; left), activated (CD62L-CD44int/hi; middle) and central memory (CD62L+CD44int/hi; right) cells among splenic CD4+ T cells. D) IFNγ quantification in splenocytes’ supernatant upon ex vivo stimulation with M. avium Ag85B240-254 peptide. E) Percentage of spleen IFNγ (left), IL2 (middle) and TNF+ cells among splenic CD4+ T cells upon stimulation with M. avium Ag85B240-254 peptide. F) Mean fluorescence intensity of IFNγ (left), IL2 (middle) or TNF (left). *p < 0.05, **p < 0.005 and ***p < 0.001 by two-way ANOVA followed by Bonferroni post-hoc tests (A to E) or by Student t-test (F). One out of two independent experiments is depicted.
Fig 3
Fig 3. No signs of immunopathology are detected in M. avium chronic infected P25 mice.
A) Assessment of the total lesioned area. B) Quantification of the average lesion size. C) Classification and percentage of each lesion type. D) Percentage of liver iNOS+ lesions. *p < 0.05, **p < 0.005 and ***p < 0.001 by one-way ANOVA test followed by Bonferroni post-hoc tests. A pool from three independent experiments is depicted. E) Representative histological liver sections stained by hematoxylin and eosin (top) or stained for iNOS (bottom); in the later, iNOS+ lesions (agglomerates of DAPI+ nuclei accompanied by iNOS stain; filled outlines) and iNOS- lesions (agglomerates of DAPI+ nuclei without iNOS stain; dashed outlines) are depicted. All assessments were performed on liver sections of WT, P25 and TCRα KO mice at 16 wpi. Scale bar, 100 μm.
Fig 4
Fig 4. Upon M. avium infection of P25 mice, TCR transgenic CD4+ T cells are preferably more activated then their non-transgenic peers.
A) Representative FACS plot of Ag85B240-254-tetramer+ cells gated on CD4+ T cells. B) Enumeration of Ag85B240-254-tetramer+ CD4+ T cells in the spleen of non-infected (Ninf) and of 4 wpi WT and P25 mice. C) Percentage of naive (CD62L+CD44lo/int; left), activated (CD62L-CD44int/hi; middle) and central memory (CD62L+CD44int/hi; right) cells which are TCR transgenic (Tg; identified as VαMix-Vβ11+) or non-transgenic (Non-Tg; identified as all that are not VαMix-Vβ11+) among CD4+ T cells from spleens from non-infected or from 4wpi P25 mice. D) Percentage of IFNγ+ (left), IL2+ (middle) and TNF+ cells (left) upon ex vivo stimulation with M. avium Ag85B240-254, among P25 transgenic or non-transgenic CD4+ T cells. E) Mean fluorescence intensity of IFNγ (left), IL2 (middle) and TNF (left), among cytokine-positive transgenic or non-transgenic CD4+ T cells. *p < 0.05, **p < 0.005 and ***p < 0.001 by two-way ANOVA followed by Bonferroni post-hoc tests (B to D) or by Student t-test (E). One out of three independent experiments is depicted.

References

    1. Luo W, Su J, Zhang X-B, Yang Z, Zhou M-Q, Jiang Z-M, et al. Limited T Cell Receptor Repertoire Diversity in Tuberculosis Patients Correlates with Clinical Severity. PLoS One. 2012;7: e48117 doi: 10.1371/journal.pone.0048117 - DOI - PMC - PubMed
    1. Du G, Chen CY, Shen Y, Qiu L, Huang D, Wang R, et al. TCR Repertoire, Clonal Dominance, and Pulmonary Trafficking of Mycobacterium-Specific CD4+ and CD8+ T Effector Cells in Immunity Against Tuberculosis. J Immunol. 2010;185: 3940–3947. doi: 10.4049/jimmunol.1001222 - DOI - PMC - PubMed
    1. Tully G, Kortsik C, Hohn H, Zehbe I, Hitzler WE, Neukirch C, et al. Highly Focused T Cell Responses in Latent Human Pulmonary Mycobacterium tuberculosis Infection. J Immunol. 2005;174: 2174–2184. doi: 10.4049/jimmunol.174.4.2174 - DOI - PubMed
    1. Jacobsen M, Detjen AK, Mueller H, Gutschmidt A, Leitner S, Wahn U, et al. Clonal expansion of CD8+ effector T cells in childhood tuberculosis. J Immunol. 2007;179: 1331–9. doi: 10.4049/jimmunol.179.2.1331 - DOI - PubMed
    1. Nunes-Alves C, Booty MG, Carpenter SM, Rothchild AC, Martin CJ, Desjardins D, et al. Human and Murine Clonal CD8+ T Cell Expansions Arise during Tuberculosis Because of TCR Selection. PLoS Pathog. 2015;11: 1–29. doi: 10.1371/journal.ppat.1004849 - DOI - PMC - PubMed

Publication types

MeSH terms