. 2018 Mar 1;22(3):369-383.e8.
doi: 10.1016/j.stem.2018.02.004.

The Transcriptionally Permissive Chromatin State of Embryonic Stem Cells Is Acutely Tuned to Translational Output

Affiliations

The Transcriptionally Permissive Chromatin State of Embryonic Stem Cells Is Acutely Tuned to Translational Output

Aydan Bulut-Karslioglu et al. Cell Stem Cell. .

Abstract

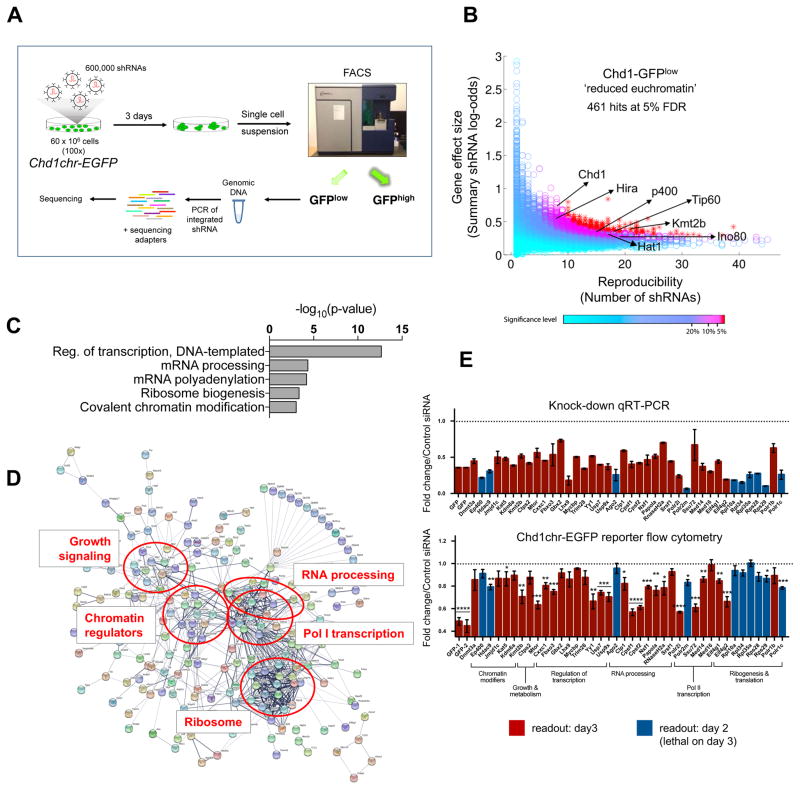
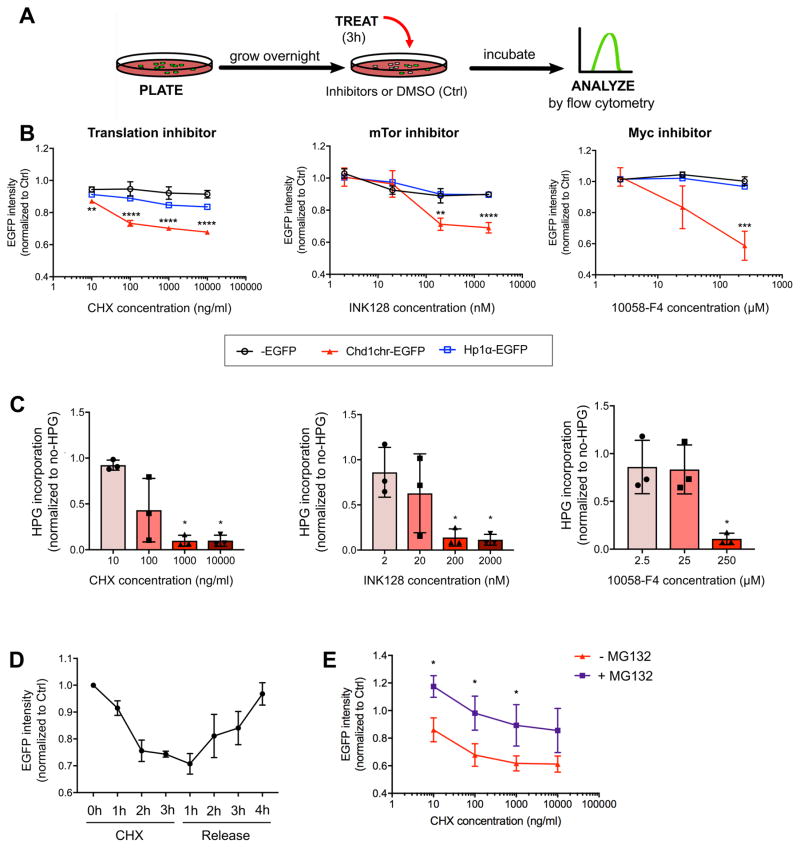
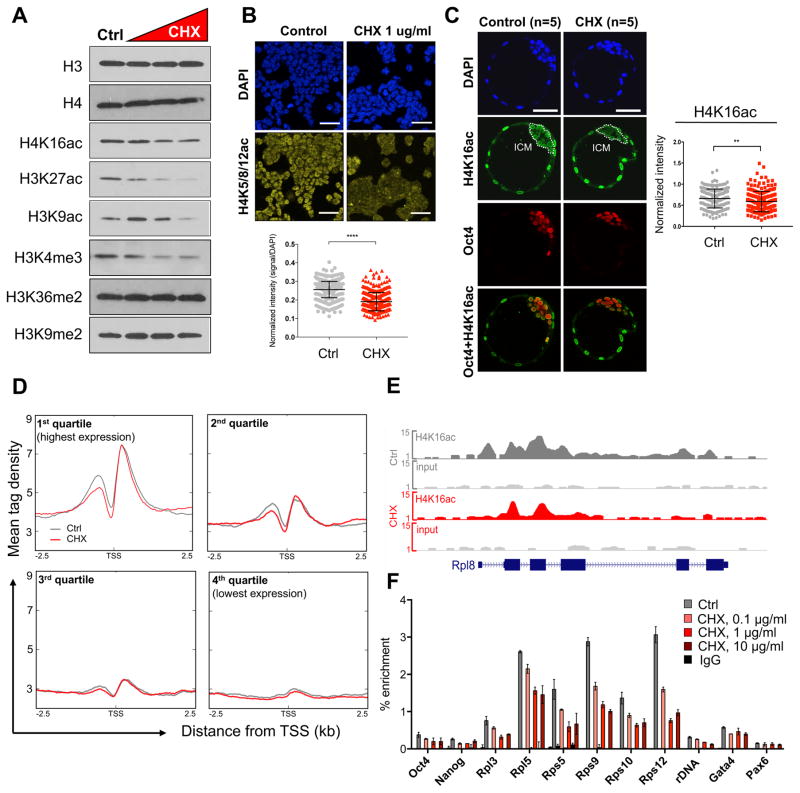
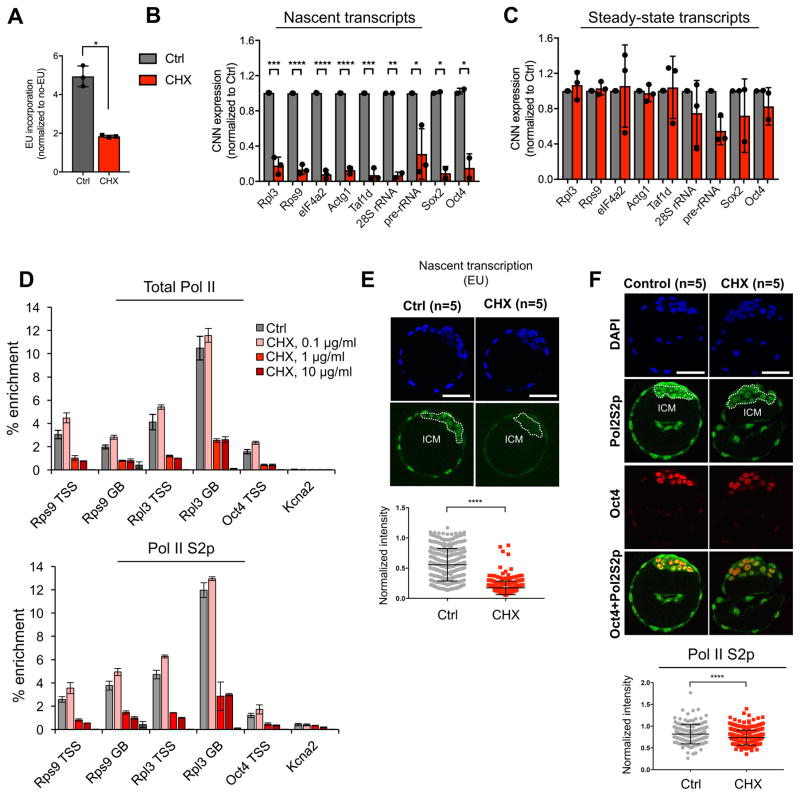
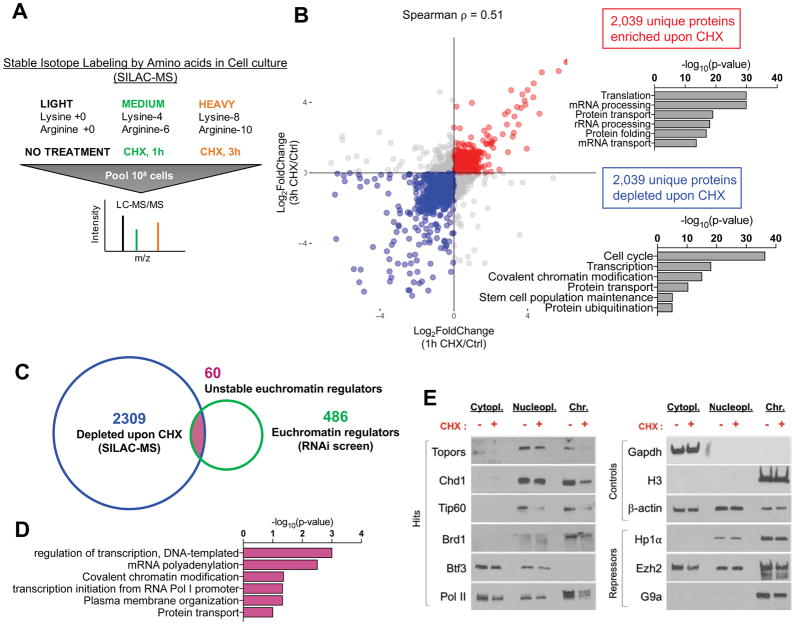
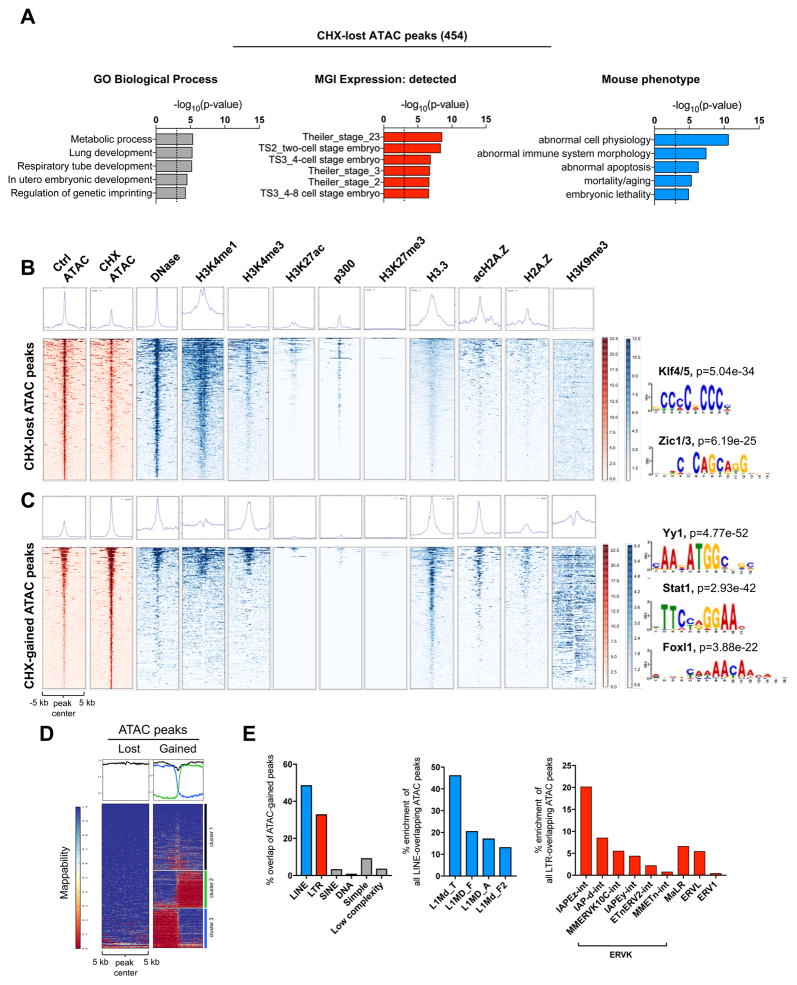
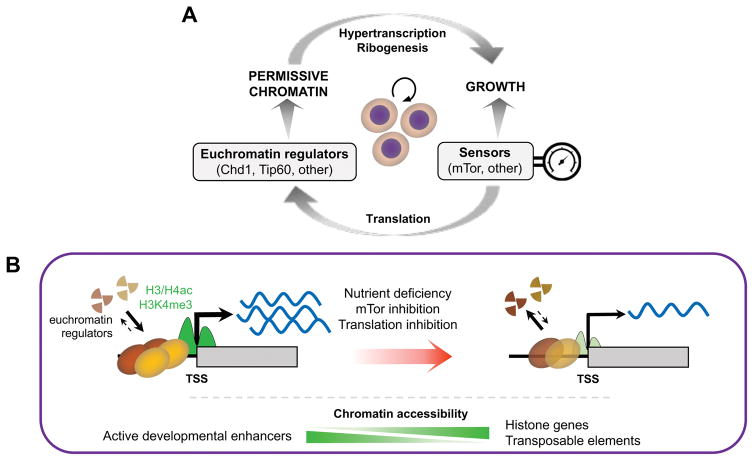
A permissive chromatin environment coupled to hypertranscription drives the rapid proliferation of embryonic stem cells (ESCs) and peri-implantation embryos. We carried out a genome-wide screen to systematically dissect the regulation of the euchromatic state of ESCs. The results revealed that cellular growth pathways, most prominently translation, perpetuate the euchromatic state and hypertranscription of ESCs. Acute inhibition of translation rapidly depletes euchromatic marks in mouse ESCs and blastocysts, concurrent with delocalization of RNA polymerase II and reduction in nascent transcription. Translation inhibition promotes rewiring of chromatin accessibility, which decreases at a subset of active developmental enhancers and increases at histone genes and transposable elements. Proteome-scale analyses revealed that several euchromatin regulators are unstable proteins and continuously depend on a high translational output. We propose that this mechanistic interdependence of euchromatin, transcription, and translation sets the pace of proliferation at peri-implantation and may be employed by other stem/progenitor cells.

Keywords: Chd1; blastocyst; embryonic stem cells; euchromatin; hypertranscription; mTOR; permissive chromatin; ribosome; translation.


Conflict of interest statement

DECLARATION OF INTERESTS

The authors declare no competing interests.

Figures

Figure 1
Figure 1. A genome-wide RNAi screen identifies regulators of euchromatin in ESCs
(A) RNAi screen workflow. (B) Results of the RNAi screen for the genes with shRNAs enriched in the GFPlow fraction. Each circle denotes a gene tested in the screen. Published regulators of open chromatin in ESCs are indicated by arrows. See Table S1 for the full screen results. (C) Gene ontology (GO) terms associated with significant RNAi screen hits. See Table S2 for the full list of GO terms. (D) Protein interaction network of significant RNAi screen hits, generated using STRING. (E) Secondary siRNA screen results. Genes were selected to represent each of the major pathways enriched in (C) and (D). Upper panel shows knockdown levels by qRT-PCR, normalized to scrambled siRNA control. Lower panel shows fluorescence level of the Chd1chr-EGFP reporter upon each knockdown. Readouts for both assays were measured on day 3 post-knockdown (red) or on day 2 (blue) if the knockdown was lethal by day 3. See STAR methods and Table S3 for details. Error bars show mean ± standard deviation (SD) of 4 technical replicates. Graph is representative of 2 biological replicates. Statistical test performed is two-tailed t-test. *, p<0.05; **, p<0.01; ***, p<0.001; ****, p<0.0001.
Figure 2
Figure 2. Translation, mTor and Myc dynamically regulate euchromatin reporter activity
(A) Schematic of small molecule-mediated inhibition. (B) Response of the Chd1chr-EGFP, Hp1α-EGFP and control EGFP ESCs to inhibition of translation, mTor, or Myc/Max at the indicated doses for 3 hours. Cells were treated with DMSO as control. Graphs show mean ± SD of median fluorescence intensity (MFI) normalized to control cells of at least 3 technical replicates and are representative of 2 biological replicates. Statistical significance was determined by a two-tailed Student’s t-test. (C) Levels of nascent protein synthesis in wild-type ESCs assessed by L-homopropargylglycine (HPG) incorporation during 3h inhibition of translation, mTor or Myc at the indicated doses. MFI was normalized to no-HPG controls and represented as a fraction of control (DMSO-treated) cells for each experiment. Each point represents a biological replicate. Error bars show mean ± SD. (D) Recovery of Chd1chr-EGFP reporter fluorescence following CHX (100 ng/ml) removal. Graph depicts mean ± SD of MFI of 4 technical replicates and is representative of 2 biological replicates. (E) Proteasome inhibition partially rescues the effect of CHX on Chd1chr-EGFP intensity. Chd1chr-EGFP reporter ESCs were treated with DMSO or CHX ± MG132 (proteasome inhibitor) for 3h at the indicated doses. Fluorescence is reported as above. Graph depicts mean ± SD of MFI of 3 biological replicates. Statistical significance was determined by Student’s unpaired t-test. *, p<0.05; **, p<0.01; ***, p<0.001; ****, p<0.0001.
Figure 3
Figure 3. Inhibition of translation rapidly induces depletion of euchromatin marks in ESCs and blastocysts
(A) Levels of indicated histone modifications upon 3 hours of CHX treatment at 0.1, 1 or 10μg/ml. See Figure S4A for biological replicates and quantifications. (B) Immunofluorescent detection and quantification of H4 acetylation (H4 K5/8/12) in DMSO- or CHX-treated ESCs. (C) Immunofluorescent detection of H4K16ac in control or CHX-treated (3 hours) E4.5 blastocysts and quantification in each Oct4+ cell (right panel). A representative z-section of each embryo is shown. (D) Correlation of CHX-induced H4K16ac changes with quartile of gene expression in ESCs (Bulut-Karslioglu et al., 2016). Profiles depict ChIP-seq tag density over annotated TSSs extended 2.5 kb upstream and downstream (3 hours CHX, 1 μg/ml). (E) Representative genome browser view depicting H4K16ac in DMSO- or CHX-treated cells over the ribosomal protein gene Rpl8. (F) ChIP-qPCR documenting a dose-dependent response of H4K16ac following 3 hours of CHX. Error bars show mean ± SD of 3 technical replicates. Scale bars denote 50 μm. Statistical tests are two-tailed t-tests with Welch’s correction. **, p<0.01; ****, p<0.0001.
Figure 4
Figure 4. Nascent transcription is acutely sensitive to inhibition of translation in pluripotent cells
(A) Levels of global nascent RNA synthesis assessed by EU incorporation in DMSO- or CHX-treated (3 hours) ESCs. MFI was normalized to no-EU controls for each experiment. Each point represents a biological replicate. (B) Nascent RNA capture followed by qRT-PCR in DMSO- or CHX-treated cells. Error bars show mean ± SD of 3 biological replicates. (C) Steady-state mRNA levels of genes shown in (B) in DMSO- and CHX-treated cells. No statistically significant differences were detected by Student’s t-tests with the Holm multiple comparisons correction. (D) Enrichment of total or elongating (S2p, lower panel) RNA Pol II at TSSs and gene bodies (GB) of selected genes in DMSO- or CHX-treated cells. Graph depicts mean ± SD of 3 technical replicates and is representative of 2 biological replicates. (E) Levels of nascent RNA synthesis assessed by EU incorporation in DMSO- or CHX-treated (3 hours) E4.5 blastocysts. A representative z-section of each embryo is shown. Scale bar denotes 50 μm. Right panel shows quantification of the EU signal in the ICM (indicated by white dotted lines). (F) Levels of elongating Pol II S2p in DMSO- or CHX-treated (3 hours) E4.5 blastocysts. Bottom panel shows quantification of the Pol II S2p signal in each Oct4+ cell. Statistical tests are two-tailed t-tests with Welch’s correction when applicable. *, p<0.05; **, p<0.01; ***, p<0.001; ****, p<0.0001.
Figure 5
Figure 5. Key euchromatin regulators are unstable proteins that are rapidly depleted at the chromatin upon translation inhibition in ESCs
(A) Schematic of SILAC-MS workflow. (B) Scatter plot for proteins detected by SILAC-MS following 1 or 3 hours of CHX treatment. CHX-enriched or -depleted proteins are shown in red or blue, respectively. Right panels show associated GO terms. (C) Venn diagram for the intersection of RNAi screen hits with unstable proteins as determined by SILAC-MS (blue set in B). 60 such genes were identified. (D) GO terms associated with the 60 overlapping genes in (C). (E) Western blots showing the abundance of indicated proteins in cellular fractions in DMSO- or CHX-treated (3 hours) cells. Left panel shows RNAi screen hits that are among the 60 proteins at the intersection shown in (C).
Figure 6
Figure 6. Inhibition of translation in ESCs induces reprogramming of chromatin accessibility at developmental enhancers, histone genes and transposable elements
(A) Functional terms associated with regions with loss of chromatin accessibility, determined by ATAC-seq, upon CHX treatment for 3 hours. See Table S7 for the full list of terms. (B, C) Heatmaps for enrichment of indicated histone modifications, variants and DNase-accessible sites on CHX-lost (B) or CHX-gained (C) ATAC-seq peaks. See Key Resources Table for details on public datasets. Right panels show enriched DNA motifs. (E) Heatmaps showing levels of mappability of CHX-lost or CHX-gained ATAC-seq peaks. The CHX-gained heatmap is divided into three clusters to denote regions of distinct mappability. (F) Enrichment of repetitive elements over CHX-gained ATAC-seq peaks.
Figure 7
Figure 7. Proposed model for the dynamic feedback between translation, chromatin and transcription in ESCs
(A) The permissive chromatin state of ESCs promotes growth by sustaining hypertranscription and ribogenesis, whereas growth promotes the permissive chromatin state by sustaining high levels of translational output. Signaling and nutrient sensors such as mTor act as rheostats of this positive feedback loop. (B) The permissive chromatin state of ESCs responds rapidly to changes in translational output, in part due to the instability of euchromatin regulators. See Discussion for details.

Comment in

References

    1. Afgan E, Baker D, van den Beek M, Blankenberg D, Bouvier D, Čech M, Chilton J, Clements D, Coraor N, Eberhard C, Grüning B, Guerler A, Hillman-Jackson J, Kuster Von G, Rasche E, Soranzo N, Turaga N, Taylor J, Nekrutenko A, Goecks J. The Galaxy platform for accessible, reproducible and collaborative biomedical analyses: 2016 update. Nucleic Acids Res. 2016;44:W3–W10. doi: 10.1093/nar/gkw343. - DOI - PMC - PubMed
    1. Ahmed K, Dehghani H, Rugg-Gunn P, Fussner E, Rossant J, Bazett-Jones DP. Global chromatin architecture reflects pluripotency and lineage commitment in the early mouse embryo. PLoS ONE. 2010;5:e10531. doi: 10.1371/journal.pone.0010531. - DOI - PMC - PubMed
    1. Ang YS, Tsai SY, Lee DF, Monk J, Su J, Ratnakumar K, Ding J, Ge Y, Darr H, Chang B, Wang J, Rendl M, Bernstein E, Schaniel C, Lemischka IR. Wdr5 mediates self-renewal and reprogramming via the embryonic stem cell core transcriptional network. Cell. 2011;145:183–197. doi: 10.1016/j.cell.2011.03.003. - DOI - PMC - PubMed
    1. Bassik MC, Lebbink RJ, Churchman LS, Ingolia NT, Patena W, LeProust EM, Schuldiner M, Weissman JS, McManus MT. Rapid creation and quantitative monitoring of high coverage shRNA libraries. Nature Methods. 2009;6:443–445. doi: 10.1038/nmeth.1330. - DOI - PMC - PubMed
    1. Belle A, Tanay A, Bitincka L, Shamir R, O’Shea EK. Quantification of protein half-lives in the budding yeast proteome. Proc Natl Acad Sci USA. 2006;103:13004–13009. doi: 10.1073/pnas.0605420103. - DOI - PMC - PubMed

Publication types

MeSH terms