. 2018 Apr 1:344:23-34.
doi: 10.1016/j.taap.2018.02.019. Epub 2018 Feb 27.

Multidimensional chemobehavior analysis of flavonoids and neuroactive compounds in zebrafish

Affiliations

Multidimensional chemobehavior analysis of flavonoids and neuroactive compounds in zebrafish

Sean M Bugel et al. Toxicol Appl Pharmacol. .

Abstract

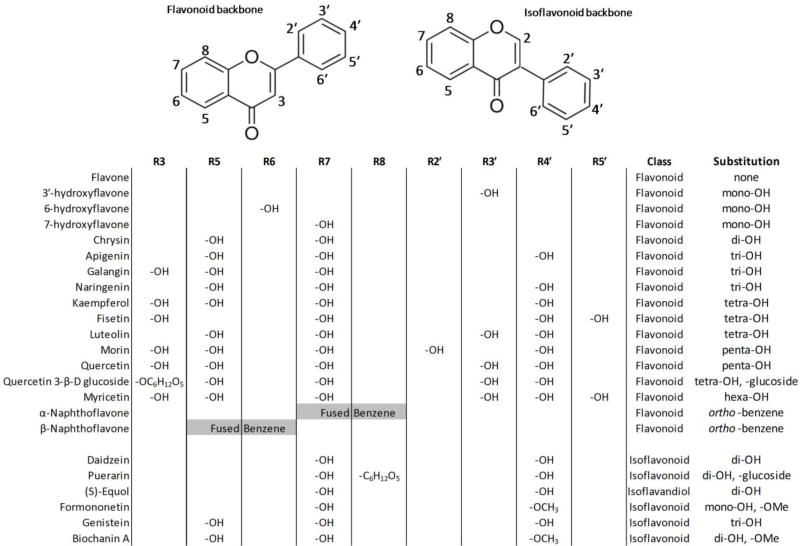
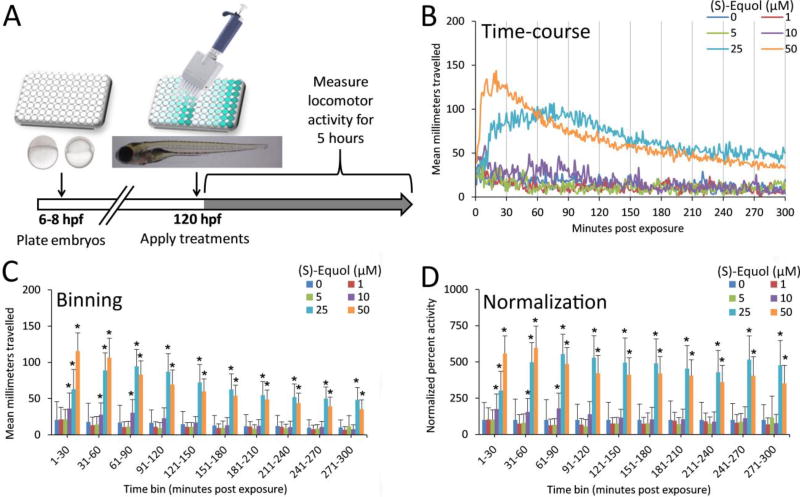
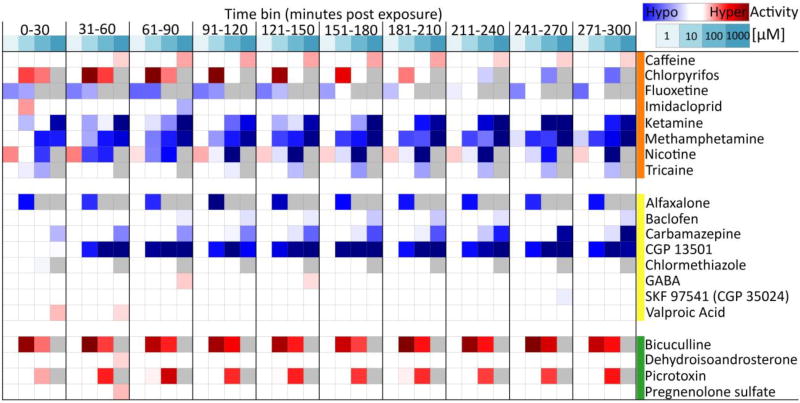
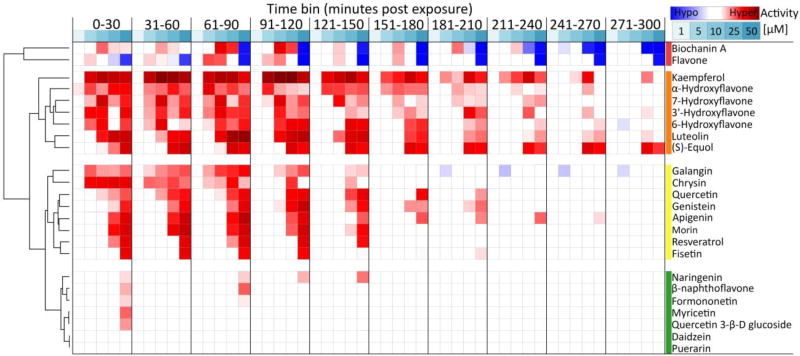
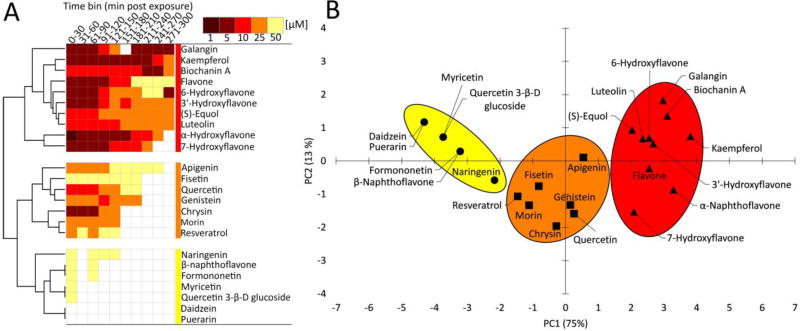
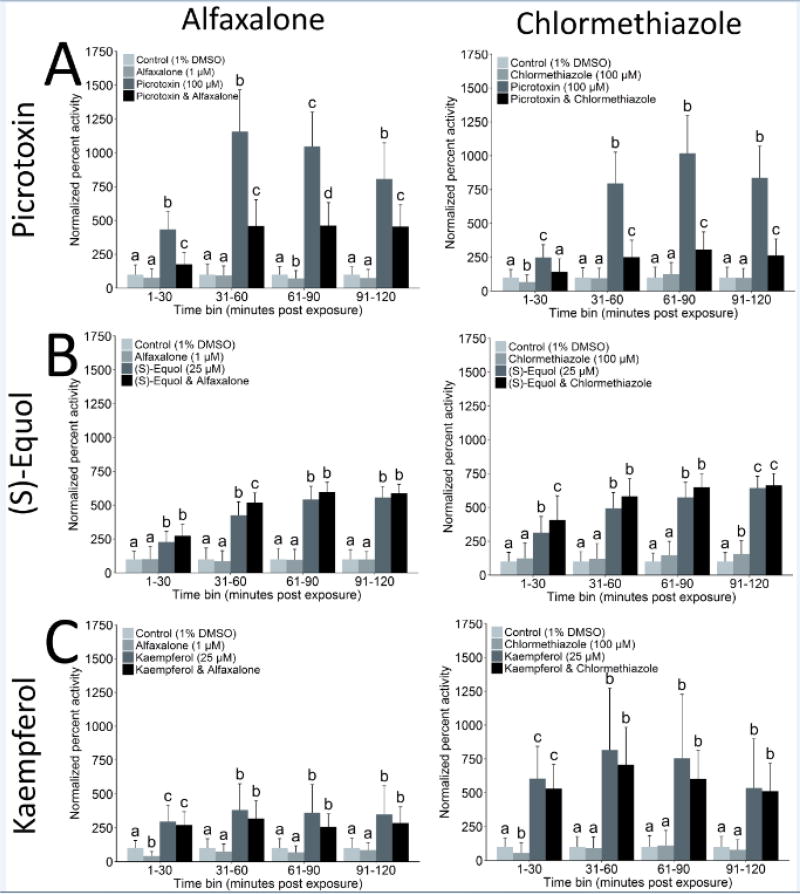
The comparative analysis of complex behavioral phenotypes is valuable as a reductionist tool for both drug discovery and defining chemical bioactivity. Flavonoids are a diverse class of chemicals that elicit robust neuroactive and hormonal actions, though bioactivity information is limited for many, particularly for neurobehavioral endpoints. Here, we used a zebrafish larval chemomotor response (LCR) bioassay to comparatively evaluate a suite of 24 flavonoids, and in addition a panel of 30 model neuroactive compounds representing diverse modes of action (e.g. caffeine, chlorpyrifos, methamphetamine, nicotine, picrotoxin). Naïve larval zebrafish were exposed to concentration ranges of each compound at 120 hour post-fertilization (hpf) and locomotor activity measured for 5 h. The model neuroactive compounds were largely behaviorally bioactive (20 of 30) with most effects phenotypic of their known modes of action. Flavonoids rapidly and broadly elicited hyperactive locomotor effects (22 of 24). Multidimensional analyses compared responses over time and identified three distinct bioactive groups of flavonoids based on efficacy and potency. Using GABAergics to modulate hyperactive responses, two flavonoids, (S)-equol and kaempferol were tested for GABAA receptor antagonism, as well as a known GABAA receptor antagonist, picrotoxin. Pharmacological intervention with positive allosteric modulators of the GABAA receptor, alfaxalone and chlormethiazole, ameliorated the hyperactive response to picrotoxin, but not for (S)-equol or kaempferol. Taken together, these studies demonstrate that flavonoids are differentially bioactive and that the chemobehavioral effects likely do not involve a GABAA receptor mediated mode of action. Overall, the integrative zebrafish platform provides a useful framework for comparatively evaluating high-content chemobehavioral data for sets of structurally- and mechanistically-related flavonoids and neuroactive compounds.

Keywords: Behavior; Flavonoids; GABA receptor; Locomotion; Neurotoxicity; Zebrafish.


Conflict of interest statement

The authors declare they have no potential conflicts of interest.

Figures

Fig. 1
Fig. 1
Backbones and substituent groups for all tested flavonoids and isoflavonoids. Also tested but not shown is resveratrol, a flavonoid-like stilbenoid.
Fig. 2
Fig. 2
Exposure paradigm and data analysis pipeline for the larval chemomotor response assay. (A) Naïve larval zebrafish were cultured from 6–120 hpf, then exposed to test chemicals at 120 hpf to evaluate acute locomotor behavioral effects of various flavonoids and neuropharmacologicals across a concentration range. (B) Example of a 5-hour time-course of locomotor activity following exposure to (S)-equol across a broad concentration range (1–50 µM) in 0.1% DMSO. (C) Locomotor activity was binned into 30 min time-bins across the 5-hour exposure. (D) Within each 30 min time-bin, locomotor activity was normalized to the relative control (percent activity). Heat maps of locomotor activity were generated using binned and normalized data to comparatively evaluate locomotor responses of chemicals sets. *Significance determined using two-way repeated measures ANOVA with Tukey’s post-hoc, p ≤ 0.05, N = 16 animals per concentration. Data transformed using Box-Cox power transformation for normality prior to analysis. Data are reported as mean ± SD for normalized activity relative to the control within each time group. Summary data and statistics (time-course, binned, and normalized plots, 95% CI, N-values and p-values) for all tested flavonoids and neuropharmacologicals are provided in Supplementary Materials.
Fig. 3
Fig. 3
A concentration-response heat map for comparatively evaluating acute locomotor behavioral responses to various neuroactive drugs and toxicants (orange group), GABA receptor agonists and positive allosteric modulators (yellow group), and GABA receptor antagonists and negative allosteric modulators (green group). All 30 chemicals in Table 1 were tested, and those that did not elicit any significant effects on locomotor activity exceeding the 1.5 fold change cutoff threshold are not shown (bumetanide, dopamine, epinephrine, ethanol, mecamylamine, methyllycaconitine, NMDA, pentylenetetrazol, muscimol, SCH 50911). A standard concentration range of 1, 10, 100, and 1000 µM was evaluated, with solubility and lethality issues permitting (see Table 1 and Supplemental Materials). Concentrations unable to be tested are shaded gray. Locomotor activity was binned into 30 min blocks and normalized to the respective time-bin control group (0.1% DMSO). Shaded cells indicate the normalized mean percent activity of animals relative to controls only when significantly different from control groups and exceeding a 1.5 fold change cutoff threshold. Significance determined using two-way repeated measures ANOVA with Tukey’s post-hoc, p ≤ 0.05, N = 16–32 animals per treatment group. Summary statistics for all 30 tested compounds are provided in Supplementary Materials.
Fig. 4
Fig. 4
A concentration-response heat map for comparatively evaluating acute locomotor behavioral responses to flavonoids and flavonoid-like compounds. All 24 chemicals in Table 2 were tested and a standard concentration range of 1, 5, 10, 25, and 50 µM was evaluated. Locomotor activity was binned into 30 min blocks and normalized to the respective time-bin control group (0.1% DMSO). Shaded cells indicate the normalized mean percent activity of animals relative to controls only when significantly different from control groups and exceeding a 1.5 fold change cutoff threshold. Significance determined using two-way repeated measures ANOVA with Tukey’s post-hoc, p ≤ 0.05, N = 16 animals per treatment group. A Euclidian distance metric with complete linkage was used for hierarchical clustering analysis (HCA). Summary statistics for all 24 flavonoids tested are provided in Supplementary Materials.
Fig. 5
Fig. 5
Comparative evaluation of lowest effect levels (LEL) for flavonoid effects on locomotor activity across all time-bins using (A) hierarchical clustering analysis (HCA) and (B) principle component analysis. For HCA, a Euclidian distance metric with complete linkage was used. For PCA, a Pearson (n) metric with bootstrapped k-means clustering algorithm was used.
Fig 6
Fig 6
GABAA receptor specific pharmacological intervention of hyperactive behavioral effects for (A) picrotoxin as a model GABAA receptor antagonist, and two efficacious flavonoids: (B) (S)-equol and (C) kaempferol. Locomotor activity was measured for 5 hours immediately following application of treatments. Concentrations tested for picrotoxin, (S)-equol, and kaempferol were previously demonstrated to elicit a robust hyperactive response, and were 100, 25, and 25 µM, respectively. Two GABAA receptor specific positive allosteric modulators tested were alfaxalone (1 µM) and chlormethiazole (100 µM), and concentrations were previously determined as no effect levels. Data are reported as mean ± SD for normalized activity relative to the control (1% DMSO) within each time group. Significance determined using two-way repeated measures ANOVA with Tukey’s post-hoc, p ≤ 0.05, N = 32 animals per treatment group. Significance is indicated using compact letter designations, and bars not labelled with the same letter within each time-bin were significantly different. The first four time-bins are shown (2-hours post-exposure), though each study was conducted for 5 hours and are included in Supplementary Materials with summary statistics for all intervention studies.

References

    1. Adlercreutz H, Yamada T, Wahala K, Watanabe S. Maternal and neonatal phytoestrogens in Japanese women during birth. Am. J. Obstet. Gynecol. 1999;180:737–743. doi: 10.1016/s0002-9378(99)70281-4. - DOI - PubMed
    1. Afrikanova T, Serruys AS, Buenafe OE, Clinckers R, Smolders I, de Witte PA, Crawford AD, Esguerra CV. Validation of the zebrafish pentylenetetrazol seizure model: locomotor versus electrographic responses to antiepileptic drugs. PloS one. 2013;8:e54166. doi: 10.1371/journal.pone.0054166. - DOI - PMC - PubMed
    1. Avallone R, Zanoli P, Puia G, Kleinschnitz M, Schreier P, Baraldi M. Pharmacological profile of apigenin, a flavonoid isolated from Matricaria chamomilla. Biochem. Pharmacol. 2000;59:1387–1394. doi: 10.1016/s0006-2952(00)00264-1. - DOI - PubMed
    1. Balik-Meisner M, Truong L, Scholl EH, Tanguay RL, Reif DM. Population genetic diversity in zebrafish lines. Mamm. Genome. 2018 doi: 10.1007/s00335-018-9735-x. - DOI - PMC - PubMed
    1. Ball ER, Caniglia MK, Wilcox JL, Overton KA, Burr MJ, Wolfe BD, Sanders BJ, Wisniewski AB, Wrenn CC. Effects of genistein in the maternal diet on reproductive development and spatial learning in male rats. Horm. Behav. 2010;57:313–322. doi: 10.1016/j.yhbeh.2009.12.013. - DOI - PMC - PubMed

Publication types

MeSH terms