. 2018 Apr;28(4):547-560.
doi: 10.1101/gr.218123.116. Epub 2018 Mar 2.

Complete avian malaria parasite genomes reveal features associated with lineage-specific evolution in birds and mammals

Affiliations

Complete avian malaria parasite genomes reveal features associated with lineage-specific evolution in birds and mammals

Ulrike Böhme et al. Genome Res. 2018 Apr.

Abstract

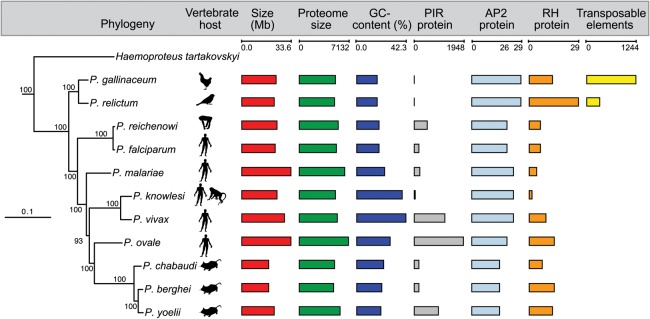
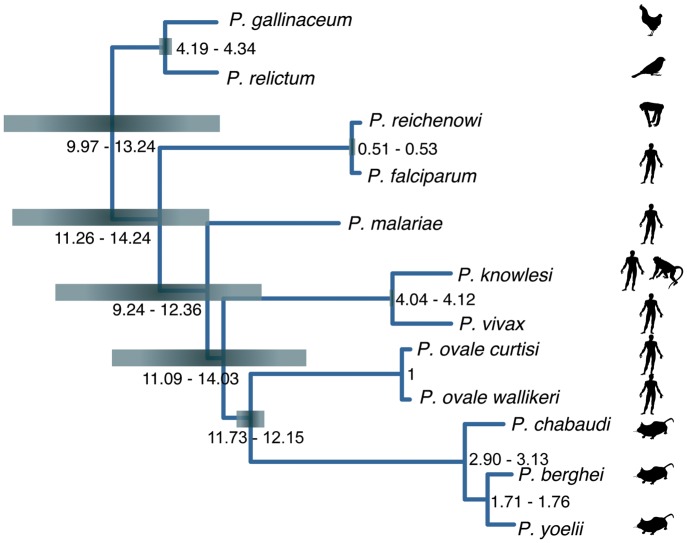
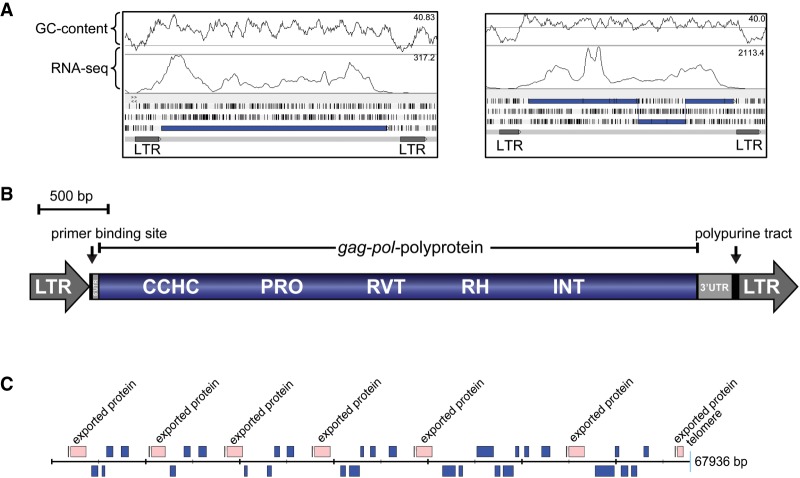
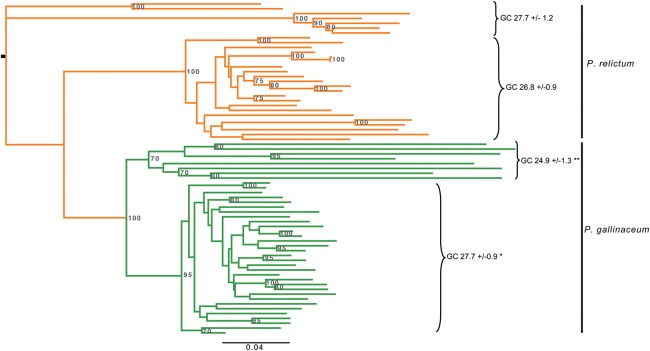
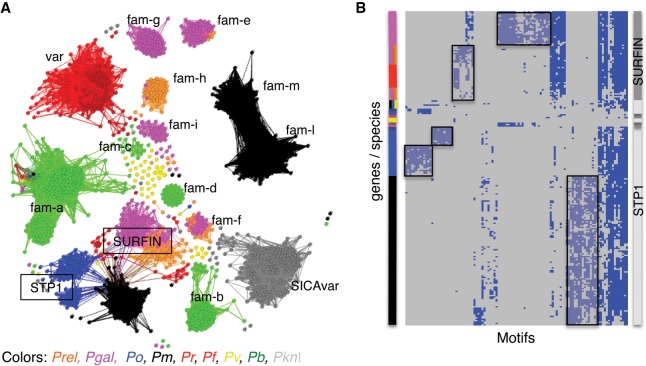
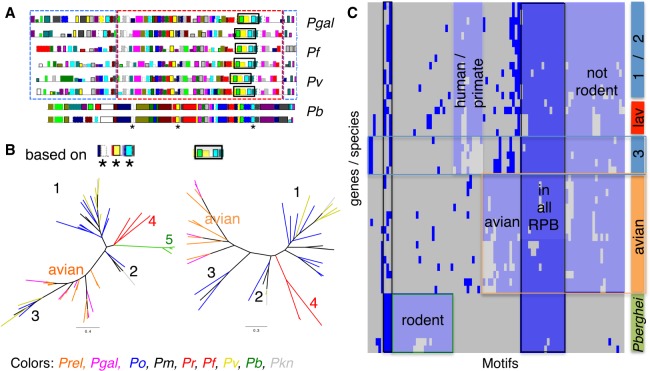
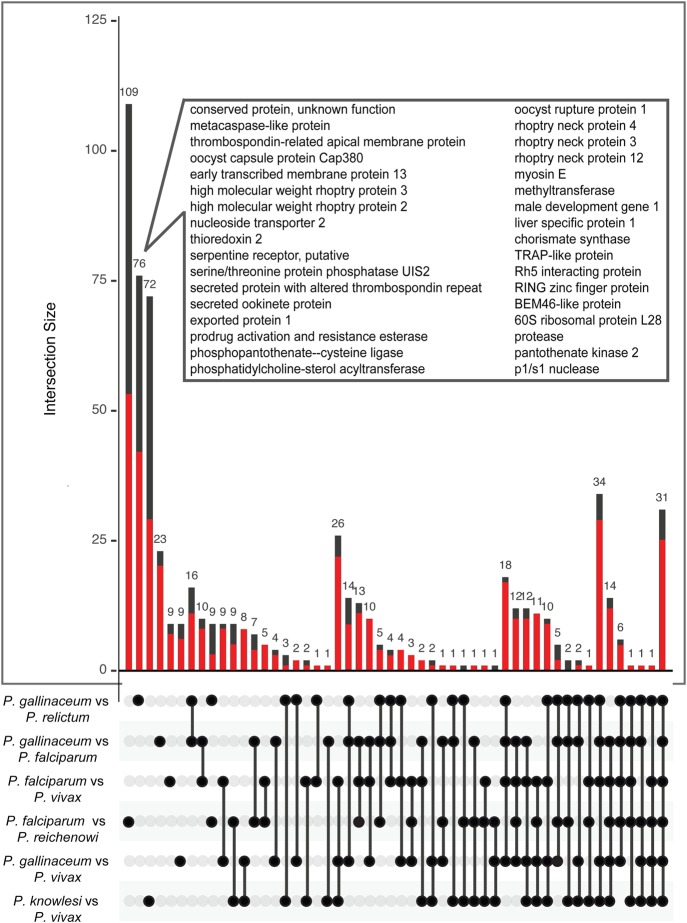
Avian malaria parasites are prevalent around the world and infect a wide diversity of bird species. Here, we report the sequencing and analysis of high-quality draft genome sequences for two avian malaria species, Plasmodium relictum and Plasmodium gallinaceum We identify 50 genes that are specific to avian malaria, located in an otherwise conserved core of the genome that shares gene synteny with all other sequenced malaria genomes. Phylogenetic analysis suggests that the avian malaria species form an outgroup to the mammalian Plasmodium species, and using amino acid divergence between species, we estimate the avian- and mammalian-infective lineages diverged in the order of 10 million years ago. Consistent with their phylogenetic position, we identify orthologs of genes that had previously appeared to be restricted to the clades of parasites containing Plasmodium falciparum and Plasmodium vivax, the species with the greatest impact on human health. From these orthologs, we explore differential diversifying selection across the genus and show that the avian lineage is remarkable in the extent to which invasion-related genes are evolving. The subtelomeres of the P. relictum and P. gallinaceum genomes contain several novel gene families, including an expanded surf multigene family. We also identify an expansion of reticulocyte binding protein homologs in P. relictum, and within these proteins, we detect distinct regions that are specific to nonhuman primate, humans, rodent, and avian hosts. For the first time in the Plasmodium lineage, we find evidence of transposable elements, including several hundred fragments of LTR-retrotransposons in both species and an apparently complete LTR-retrotransposon in the genome of P. gallinaceum.


Figures

Figure 1.
Figure 1.
Phylogeny and key features of Plasmodium species. Maximum-likelihood phylogeny of Plasmodium species based on a concatenated alignment of 289,315 amino acid residues from 879 single-copy orthologs. Branch lengths are expected substitutions per amino acid site, and values on nodes are number of bootstrap replicates (out of 100) displaying the partition induced by the node. The tree was rooted with sequences from Toxoplasma and four Piroplasma species (now called Babesia), with the full tree shown as Supplemental Figure S2. The phylogenetic tree is combined with a graphical overview of key features of all reference genomes (genome versions from May 1, 2016). Due to the fragmented nature of the Haemoproteus tartakovskyi (Bensch et al. 2016) genome, counts for its key features have not been included.
Figure 2.
Figure 2.
Schematic of the phylogenetic tree showing approximate speciation times across the Plasmodium genus. Species dates were estimated using a total least squares regression on the dAA values (Silva et al. 2015) and calibrated on the split of two P. ovale species, which is assumed to have occurred 1 million years ago (Rutledge et al. 2017). Ninety-five percent confidence intervals for each node are represented by heat maps.
Figure 3.
Figure 3.
Transposable elements in P. gallinaceum. (A) Artemis screenshot showing a complete retrotransposon of P. gallinaceum (PGAL8A_00410600) and a copy where the open reading frame encoding gag-pol-polyprotein is frame-shifted (Rutherford et al. 2000). (B) Diagram of the P. gallinaceum retrotransposon (PGAL8A_00410600). The Ty3/Gypsy transposable element contains a continuous open reading frame including a CCHC-type zinc finger domain (CCHC), aspartic protease domain (PRO), reverse transcriptase domain (RVT), RNase H domain (RH), and an integrase domain (INT). The element is bounded by long terminal repeats (LTR). (C) A single subtelomeric region (contig 70) from P. gallinaceum. Transposable elements are shown in blue.
Figure 4.
Figure 4.
Phylogenetic analysis of 69 transposable elements from P. gallinaceum and P. relictum. For each element, GC-content is shown and clearly distinguishes two clades in P. gallinaceum. Unrooted maximum-likelihood tree based on nucleotides using the GTR+G evolutionary model. Bootstrap values < 70 are not shown. Percentage GC values indicate mean ± variance. P-values were determined based on a simple randomization approach; see Supplemental Methods. (*) P = <0.01, (**) P = <0.0001.
Figure 5.
Figure 5.
Similarity of gene families within Plasmodium. (A) A network of BLASTP similarity between genes (nodes) sharing at least 31% global identity. Genes are colored by species. The pir genes were excluded due to their large numbers across the Plasmodium genus. Fam-m and Fam-l are P. malariae-specific gene families (Rutledge et al. 2017). (B) Clustering of STP1 and SURFIN genes based on the occurrence motifs identified using MEME. Where a gene (row) has a specific motif (column), the value is set to 1. The matrix is clustered through a hierarchical clustering algorithm (Ward 1963) to visualize similar patterns of motif-sharing. The x-axis represents motifs that occur in at least 10 genes, and individual genes are displayed on the y-axis (rows). Colored bars on the left identify species; the bar on the right, the gene annotation. Boxed areas indicate possible gene family subtypes.
Figure 6.
Figure 6.
RBP MEME motifs comparison. Analysis of 96 MEME motifs obtained from reticulocyte binding proteins (RBPs) of nine species. (A) Example of motifs predicted on two RBPs from each of four species. Each colored rectangle (along the protein) represents a different one of the 96 motifs, with their heights corresponding to their respective E-values. The red dashed box around the sequences of P. gallinaceum, P. falciparum, and P. vivax highlights a similar order of motifs. The blue dashed boxes on either side highlight differences in motif content. The black box and the three stars are motifs used to build the tree in B. (B) Two maximum-likelihood phylogenetic trees based on two motif sets. The left tree was generated using the three motifs (indicated with an asterisk * in panel A, in total 72 aa long), and the second tree was generated using the motifs from the black box in panel A, 169 aa long (all bootstrap values are 100). Labels 1, 2, and 3 identify the distinct clusters of the P. malariae, P. ovale, and P. vivax RBPs, as previously reported (Rutledge et al. 2017), four P. falciparum and P. reichenowi and five P. berghei. (C) Clustering of the binary occurrence of MEME motifs for each RBP, similar to Figure 5B. The bar on the right represents either species (lav [Laverania], avian, P.berghei) or the groups 1,2, and 3 from B. This analysis does not split group 1 and 2 of P. malariae, P. ovale, and P. vivax RBPs. The x-axis represents the 96 motifs. Blue represents at least one occurrence of that motif for that gene. Shared patterns are highlighted with colored boxes.
Figure 7.
Figure 7.
Analysis of genes with high rates of nonsynonymous substitutions (dN) between six species. From pairwise comparisons within- and between-clades, the 250 highest scoring genes were selected. The matrix shows the intersections between the six gene lists, and the bar plot above shows the number of genes that are unique to each intersection. The fraction of genes with unknown function in each category is shown with a red bar. The gene products are shown for the avian species comparison, which had the most significant Gene Ontology (GO) term enrichment.

References

    1. Asghar M, Hasselquist D, Hansson B, Zehtindjiev P, Westerdahl H, Bensch S. 2015. Chronic infection. Hidden costs of infection: Chronic malaria accelerates telomere degradation and senescence in wild birds. Science 347: 436–438. - PubMed
    1. Atkinson CT, Dusek RJ, Woods KL, Iko WM. 2000. Pathogenicity of avian malaria in experimentally-infected Hawaii Amakihi. J Wildl Dis 36: 197–204. - PubMed
    1. Bailey TL, Boden M, Buske FA, Frith M, Grant CE, Clementi L, Ren J, Li WW, Noble WS. 2009. MEME SUITE: tools for motif discovery and searching. Nucleic Acids Res 37: W202–W208. - PMC - PubMed
    1. Balu B, Chauhan C, Maher SP, Shoue DA, Kissinger JC, Fraser MJ, Adams JH. 2009. piggyBac is an effective tool for functional analysis of the Plasmodium falciparum genome. BMC Microbiol 9: 83. - PMC - PubMed
    1. Bensch S, Hellgren O, Pérez-Tris J. 2009. MalAvi: a public database of malaria parasites and related haemosporidians in avian hosts based on mitochondrial cytochrome b lineages. Mol Ecol Resour 9: 1353–1358. - PubMed

Publication types