. 2018 Apr 1;200(7):2464-2478.
doi: 10.4049/jimmunol.1701695. Epub 2018 Mar 2.

Statistical Validation of Rare Complement Variants Provides Insights into the Molecular Basis of Atypical Hemolytic Uremic Syndrome and C3 Glomerulopathy

Affiliations

Statistical Validation of Rare Complement Variants Provides Insights into the Molecular Basis of Atypical Hemolytic Uremic Syndrome and C3 Glomerulopathy

Amy J Osborne et al. J Immunol. .

Abstract

Atypical hemolytic uremic syndrome (aHUS) and C3 glomerulopathy (C3G) are associated with dysregulation and overactivation of the complement alternative pathway. Typically, gene analysis for aHUS and C3G is undertaken in small patient numbers, yet it is unclear which genes most frequently predispose to aHUS or C3G. Accordingly, we performed a six-center analysis of 610 rare genetic variants in 13 mostly complement genes (CFH, CFI, CD46, C3, CFB, CFHR1, CFHR3, CFHR4, CFHR5, CFP, PLG, DGKE, and THBD) from >3500 patients with aHUS and C3G. We report 371 novel rare variants (RVs) for aHUS and 82 for C3G. Our new interactive Database of Complement Gene Variants was used to extract allele frequency data for these 13 genes using the Exome Aggregation Consortium server as the reference genome. For aHUS, significantly more protein-altering rare variation was found in five genes CFH, CFI, CD46, C3, and DGKE than in the Exome Aggregation Consortium (allele frequency < 0.01%), thus correlating these with aHUS. For C3G, an association was only found for RVs in C3 and the N-terminal C3b-binding or C-terminal nonsurface-associated regions of CFH In conclusion, the RV analyses showed nonrandom distributions over the affected proteins, and different distributions were observed between aHUS and C3G that clarify their phenotypes.


Figures

Figure 1.
Figure 1.
Stacked bar analyses showing the reference AF of the variants identified in the (A) aHUS and (B) C3G datasets. The total numbers of unique variants (nvar) are shown within the bars. A unique variant is defined as, when a variant is seen in more than one patient, the variant is only counted once. Unique variants (excluding the 13 aHUS and 3 C3G CNVs) are categorised by their AF in each of the three reference datasets: the 1000 Genomes Project (1000GP) with an allele number (AN; total number of alleles screened for each gene) of 3775–5008, the Exome Variant Server (EVS) with an AN of 8202–13005 and the Exome Aggregation Consortium (ExAC) with an AN of 14708–121412. The aHUS and C3G datasets each had ANs of 634–6256 and 208–886, respectively. The pink bars indicate a reference AF of 0%, dark blue bars indicate a reference AF of between 0% and 0.01% (non-inclusive), green bars indicate a reference AF of between 0.01% (inclusive) and 0.1%, light blue bars indicate a reference AF of between 0.1% (inclusive) and 1%, and red bars indicate a reference AF ≥ 1%.
Figure 2.
Figure 2.
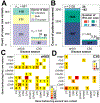
Summary of cases and variants in aHUS and C3G. (A) The source of the RV data in the database for aHUS and C3G. “Both” (yellow) indicates RVs that were identified both in the laboratory-sourced datasets (purple) and published in the literature (green). (B) The number of unique RVs (0 to 3) per patient case in the aHUS and C3G datasets, totalling 3127 patients. For aHUS, there is a further case with four RVs that is too small to be seen. (C) A matrix showing the genetic profiles of the 182 aHUS cases with compound heterozygous (in single or in two different genes) or homozygous RVs from panel (B). Their frequencies n are graded in colour (inset). (D) A matrix showing the genetic profiles of the 31 C3G cases with compound heterozygous (in single or in two different genes) or homozygous RVs from panel (B), graded in colour (inset).
Figure 3.
Figure 3.
RV effects and classifications in aHUS and C3G. The colour coding of each RV effect and its classification is shown in the insets. (A) In terms of pathogenicity, the total number of unique RVs for each gene and their classification, based on the pathology guidelines (Methods), are shown for the aHUS and C3G datasets, and for both datasets, in three panels. (B) In terms of functional annotation (such as that used in ExAC), the total number of unique RVs for each gene and their effect on each protein are shown for the aHUS and C3G datasets, and for both datasets in three panels.
Figure 4.
Figure 4.
The RV burden (%) per gene for the nine relevant genes in the four aHUS (Allele number (AN): 634–6256), ExAC (AN: 74194–121246), EVS (AN: 8202–13005) and C3G (AN: 208–886) datasets. These were based on an ExAC MAF cut-off of 0.01%. *** denotes p < 0.0001. * denotes p = 0.0052.
Figure 5.
Figure 5.
The distribution and disease allele frequencies (AFs) of non-benign missense RVs in the domains of FH, C3, FI, MCP, and FB in the aHUS and C3G datasets. The largest bars correspond to missense RV hotspots (e.g. FH SCR-20 for aHUS; SCR-18 for C3G). Each domain missense RV AF is normalised for its size by dividing it by the proportion of residues in the protein domain. In each of (A-E), red represents the total AF missense RVs identified in the aHUS dataset, and likewise dark blue for C3G. For those missense RVs identified in both the aHUS and C3G datasets, pink represents the AF for aHUS and light blue for C3G. On the x-axes, the domain names are shown. (A) The total AF of missense RVs in each of the 20 SCR domains in FH. Beneath the x-axis, the functional binding sites associated with each SCR domain are shown by coloured arrows (identified in the inset). (B) The total AF of missense RVs in each C3 domain. Beneath the x-axis, the functional binding sites associated with each C3 domain are shown by arrows to correspond to the SCR domains in FH (pink) or other sites in FI or on the cell surface. The C3d binding site on SCR-19/20 corresponds to the TED domain, however this is not shown. (C) The total AF of missense RVs in each FI domain. (D) The total AF of missense RVs in each MCP domain. (E) The total AF of missense RVs in each FB domain.
Figure 6.
Figure 6.
Missense RVs mapped onto protein structural models. Only the aHUS and C3G RVs that were not classified as ‘benign’ or ‘likely benign’ are shown. For (A) FH, (B) C3, (C) FI, (D) MCP, and (E) FB, the red spheres represent missense RVs identified in the aHUS dataset, the yellow spheres represent missense RVs in C3G and the black spheres represent missense RVs in both aHUS and C3G. Note that some of the spheres overlap, especially if different RVs affect the same amino acid. The protein domains are shown in alternating colours (A) or in unique colours (B-E) and labelled in that colour for clarity.

References

    1. Goodship TH, Cook HT, Fakhouri F, Fervenza FC, Frémeaux-Bacchi V, Kavanagh D, Nester CM, Noris M, Pickering MC, Rodríguez de Cordoba S, Roumenina LT, Sethi S, and Smith RJ. 2017. Atypical hemolytic uremic syndrome and C3 glomerulopathy: conclusions from a “Kidney Disease: Improving Global Outcomes” (KDIGO) Controversies Conference. Kidney Int 91: 539–551. - PubMed
    1. Bu F, Borsa N, Gianluigi A, and Smith RJ. 2012. Familial atypical hemolytic uremic syndrome: a review of its genetic and clinical aspects. Clin Dev Immunol 2012: 370426. - PMC - PubMed
    1. Warwicker P, Goodship TH, Donne RL, Pirson Y, Nicholls A, Ward RM, Turnpenny P, and Goodship JA. 1998. Genetic studies into inherited and sporadic hemolytic uremic syndrome. Kidney Int 53: 836–844. - PubMed
    1. Fakhouri F, Zuber J, Frémeaux-Bacchi V, and Loirat C. 2017. Haemolytic uraemic syndrome. Lancet 390: 681–696. - PubMed
    1. Sansbury FH, Cordell HJ, Bingham C, Bromilow G, Nicholls A, Powell R, Shields B, Smyth L, Warwicker P, Strain L, Wilson V, Goodship JA, Goodship TH, and Turnpenny PD. 2014. Factors determining penetrance in familial atypical haemolytic uraemic syndrome. J Med Genet 51: 756–764. - PubMed

Publication types

MeSH terms