. 2018 Mar 2;9(1):910.
doi: 10.1038/s41467-018-03351-4.

MT4-MMP deficiency increases patrolling monocyte recruitment to early lesions and accelerates atherosclerosis

Affiliations

MT4-MMP deficiency increases patrolling monocyte recruitment to early lesions and accelerates atherosclerosis

Cristina Clemente et al. Nat Commun. .

Abstract

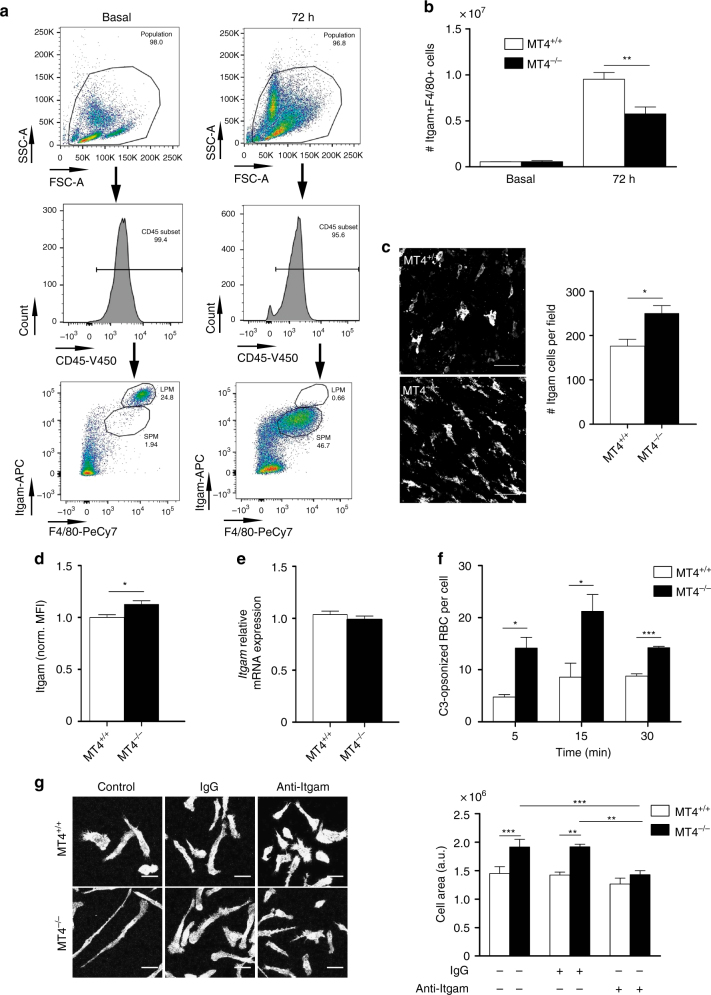
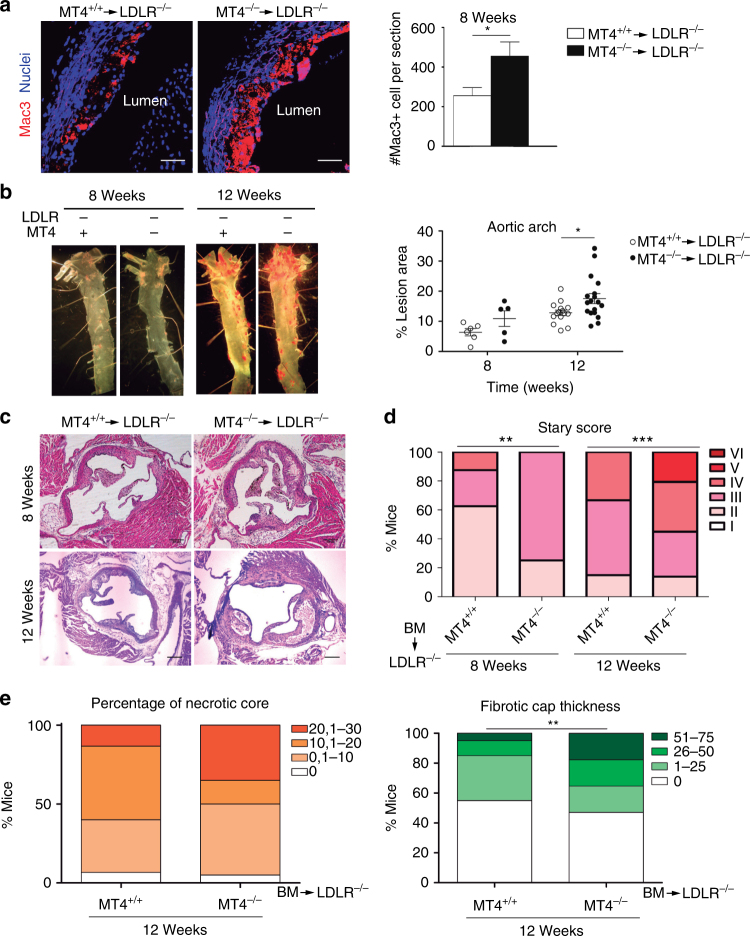
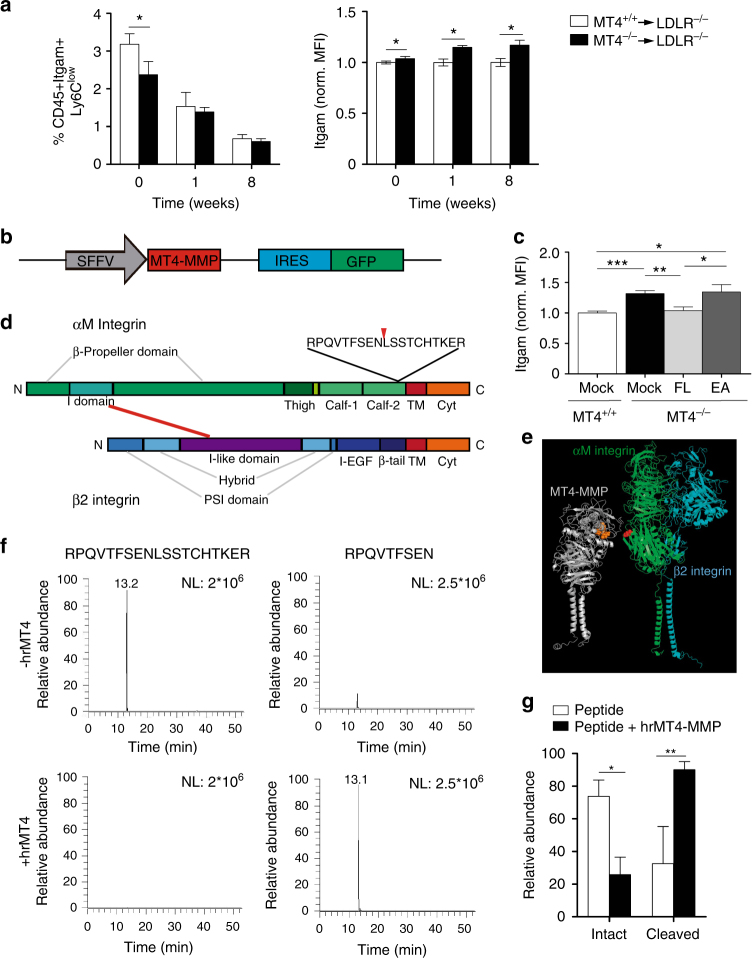
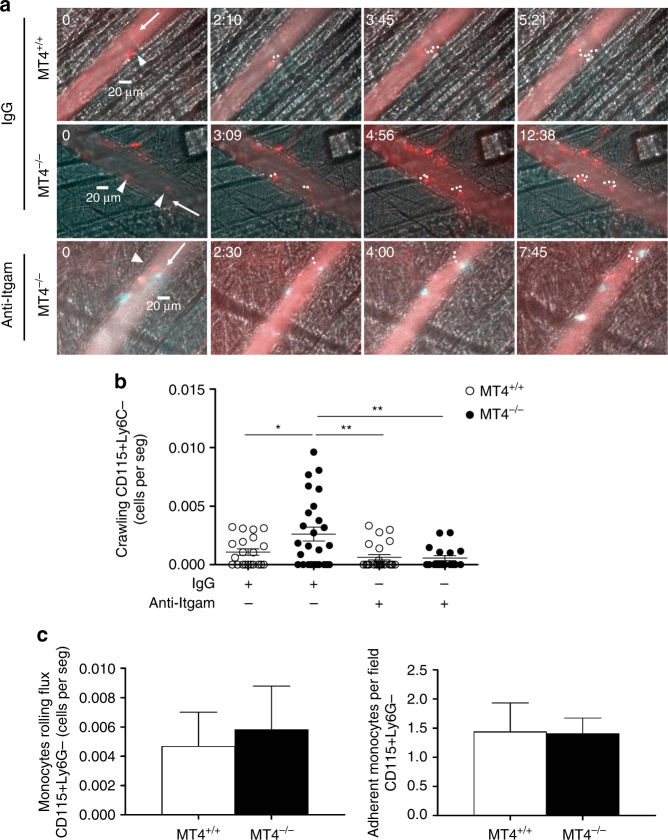
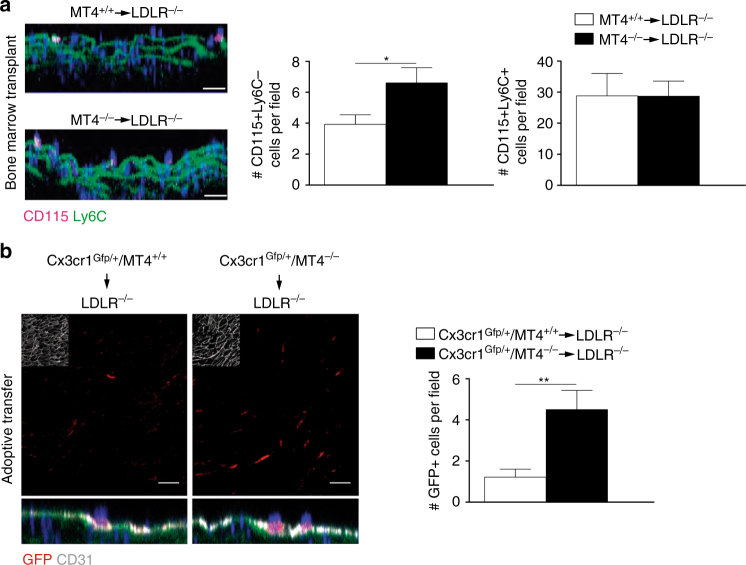
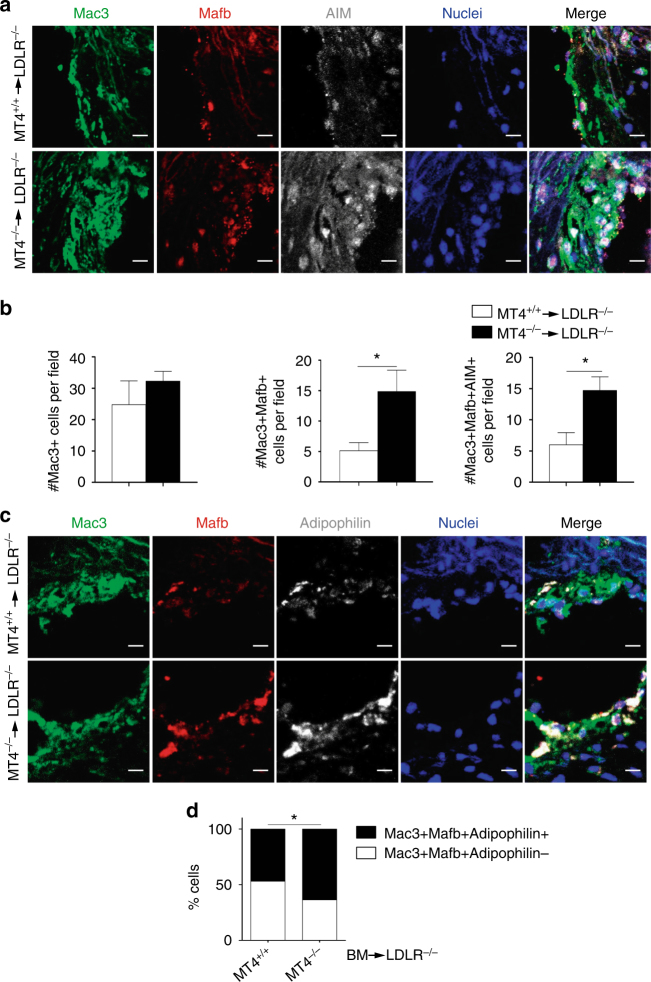
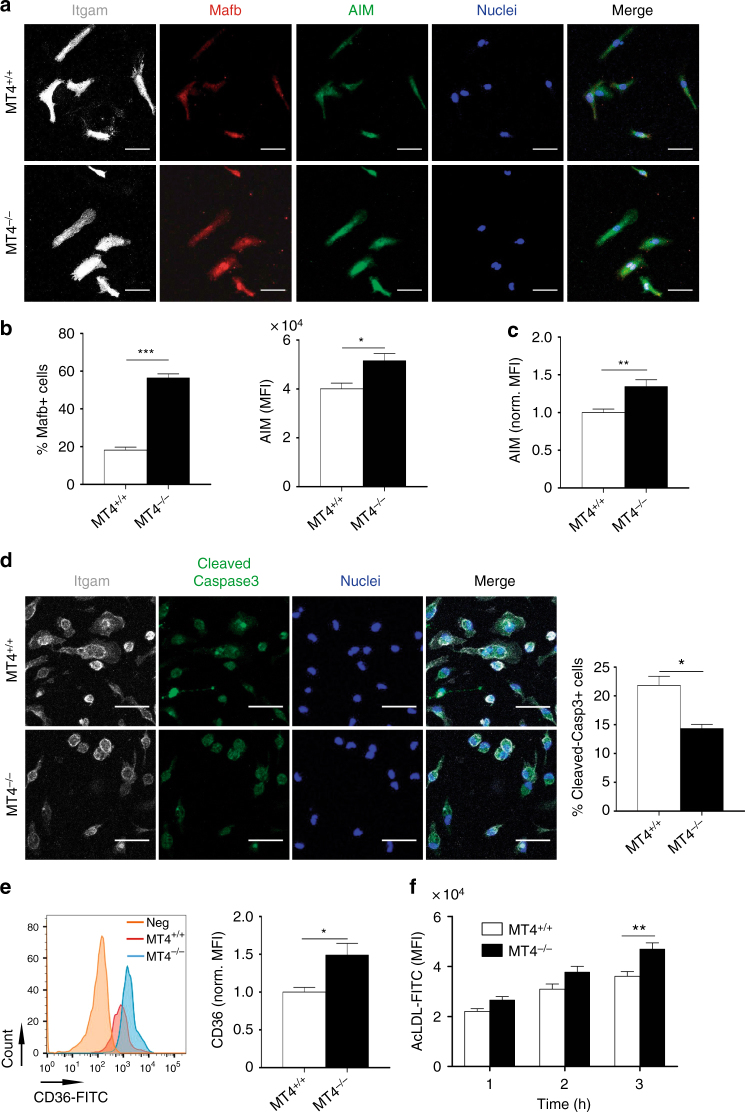
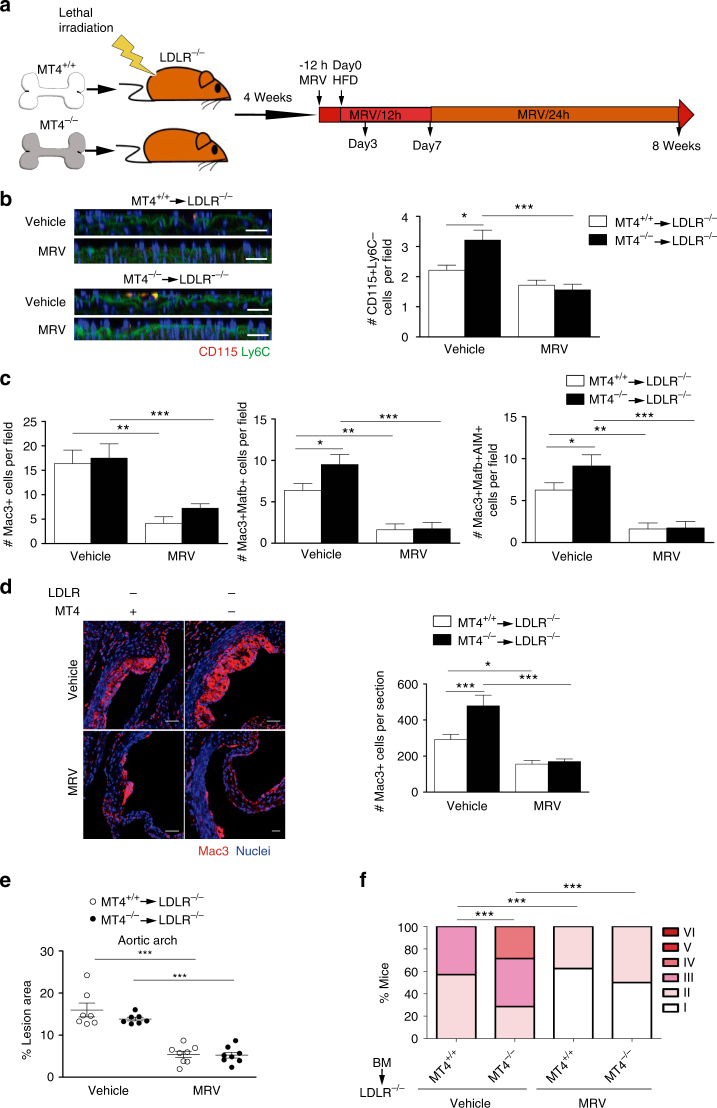
Matrix metalloproteinases are involved in vascular remodeling. Little is known about their immune regulatory role in atherosclerosis. Here we show that mice deficient for MT4-MMP have increased adherence of macrophages to inflamed peritonea, and larger lipid deposits and macrophage burden in atherosclerotic plaques. We also demonstrate that MT4-MMP deficiency results in higher numbers of patrolling monocytes crawling and adhered to inflamed endothelia, and the accumulation of Mafb+ apoptosis inhibitor of macrophage (AIM)+ macrophages at incipient atherosclerotic lesions in mice. Functionally, MT4-MMP-null Mafb+AIM+ peritoneal macrophages express higher AIM and scavenger receptor CD36, are more resistant to apoptosis, and bind acLDL avidly, all of which contribute to atherosclerosis. CCR5 inhibition alleviates these effects by hindering the enhanced recruitment of MT4-MMP-null patrolling monocytes to early atherosclerotic lesions, thus blocking Mafb+AIM+ macrophage accumulation and atherosclerosis acceleration. Our results suggest that MT4-MMP targeting may constitute a novel strategy to boost patrolling monocyte activity in early inflammation.


Conflict of interest statement

The authors declare no competing interests.

Figures

Fig. 1
Fig. 1
Enhanced trapping of MT4-MMP-null peritoneal macrophages due to increased αM integrin (Itgam) levels and activity. a Representative flow cytometry dot plots and histograms of mouse peritoneal macrophages stained for CD45, Itgam, and F4/80 in basal conditions (left) and 72 h after thioglycollate (TG) injection (right). b Number of macrophages (Itgam+F4/80+) collected in the peritoneal eluate of wild-type and MT4-MMP-null mice at the indicated times after TG injection; n = 3 mice in basal and n = 12 mice at 72 h per genotype in one in basal and four in 72 h independent experiments, respectively. c Representative confocal microscopy images (left) and quantification (right) of monocytes/macrophages (Itgam+) in the peritoneal membrane 72 h after TG injection; n = 6 mice per genotype in two independent experiments; scale bar, 50 µm. d Flow cytometry analysis of Itgam cell-surface levels in TG-elicited macrophages (Itgam+F4/80+) obtained 72 h after TG injection; n = 20 mice per genotype in four independent experiments. e qPCR analysis of Itgam mRNA in TG-elicited macrophages adhered to plastic overnight; n = 6 samples per genotype in two independent experiments. f Itgam integrin affinity assessed as the number of C3-opsonized red blood cells (RBCs) bound to TG-elicited peritoneal macrophages adhered to glass; n = 6 samples per genotype from two independent experiments. g Representative fluorescence images of TG-elicited macrophages adhered to fibrinogen for 24 h and labeled for F-actin in the presence or absence of Itgam blocking antibody M1/70 or IgG isotype control (left). The histogram shows quantification of the cell area (right). Scale bar, 30 µm. n = 6 samples per genotype in two independent experiments. Data were tested by two-way ANOVA followed by Bonferroni’s post test in f, by two-tailed Student’s t-test in b, c, d, and e, and by one-way ANOVA followed by Bonferroni’s post test in g. Results are expressed as mean ± SEM. *p < 0.05, **p < 0.01, and ***p < 0.001
Fig. 2
Fig. 2
Lack of MT4-MMP in BM-derived cells results in increased macrophage burden in atherosclerotic plaques and accelerated AT. a Representative images of Mac3 immunostaining (red; nuclei in blue) in transverse sections of aortas from Ldlr–/– mice transplanted with MT4-MMP+/+ (MT4+/+) or MT4-MMP–/– (MT4–/–) BM cells and fed a HFD for 8 weeks; scale bar, 20 µm. The right panel shows Mac3-positive cells quantified by Image J. n = 6 mice per genotype in two independent experiments. b Representative images of en face Oil Red-stained aortas from BM-transplanted Ldlr–/– and fed a HFD for 8 or 12 weeks (left) and graph shows the area (%) of Oil Red-positive lesions in the aortic arch (right); n = 6 and n = 16 mice per genotype for 8 and 12 weeks in two and three independent experiments, respectively. c Representative images of transverse sections of aortic sinus stained with H&E of BM-transplanted Ldlr–/– mice; scale bar, 200 µm. d Stary scoring (I–VI) of aortic lesions of BM-transplanted Ldlr–/– mice, shown as a percentage of all mice for each condition after feeding a HFD for 8 or 12 weeks; n = 6 and n = 16 mice per genotype and time point in two and three independent experiments. e Bar graphs show the percentage of BM-transplanted Ldlr–/– mice for each range of % of necrotic area (left) and fibrotic cap thickness (right) after 12 weeks of HFD; n = 16 mice per genotype in three independent experiments. Data were tested by two-tailed Student’s t-test in a, by two-way ANOVA followed by Bonferroni’s post test in b, and by χ2-test for a trend in d, e. Results are expressed as mean ± SEM. *p < 0.05, **p < 0.01, and ***p < 0.001
Fig. 3
Fig. 3
The protease MT4-MMP can cleave the αM integrin chain (Itgam). a Percentage of circulating patrolling monocytes (CD45+Itgam+Ly6Clow, excluding granulocytes) and the normalized mean fluorescence intensity (MFI) of Itgam cell-surface levels in patrolling monocytes from Ldlr–/– mice transplanted with MT4-MMP+/+ or MT4-MMP–/– BM cells and fed a HFD for 0, 1, or 8 weeks; n = 12, n = 6, and n = 6 mice in basal, 1 week and 8 weeks per genotype; four independent experiments in basal and two independent experiments at 1 and 8 weeks. b Design of lentiviral (LV) vector with SFFV-driven Mmp17 (MT4-MMP) expression and IRES-driven expression of green fluorescent protein (GFP). c LV encoding full-length mouse MT4-MMP (FL), the catalytic inactive mutant (E248A, EA), or GFP only (mock) were i.p. injected into MT4-MMP-null mice. Itgam cell surface levels were assessed by flow cytometry in the infected peritoneal macrophages (GFP+Itgam+F4/80+) 5 days after infection; n = 6 mice per condition in two independent experiments. d Depiction of human αMβ2 integrin domains, indicating the predicted cleavage site at position 977 in the Calf-2 domain of human αM integrin. e In silico model of human MT4-MMP dimer (gray) and αMβ2 integrin (αM chain, green; β2 chain, blue) showing the putative cleavage site between N977 and L978 (red) in the αM chain, and the catalytic active center in the MT4-MMP dimer (orange). f Representative extracted ion chromatogram of peptides obtained after incubation of the synthetic human αM integrin peptide RPQVTFSENLSSTCHTKER in the presence or absence of human recombinant MT4-MMP catalytic domain (hrMT4). g Quantification of the relative abundance of the intact RPQVTFSENLSSTCHTKER and N-terminal peptide fragments in each condition; n = 4 independent experiments. Data were tested by two-way ANOVA followed by Bonferroni’s post test in a, by one-way ANOVA followed by Bonferroni’s post test in c, and by two-tailed Student’s t-test in g. IRES, internal ribosome entry site; SFFV, spleen focus-forming virus. Results are expressed as mean ± SEM. *p < 0.05, **p < 0.01, and ***p < 0.001
Fig. 4
Fig. 4
Enhanced αM integrin-dependent crawling of MT4-MMP-null patrolling monocytes on CCL2-inflamed endothelium. a Representative intravital microscopy images of CD115+/Ly6C– patrolling monocytes (CD115 in red and Ly6C in green) crawling on the CCL2-inflamed endothelium in the cremaster muscle of wild-type (MT4+/+) and MT4-MMP-null (MT4–/–) mice; the recording was performed in the presence of anti-Itgam blocking antibody (M1/70) or IgG isotype control. Arrowheads, arrows, and dots respectively indicate individual patrolling monocytes, blood flow, and monocyte trajectory. Time of recording is indicated. b The graph shows the numbers of crawling patrolling monocytes recorded in a in every venule from five independent mice per genotype and condition in two independent experiments. c Quantification of CD115+Ly6G- rolling (left) and adherent (right) monocytes in the CCL2-inflamed endothelium in the cremaster muscle of wild-type (MT4+/+) and MT4-MMP-null (MT4–/–) mice. n = 8 mice per genotype in two independent experiments. Data were tested by one-way ANOVA followed by Bonferroni’s post test in b and by two-tailed Student’s t-test in c. Results are expressed as mean ± SEM.*p < 0.05, **p < 0.01, and ***p < 0.001
Fig. 5
Fig. 5
Increased recruitment of MT4-MMP-null patrolling monocytes in incipient atherosclerotic lesions. a Representative orthogonal XZ view images of whole-mount-stained lesser curvature of the aortic arch from Ldlr–/– mice transplanted with MT4-MMP+/+ or MT4-MMP–/– BM cells and fed a HFD for 3 days. Samples were stained for CD115 (magenta) and Ly6C (green); elastin autofluorescence (green) and nuclei (Hoechst, blue). The bar graph (right) shows the quantification of the number of patrolling (CD115+Ly6C–) and classical monocytes (CD115+Ly6C+) in the aorta lumen; n = 6 mice per genotype in two independent experiments. b Representative confocal microscopy images of whole-mount-stained lesser curvature of the aortic arch from Ldlr–/– mice adoptively transfer with Cx3cr1Gfp/+ MT4-MMP+/+ or Cx3cr1Gfp/+ MT4-MMP–/– patrolling monocytes and fed a HFD for 3 days. Samples were stained for GFP (red) and CD31 (gray); elastin autofluorescence (green) and nuclei (Hoechst, blue). A z-stack of the confocal microscopy sections close to the lumen (with an inset of CD31 staining) is shown to the top and the orthogonal XZ view of the merged images to the bottom. Scale bar, 20 µm. The bar graph (right) shows the quantification of the number of transferred monocytes (GFP+) in the aorta lumen; n = 9 mice per genotype in two independent experiments. Data were tested by Student’s t-test. Results are expressed as mean ± SEM.*p < 0.05, **p < 0.01
Fig. 6
Fig. 6
Lack of MT4-MMP in patrolling monocytes leads to the accumulation of Mafb+AIM+ macrophages in incipient atherosclerotic plaques. a Representative images of transverse sections of aortic sinus from Ldlr–/– mice transplanted with MT4-MMP+/+ (MT4+/+) or MT4-MMP–/– (MT4–/–) BM cells and fed a HFD for 1 week; sections were labeled for Mac3 (green), Mafb (red), and AIM (white), and with Hoechst (blue; nuclei); scale bar, 10 µm. b Number of Mac3+ cells (left), Mac3+Mafb+ cells (middle), and Mac3+Mafb+AIM+ cells (right) in the plaques of BM-transplanted Ldlr–/– mice fed a HFD for 1 week. c Representative images of transverse sections of aortic sinus from BM-transplanted Ldlr–/– mice fed a HFD for 1 week; sections were labeled for Mac3 (green), Mafb (red), and adipophilin (white), and with Hoechst (blue; nuclei); scale bar, 10 µm. d Relative % of adipophilin-positive and adipophilin-negative cells within the Mac3+Mafb+ population of BM-transplanted Ldlr–/– mice (1 week on HFD); n = 7 mice per genotype in two independent experiments. Data were tested by two-tailed Student’s t-test in b and by Fisher’s exact test in d. Results are expressed as mean ± SEM. *p < 0.05
Fig. 7
Fig. 7
MT4-MMP-null Mafb+/AIM+ peritoneal macrophages exhibit above-normal CD36 at the cell surface and enhanced acLDL binding. a Representative images of MT4-MMP+/+ (MT4+/+) or MT4-MMP–/– (MT4−/−) mouse peritoneal macrophages elicited by 72 h TG stimulation and labeled for Itgam (white), Mafb (red), and AIM (green), and with Hoechst (blue, nuclei); scale bar, 20 µm. b Graphs show the percentage of cells Mafb+ in the nuclei (left) and the MFI of AIM within Mafb+ cells (right); n = 6 in two independent experiments. c Quantification of normalized MFI of AIM analyzed by flow cytometry in MT4+/+ or MT4−/− mouse peritoneal macrophages elicited by 72-hour TG stimulation; n = 6 in two independent experiments. d Representative images of TG-elicited MT4+/+ or MT4–/– mouse peritoneal macrophages treated with cycloheximide (100 μg ml−1) for 6 h and labeled for Itgam (white) and cleaved-caspase 3 (green) and Hoechst (blue, nuclei); scale bar, 20 µm. Quantification of the percentage of cleaved-caspase 3-positive cells is shown on the right; n = 3 in one experiment. e Representative flow cytometry histogram plot of CD36 staining in TG-elicited MT4+/+ or MT4–/– mouse peritoneal macrophages (left) and quantification of normalized MFI (right); n = 6 in two independent experiments. f MFI of AcLDL-FITC binding to TG-elicited MT4+/+ or MT4–/– mouse peritoneal macrophages for the indicated times; n = 6 in two independent experiment. Data were tested by Student’s t-test in b, c, d, and e, and by two-way ANOVA followed by Bonferroni’s post test in f. Results are expressed as mean ± SEM. *p < 0.05, **p < 0.01, and ***p < 0.001
Fig. 8
Fig. 8
CCR5 inhibition results in loss of enhanced recruitment of patrolling monocytes, Mafb+AIM+ macrophage accumulation and AT acceleration in MT4-MMP-null BMT Ldlr–/– mice. a Scheme depicts the experimental design of CCR5 blocking strategy by Maraviroc (MRV) administration as described in M&M. b Representative orthogonal XZ view of confocal microscopy images of whole mount-stained aortic arch from Ldlr–/– mice transplanted with MT4-MMP+/+ or MT4-MMP–/– BM cells, fed the HFD for 3 days and treated with MRV or vehicle. Samples were stained for CD115 (red) and Ly6C (green); elastin autofluorescence (green) and nuclei (Hoechst, blue) are also shown. Scale bar, 20 µm. The bar graph (right) shows the quantification of the number of patrolling monocytes (CD115+Ly6C–) in the aorta lumen; n = 7 vehicle and n = 8 MRV mice per genotype in two independent experiments. c Bar graphs show the quantification of the number of Mac3+ cells (left), Mac3+Mafb+ cells (middle), and Mac3+Mafb+AIM+ cells (right) in the plaques of BM-transplanted Ldlr–/– mice fed a HFD for 1 week and treated with Maraviroc or vehicle. n = 8 mice per genotype and condition in two independent experiments. d Representative microscopy images of transverse sections of aortic sinus from BM-transplanted Ldlr–/– mice fed a HFD for 8 weeks and treated with Maraviroc or vehicle; sections were labeled for Mac3 (red) and Hoechst (blue; nuclei) (upper, scale bar, 50 µm) and graph shows the quantification of the number of Mac3+ cells in the plaque (lower). n = 7 vehicle and n = 8 MRV BM-transplanted mice per genotype in two independent experiments. e Graph showing the lesion area of aortas stained with Oil Red from BM-transplanted Ldlr–/– mice fed a HFD for 8 week and treated with MRV or vehicle. n = 7 and n = 8 mice for Vehicle and MRV mice per genotype in two independent experiments. f Stary scoring (I-VI) of transverse aortic H&E-stained sections from BM-transplanted Ldlr–/– mice fed a HFD for 8 weeks and treated with Maraviroc or vehicle, shown as a percentage of all mice for each score. n = 7 vehicle and n = 8 MRV BM-transplanted mice per genotype in two independent experiments. Data were tested by one-way ANOVA followed by Bonferroni’s post test in be and by χ2-test for a trend in f. Results are expressed as mean ± SEM. *p < 0.05, **p < 0.01, ***p < 0.005

References

    1. Hansson G. K. Regulation of immune mechanisms in atherosclerosis. Ann. N. Y. Acad. Sci.947, 157–165 (2001). - PubMed
    1. Hamers AA, et al. Bone marrow-specific deficiency of nuclear receptor Nur77 enhances atherosclerosis. Circ. Res. 2012;110:428–438. doi: 10.1161/CIRCRESAHA.111.260760. - DOI - PubMed
    1. Hansson GK, Hermansson A. The immune system in atherosclerosis. Nat. Immunol. 2011;12:204–212. doi: 10.1038/ni.2001. - DOI - PubMed
    1. Randolph GJ. The fate of monocytes in atherosclerosis. J. Thromb. Haemost. 2009;7:28–30. doi: 10.1111/j.1538-7836.2009.03423.x. - DOI - PMC - PubMed
    1. Chinetti-Gbaguidi G, Colin S, Staels B. Macrophage subsets in atherosclerosis. Nat. Rev. Cardiol. 2015;12:10–17. doi: 10.1038/nrcardio.2014.173. - DOI - PubMed

Publication types

MeSH terms