. 2018 Mar 2;9(1):914.
doi: 10.1038/s41467-018-03307-8.

Sipa1 deficiency unleashes a host-immune mechanism eradicating chronic myelogenous leukemia-initiating cells

Affiliations

Sipa1 deficiency unleashes a host-immune mechanism eradicating chronic myelogenous leukemia-initiating cells

Yan Xu et al. Nat Commun. .

Abstract

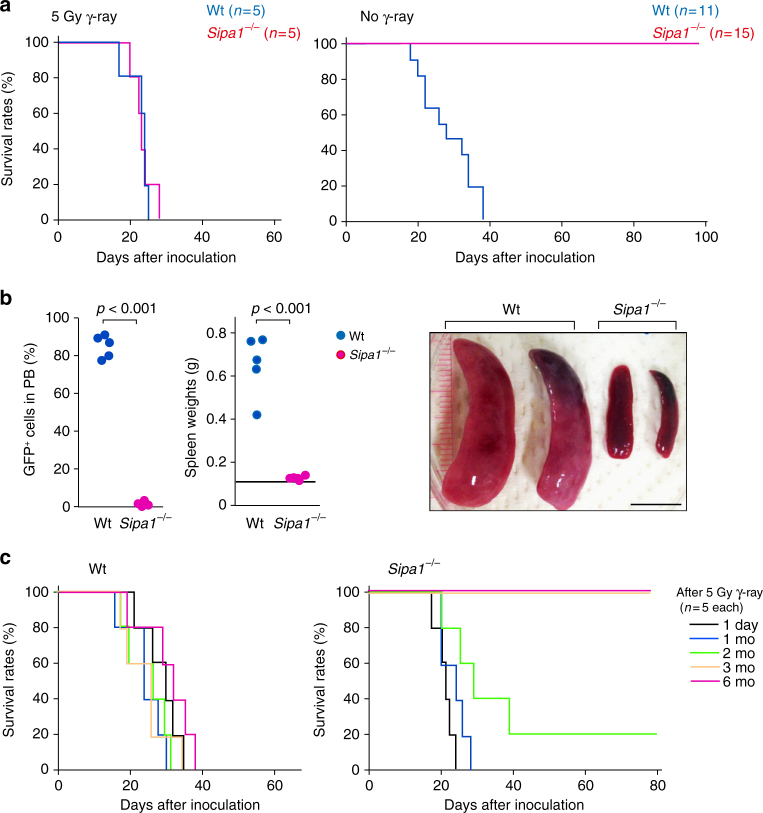
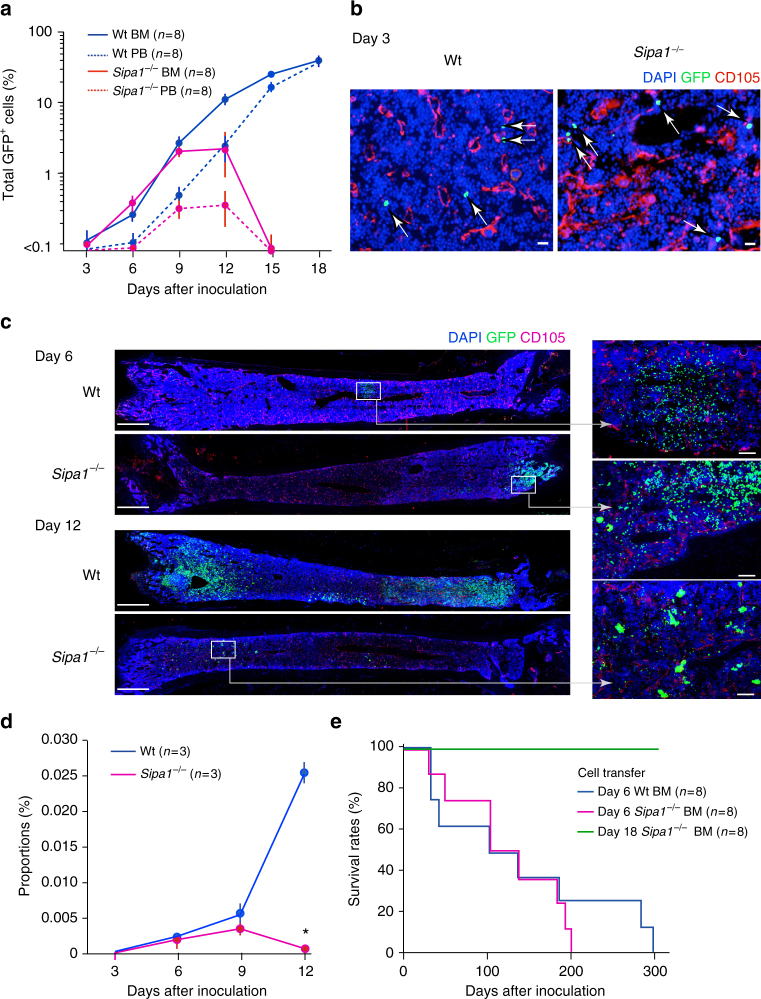
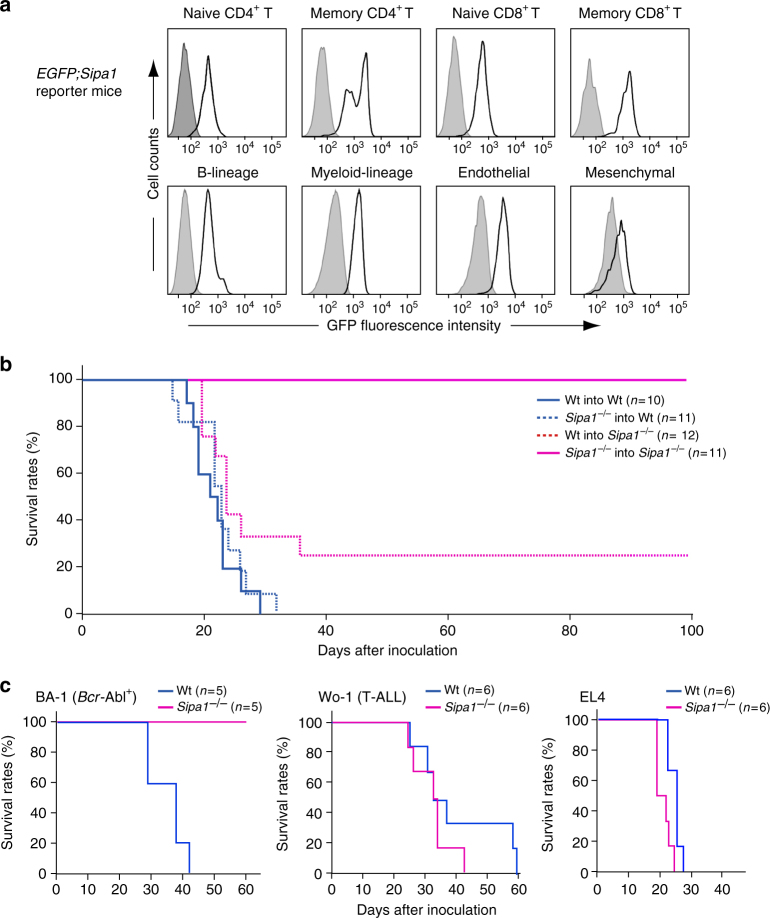
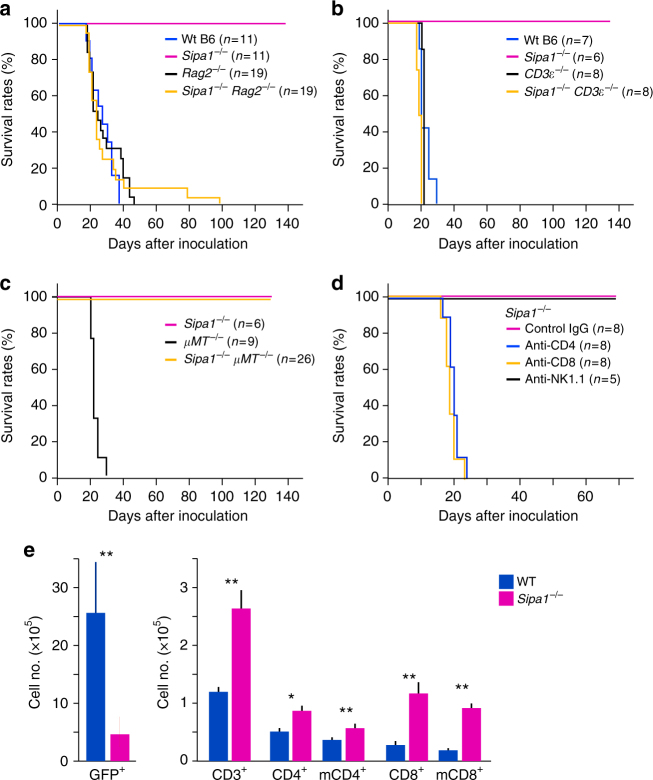
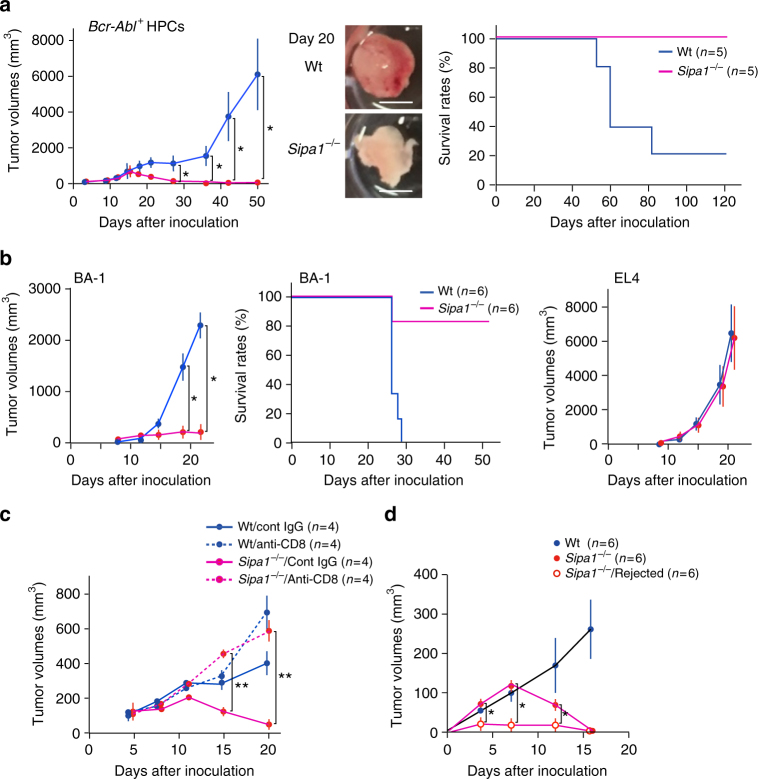
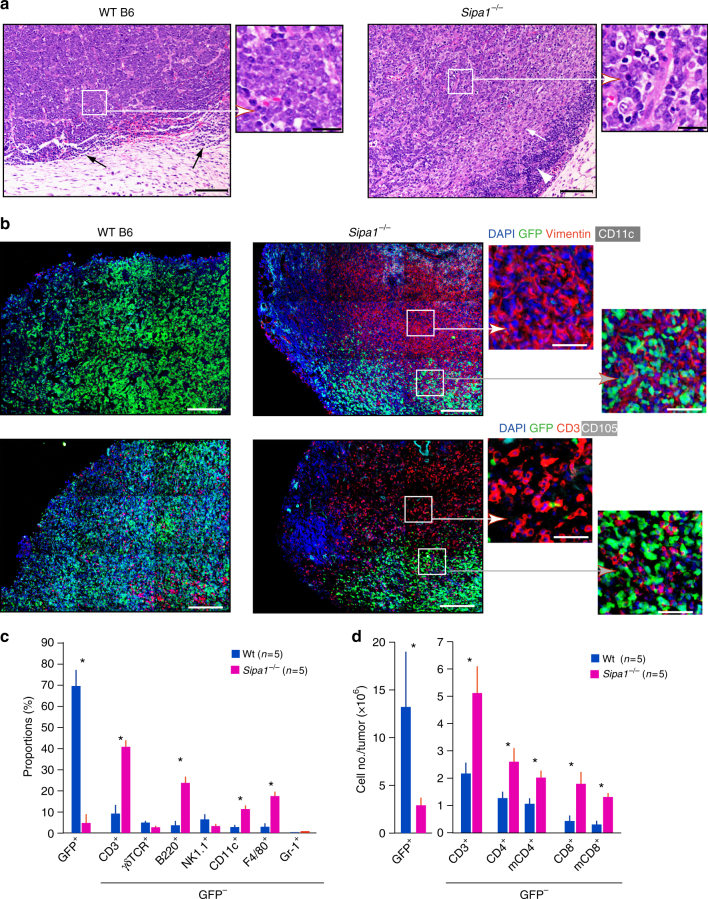
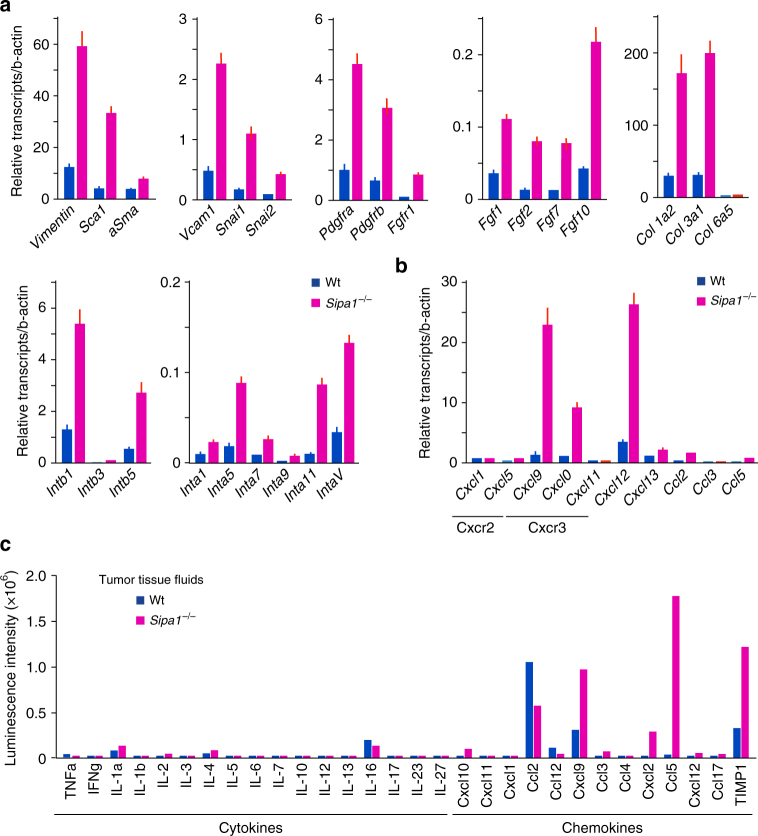
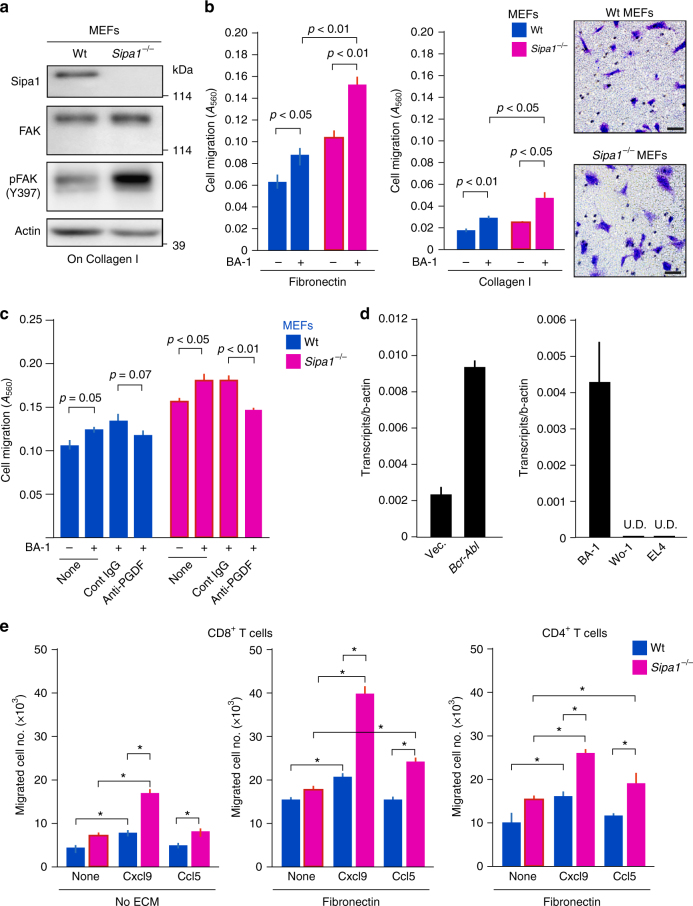
Chronic myelogenous leukemia (CML) caused by hematopoietic stem cells expressing the Bcr-Abl fusion gene may be controlled by Bcr-Abl tyrosine kinase inhibitors (TKIs). However, CML-initiating cells are resistant to TKIs and may persist as minimal residual disease. We demonstrate that mice deficient in Sipa1, which encodes Rap1 GTPase-activating protein, rarely develop CML upon transfer of primary hematopoietic progenitor cells (HPCs) expressing Bcr-Abl, which cause lethal CML disease in wild-type mice. Resistance requires both T cells and nonhematopoietic cells. Sipa1-/- mesenchymal stroma cells (MSCs) show enhanced activation and directed migration to Bcr-Abl+ cells in tumor tissue and preferentially produce Cxcl9, which in turn recruits Sipa1-/- memory T cells that have markedly augmented chemotactic activity. Thus, Sipa1 deficiency uncovers a host immune mechanism potentially capable of eradicating Bcr-Abl+ HPCs via coordinated interplay between MSCs and immune T cells, which may provide a clue for radical control of human CML.


Conflict of interest statement

This work was supported in part by research funding from Sumitomo Dainippon Pharma Co., Ltd.

Figures

Fig. 1
Fig. 1
Bcr-Abl+ HPCs fail to develop CML in unirradiated Sipa1−/− mice. a Normal Lin BM cells (HPCs) from Wt B6 mice were infected with retrovirus containing p210Bcr-Abl and intravenously injected into Wt B6 and Sipa1−/− B6 mice at 1.5 × 104 cells per mouse with or without prior γ-ray irradiation. Survival curves of the indicated numbers of mice per group are shown. Independent experiments were performed for two times with similar results. b On day 20 after injection of Bcr-Abl+ HPCs, the proportions of GFP+ cells in the peripheral blood (PB) leukocytes and the weights of spleens were examined. A bar indicates the mean spleen weight of control mice, and p values were determined with two-tailed unpaired Student’s t-test. Representative pictures of spleens are also shown. Scale bar, 10 mm. c Wt and Sipa1−/− mice were intravenously injected with Bcr-Abl+ HPCs at varying intervals after irradiation with 5 Gy γ-ray. Survival curves of five mice per group are shown. Independent experiments were done twice with similar results
Fig. 2
Fig. 2
Bcr-Abl+ HPCs home to and initiate proliferation in BM but are eventually rejected in the Sipa1−/− host. a Bcr-Abl+ HPCs were intravenously injected into unirradiated Wt and Sipa1−/− mice, and the proportions of GFP+ cells in the BM and PB were assessed with FACS on varying days after injection. The means and standard errors (SEs) of eight mice are shown. The experiments were performed twice with similar results. b On day 3 after injection with Bcr-Abl+ HPCs, BMs were immunostained with DAPI, anti-GFP antibody, and anti-CD105 antibody for endothelial cells. Arrows indicate the injected GFP+ cells in the BM parenchyme. Scale bars, 20 μm. Similar results were confirmed in three mice of each group. c On days 6 and 12, BMs were immunostained with DAPI, anti-GFP, and anti-CD105 antibodies. The enlarged images of boxed regions are also shown. Scale bars, 1 mm and 100 μm (enlarged). Similar results were obtained in three mice of each group. d The proportions of GFP+ Lin cKit+ Sca-1+ (LKS) cells in the BM of Wt and Sipa1−/− mice were assessed with FACS at varying days after injection of Bcr-Abl+ HPCs. The means and SEs of three mice per group are shown. *p < 0.01 (two-tailed unpaired Student’s t-test). e BM cells from Wt and Sipa1−/− mice that received Bcr-Abl+ HPCs were harvested on day 6 and day 18, and intravenously injected into the secondary unirradiated Wt B6 mice on a one-to-one basis. Survival curves of eight recipients per group are shown
Fig. 3
Fig. 3
CML resistance of Sipa1−/− mice requires both hematopoietic and non-hematopoietic cells. a Expression of GFP in the BM cells of EGFP; Sipa1 reporter mice was analyzed with FACS at the gates of CD3+ CD44low CD62Lhigh CD4+ (naive CD4 T), CD3+ CD44high CD62Llow CD4+ (memory CD4 T), CD3+ CD44low CD62Lhigh CD8+ (naive CD8 T), CD3+ CD44high CD62Llow CD8+ (memory CD8 T), CD45+ B220+ (B-lineage), CD45+ CD11b+ (Myeloid), CD45 Ter119 CD31+ (Endothelial), and CD45 Ter119 CD31 PDGFRα+ (Mesenchymal). Shaded regions indicate staining with isotype-matched control IgG. The intensities of GFP were confirmed to correlate with the intracellular Sipa1 expression levels. b BM chimeras between Wt and Sipa1−/− mice were generated for all four donor/recipient combinations as indicated. At the intervals of 4–6 months after BMT, Bcr-Abl+ HPCs of Wt mice were intravenously injected into the chimeric mice at 1.5× 104 cells per mouse. Survival curves of indicated numbers of recipients per group are shown. c Leukemia cell lines of B6 mice, BA-1 (Bcr-Abl+ CML), Wo-1 (T-ALL), and EL4 (T cell), were intravenously injected at 105 cells per mouse into Wt and Sipa1−/− mice, and the survival rates were examined. Independent experiments were repeated for at least three times with similar results
Fig. 4
Fig. 4
T cells of both CD4+ and CD8+ cell types are essential for CML resistance of Sipa1−/− mice. ac Sipa1−/− mice were crossed with Rag2−/−, CD3ε−/−, or μMT−/− mice to generate double KO mice, and Bcr-Abl+ HPCs of Wt B6 mice were intravenously injected in the unirradiated mice. Survival curves of the indicated numbers of mice per group are shown. d Sipa1−/− mice were injected with anti-CD4, anti-CD8, anti-NK1.1 antibody, or control IgG twice per week beginning from the day before the injection of Bcr-Abl+ HPCs. The antibody treatment was confirmed to eliminate more than 95% of the corresponding cell types in the spleen. Survival curves of the indicated numbers of mice per group are shown. e Wt and Sipa1−/− B6 mice were intravenously injected with Bcr-Abl+ HPCs at 1.5 × 104 cells per mouse, and 12 days later the BM cells were harvested and multi-color analyzed with indicated markers using FACS Canto. The means and SEs of cell numbers of indicated cell populations of five mice per group are shown. *p < 0.05; **p < 0.01 (two-tailed unpaired Student’s t-test); m memory phenotype. The similar experiments were repeated two times with similar results
Fig. 5
Fig. 5
Sipa1−/− mice reject the subcutaneous tumors by Bcr-Abl+ HPCs in a T-cell-dependent manner and develop immune memory. a Bcr-Abl+ HPCs in Matrigel matrix were injected subcutaneously into Wt and Sipa1−/− mice at 1.5 × 104 cells per mouse, and the tumor volumes in the local sites were measured. The means and SEs of tumor volumes and survival curves of five mice per group are shown. *p < 0.05 (two-tailed unpaired Student’s t-test). The experiments were done at least three times with similar results. Representative pictures of tumor masses on day 20 are also indicated. Scale bars, 5 mm. The white mass in Sipa1−/− mice represents residual Matrigel matrix. b BA-1 or EL4 leukemia cells were subcutaneously injected into Wt and Sipa1−/− mice, and the tumor volumes were measured. The means and SEs of tumor volumes and survival curves of six mice per group are shown. *p < 0.05 (two-tailed unpaired Student’s t-test). The experiments were performed four times. c Wt and Sipa1−/− mice were injected with anti-CD8 antibody or isotype-matched IgG, followed by subcutaneous challenge with Bcr-Abl+ HPCs. The means and SEs of tumor volumes of four mice per group are shown. **p < 0.01 (two-tailed unpaired Student’s t-test). The experiments were done twice. d Sipa1−/− mice were subcutaneously injected with Bcr-Abl+ HPCs on one side of frank. Thirty days later, when the tumors were completely rejected, these mice were rechallenged with Bcr-Abl+ HPCs on the other side of frank. Untreated Wt and Sipa1−/− mice served as unimmunized controls. The means and SEs of tumor volumes of six mice per group are shown. *p < 0.05 (two-tailed unpaired Student’s t-test)
Fig. 6
Fig. 6
Marked increase in memory T-cell infiltration inside Bcr-Abl+ tumors coinciding with increase vimentinhigh MSCs in Sipa1−/− mice. a Bcr-Abl+ HPCs were subcutaneously injected in Matrigel matrix in Wt and Sipa1−/− mice, and the tumors on day 15 were fixed and stained with hematoxylin and eosin. Black arrows for Wt mice indicate mononuclear cell infiltration in the peripheral edges of the tumor mass. Scale bars, 100 and 20 μm (enlarged). The white arrow and arrowhead indicate stromal reaction and dense mononuclear cell infiltration, respectively. Enlarged images of boxed regions are also shown. b Serial sections of subcutaneous Bcr-Abl+ tumors in Wt and Sipa1−/− mice were immunostained with indicated antibodies. Enlarged images of boxed regions are also shown. Scale bars, 200 and 50 μm (enlarged). c Subcutaneous Bcr-Abl+ tumors on day 15 in Wt and Sipa1−/− mice were dispersed into single-cell suspensions in collagenase/DNase I solution and analyzed for the indicated cell markers with FACS. The means and SEs of the proportions of five mice per group are shown. *p < 0.01 (two-tailed unpaired Student’s t-test). Experiments were done three times with similar results. d Subcutaneous Bcr-Abl+ tumors on day 12 in Wt and Sipa1−/− mice were FACS analyzed, and the actual cell numbers of indicated cell types in tumor tissues were calculated. The means and SEs of five mice per group are shown. m memory phenotype; *p < 0.01 (two-tailed unpaired Student’s t-test). Experiments were done twice with similar results
Fig. 7
Fig. 7
Sipa1−/− MSCs in Bcr-Abl+ tumor tissue show mesenchymal gene activation with preferential production of T-cell chemokines. a, b MSCs (GFP CD45 Ter119 CD31) were sorted from the subcutaneous tumors of Wt and Sipa1−/− mice on day 7 after subcutaneous injection of Bcr-Abl+ HPCs, and the expression of indicated genes was assessed with quantitative PCR. Reanalysis of the sorted cell population indicated that the contamination of GFP+ cells was <0.5%. Three to four mice of each group were pooled for an experiment, and independent experiments were done twice with similar results. c Cytokines and chemokines in the tissue fluids of Bcr-Abl+ tumors of Wt and Sipa1−/− mice on day 15 after subcutaneous injection of Bcr-Abl+ HPCs were assessed using mouse cytokine antibody array
Fig. 8
Fig. 8
Sipa1−/− MEFs show enhanced migration directed to Bcr-Abl+ CML cells and Sipa1−/− T cells augmented chemotaxis in response to chemokines. a Wt and Sipa1−/− MEFs cultured on collagen I were lysed and immunoblotted with indicated antibodies. b Directed migration of Wt and Sipa1−/− MEFs to BA-1 CML cells were assessed using the Boyden chamber assay in the presence of fibronectin or collagen I. The means and SEs of quadruplicate culture are shown, and p values were determined with two-tailed unpaired Student’s t-test. The experiments were repeated three times with similar results. Pictures of crystal violet-stained migrated cells are also indicated. Scale bars, 50 μm. c In the Boyden chambers, anti-PDGFa antibody or isotype-matched control IgG was added to the lower wells at 20 μg/mL with BA-1 cells. The means and SEs of quadruplicate culture are shown, and p values were determined with two-tailed unpaired Student’s t-test. d Primary Lin BM cells were transduced with p210Bcr-Abl or control vector. Three days later, GFP+ cells were sorted, and Pdgfa expression was assessed with quantitative PCR (left). Expression of Pdgfa in BA-1, Wo-1, and EL4 cell lines was also examined (right). U.D., undetectable. e Chemotactic activity of sorted Wt and Sipa1−/− CD8+ T cells and CD4+ T cells that had been activated on the coated anti-CD3 antibody for 24 h were assessed in response to Cxcl9 and Ccl5 (100 ng/mL) using the Boyden chamber assay in the presence or absence of fibronectin. The means and SEs of triplicate determination are shown. The experiments were repeated at least two times with similar results. *p < 0.01 (two-tailed unpaired Student’s t-test)

Similar articles

Cited by

References

    1. Liotta LA, Kohn EC. The microenvironment of the tumour-host interface. Nature. 2001;411:375–379. doi: 10.1038/35077241. - DOI - PubMed
    1. Trinchieri G. Cancer and inflammation: an old intuition with rapidly evolving new concepts. Annu. Rev. Immunol. 2012;30:677–706. doi: 10.1146/annurev-immunol-020711-075008. - DOI - PubMed
    1. Kalluri R, Zeisberg M. Fibroblasts in cancer. Nat. Rev. Cancer. 2006;6:392–401. doi: 10.1038/nrc1877. - DOI - PubMed
    1. Vesely MD, Kershaw MH, Schreiber RD, Smyth MJ. Natural innate and adaptive immunity to cancer. Annu. Rev. Immunol. 2011;29:235–271. doi: 10.1146/annurev-immunol-031210-101324. - DOI - PubMed
    1. Galon J, Angell HK, Bedognetti D, Marincola FM. The continuum of cancer immunosurveillance: prognostic, predictive, and mechanistic signatures. Immunity. 2013;39:11–26. doi: 10.1016/j.immuni.2013.07.008. - DOI - PubMed

Publication types

MeSH terms