. 2018 Mar 2;9(1):918.
doi: 10.1038/s41467-018-03371-0.

Integrative analysis of omics summary data reveals putative mechanisms underlying complex traits

Affiliations

Integrative analysis of omics summary data reveals putative mechanisms underlying complex traits

Yang Wu et al. Nat Commun. .

Abstract

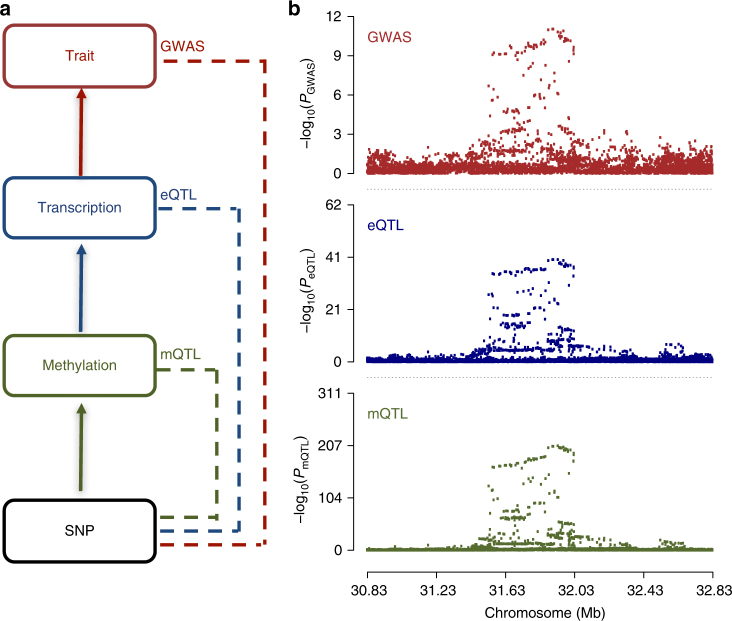
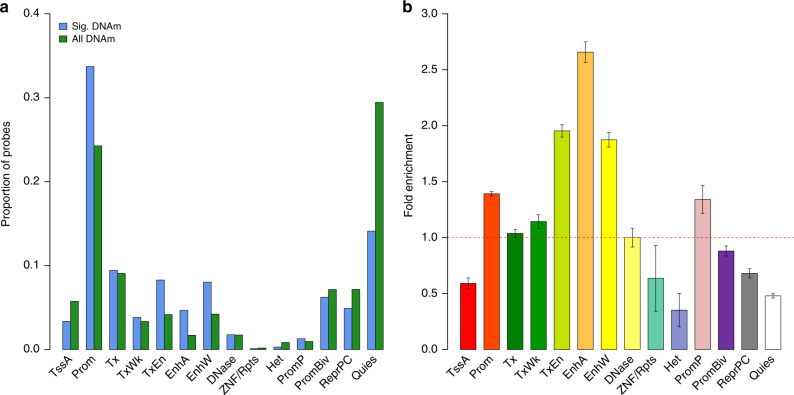
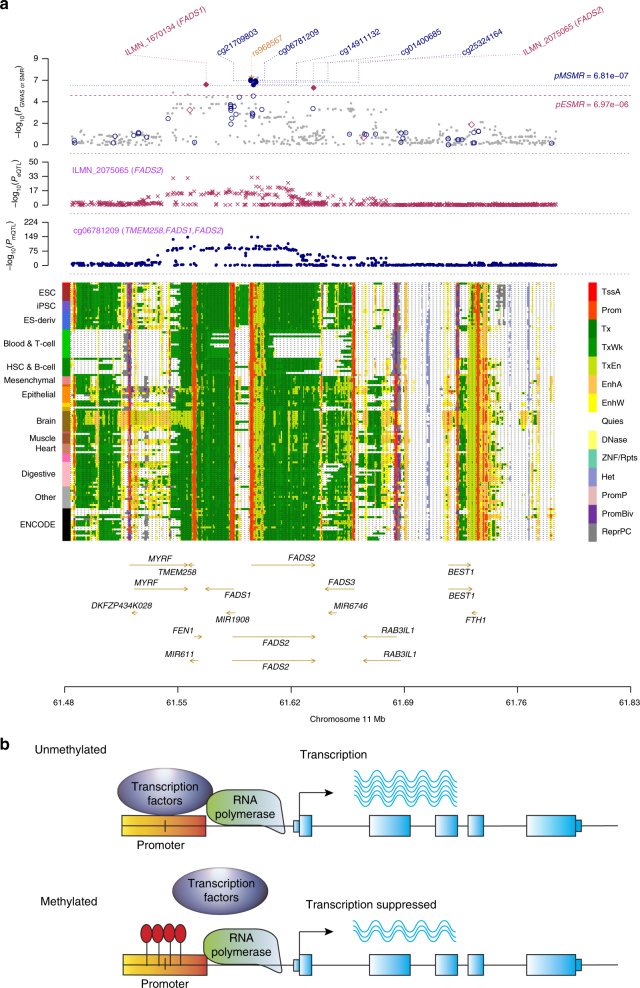
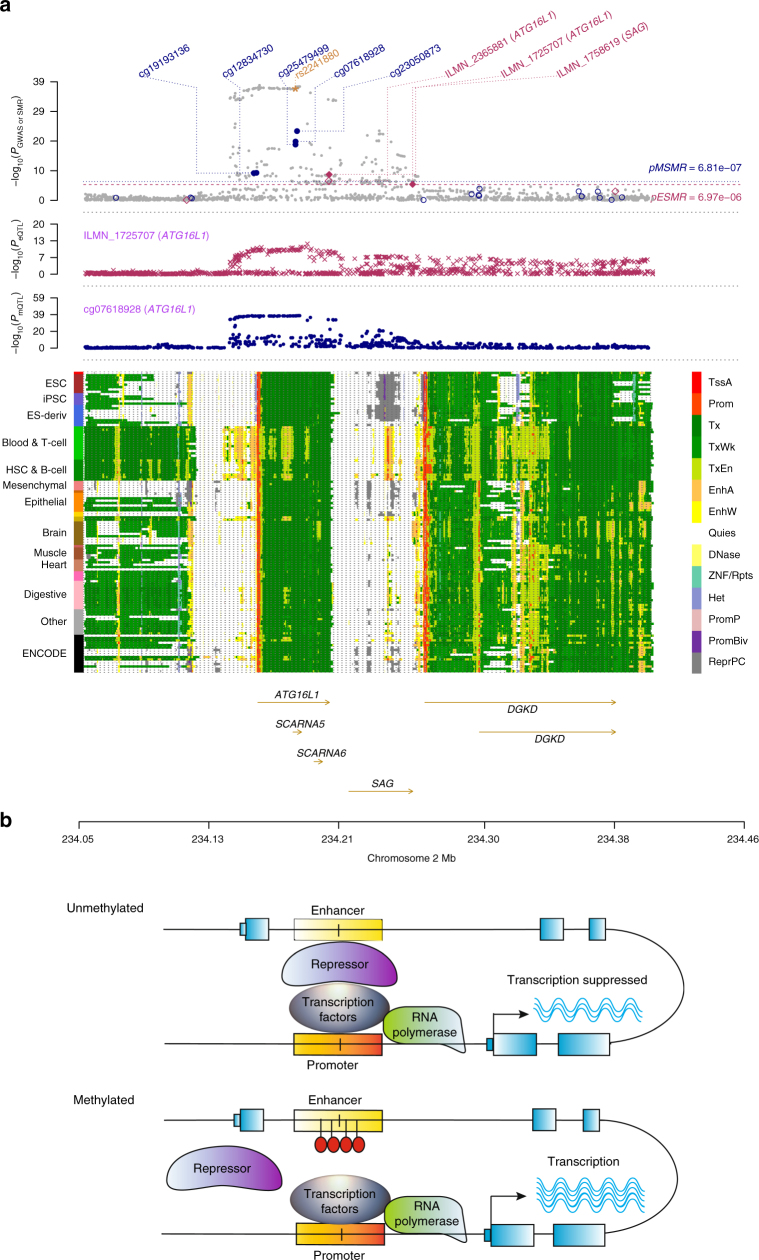
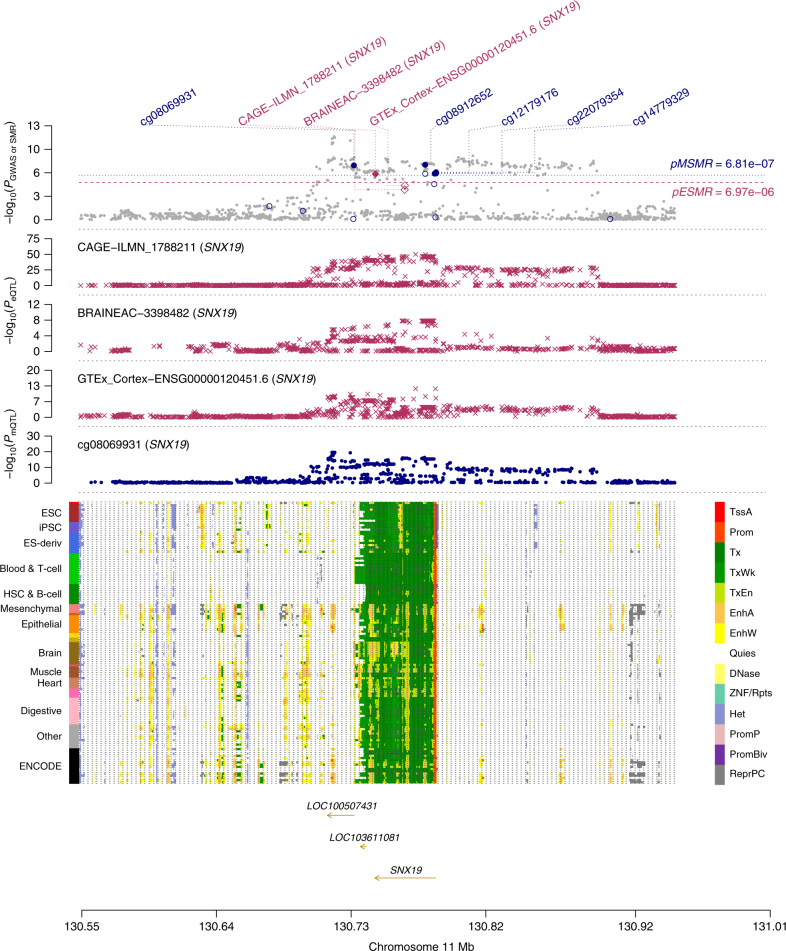
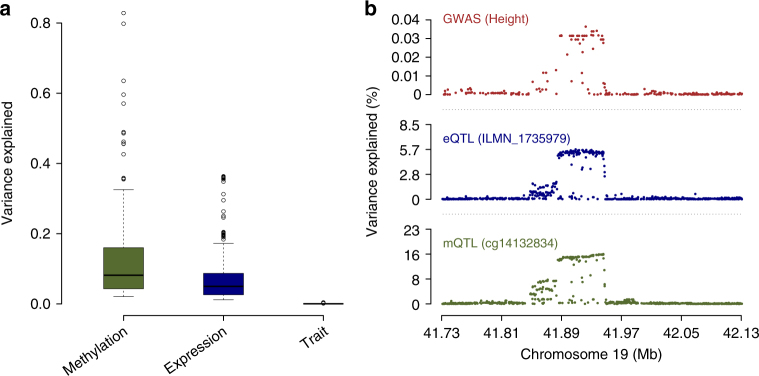
The identification of genes and regulatory elements underlying the associations discovered by GWAS is essential to understanding the aetiology of complex traits (including diseases). Here, we demonstrate an analytical paradigm of prioritizing genes and regulatory elements at GWAS loci for follow-up functional studies. We perform an integrative analysis that uses summary-level SNP data from multi-omics studies to detect DNA methylation (DNAm) sites associated with gene expression and phenotype through shared genetic effects (i.e., pleiotropy). We identify pleiotropic associations between 7858 DNAm sites and 2733 genes. These DNAm sites are enriched in enhancers and promoters, and >40% of them are mapped to distal genes. Further pleiotropic association analyses, which link both the methylome and transcriptome to 12 complex traits, identify 149 DNAm sites and 66 genes, indicating a plausible mechanism whereby the effect of a genetic variant on phenotype is mediated by genetic regulation of transcription through DNAm.


Conflict of interest statement

The authors declare no competing interests.

Figures

Fig. 1
Fig. 1
Schematic of our integrative analysis of multi-omics data. a A hypothetical model of a mediation mechanism tested in our analysis: an SNP exerts an effect on the trait by altering the DNAm level, which regulates the expression levels of a functional gene. b An example by simulation under our hypothetical model (Supplementary Note 1), in which the observed SNP-association signals are consistent at the shared GWAS locus across methylation, transcript and trait phenotype (see Fig. 7b for a real data example)
Fig. 2
Fig. 2
Enrichment analysis of transcript-associated DNAm probes identified by the SMR & HEIDI test for 14 main functional annotation categories. a Distribution of the transcript-associated DNAm probes ('Sig. DNAm', blue) across the 14 functional categories in comparison to that of all DNAm probes in the data ('All DNAm', green). b Fold enrichment: a comparison of the associated probes with the same probes sampled repeatedly at random with the variance of each probe matched. Error bar represents the standard error of an estimate obtained from 500 random samples. The 14 functional categories are: TssA active transcription start site, Prom upstream/downstream TSS promoter, Tx actively transcribed state, TxWk weak transcription, TxEn transcribed and regulatory Prom/Enh, EnhA active enhancer, EnhW weak enhancer, DNase primary DNase, ZNF/Rpts state associated with zinc-finger protein genes, Het constitutive heterochromatin, PromP Poised promoter, PromBiv bivalent regulatory states, ReprPC repressed Polycomb states, Quies a quiescent state
Fig. 3
Fig. 3
Pinpointing functional regions for a complex trait with consistent SMR association signals across multi-omics layers. Shown are −log10 (P-values) from the SMR tests for schizophrenia against the physical positions of DNAm or gene expression probes. The blue lines (outer ring) represent −log10 (P-values) from the SMR tests for associations between DNA methylation and trait, the green lines (inner ring) represent those for the associations between transcripts and trait and the yellow lines (middle ring) represent the significant associations between methylations and transcripts. The orange circles represent the significance thresholds of the SMR tests. The black lines are the significant SMR associations consistent across all three layers, and the red lines highlight the significant and consistent SMR associations that are not rejected by the HEIDI test. Due to the large scale of the plot, DNAm and genes that are distally associated (e.g. >500 kb and <2 Mb) appear to be closely located in the figure
Fig. 4
Fig. 4
Prioritizing genes and regulatory elements at the FADS1/FADS2 locus for rheumatoid arthritis (RA) with a plausible regulation mechanism. a Results of SNP and SMR associations across mQTL, eQTL and GWAS. The top plot shows −log10(P-values) of SNPs from the GWAS meta-analysis for RA. The red diamonds and blue circles represent −log10(P-values) from SMR tests for associations of gene expression and DNAm probes with RA, respectively. The solid diamonds and circles are the probes not rejected by the HEIDI test. The yellow star indicates the previously reported causal variant rs968567. The second plot shows −log10(P-values) of the SNP association for gene expression probe ILMN_2075065 (tagging FADS2) from the CAGE eQTL study. The third plot shows −log10(P-values) of the SNP associations for DNAm probe cg06781209 from the mQTL study. The bottom plot shows 14 chromatin state annotations (indicated by colours) of 127 samples from REMC for different primary cells and tissue types (rows). b A hypothetical regulation mechanism. When the DNAm site in the promoter is unmethylated, the transcription factor SREBF2 (activator) binds to the promoter and enhances the transcription of the FADS2 gene. When the DNAm site is methylated (by the effect of the genetic variant rs968567 at the promoter), the binding of SREBF2 is disrupted and therefore the transcription of FADS2 is suppressed
Fig. 5
Fig. 5
Prioritizing genes and regulatory elements at the ATG16L1 locus for Crohn’s disease (CD) with a plausible regulation mechanism. a Results of SNP and SMR associations across mQTL, eQTL and GWAS. The top plot shows −log10(P-values) of SNP from the GWAS meta-analysis for CD. The red diamonds and blue circles represent –log10(P-values) from the SMR tests for associations of gene expression and DNAm probes with CD, respectively. The solid diamonds and circles represent the probes not rejected by the HEIDI test. The yellow star indicates the previously reported causal variant rs2241880. The second plot shows −log10(P-values) of the SNP associations for gene expression probe ILMN_1725707 (tagging ATG16L1). The third plot shows −log10(P-values) of the SNP associations for DNAm probe cg07618928. The bottom plot shows 14 chromatin state annotations (indicated by colours) of 127 samples from REMC for different primary cells and tissue types (rows). b A hypothetical regulation mechanism. When the DNAm site in the enhancer is unmethylated, repressors can bind to the enhancer, decrease the activity of the promoter, and thus suppress the transcription of the ATG16L1 gene. When the DNAm site is methylated (by the effect of the genetic variant rs2241880 in the enhancer), the binding of repressors is disrupted, which prevents the transcription of ATG16L1 from suppression
Fig. 6
Fig. 6
Replication analysis in the SNX19 locus for schizophrenia (SCZ). The top plot shows −log10(P-values) of the SNPs from the GWAS meta-analysis for SCZ. The red diamonds and blue circles represent −log10(P-values) from the SMR tests for associations of gene expression and DNAm probes with SCZ, respectively. The solid diamonds and circles represent the probes not rejected by the HEIDI test. Plot #2, #3 and #4 (red crosses) show −log10(P-values) of the eQTL for gene SNX19 from three independent data sets. The plot #5 (blue dots) shows −log10(P-values) of the mQTL for DNAm probe cg08069931. The bottom plot shows 14 chromatin state annotations (indicated by colours) of 127 samples from REMC for different primary cells and tissue types (rows)
Fig. 7
Fig. 7
The attenuation of effect sizes of genetic variants on methylation and gene expression towards complex traits. a Distribution of the variance explained in methylation, gene expression and trait phenotypes by the top mQTLs for the 149 DNAm that are significantly associated with both 66 transcripts and 12 traits. Of 225 DNAm–transcript pairs, there are 160 pairs for which the mQTL effect is higher than the eQTL effect (both in SD units). b An example of a genomic locus for height, where the SNP-association signals are consistent across mQTL, eQTL and GWAS, indicating a single shared underlying causal variant, but the variance explained decreases dramatically across these studies

References

    1. Visscher PM, Brown MA, McCarthy MI, Yang J. Five years of GWAS discovery. Am. J. Hum. Genet. 2012;90:7–24. doi: 10.1016/j.ajhg.2011.11.029. - DOI - PMC - PubMed
    1. Welter D, et al. The NHGRI GWAS Catalog, a curated resource of SNP-trait associations. Nucleic Acids Res. 2014;42:D1001–D1006. doi: 10.1093/nar/gkt1229. - DOI - PMC - PubMed
    1. Yang J, et al. Ubiquitous polygenicity of human complex traits: genome-wide analysis of 49 traits in Koreans. PLOS Genet. 2013;9:e1003355. doi: 10.1371/journal.pgen.1003355. - DOI - PMC - PubMed
    1. Sudlow C, et al. UK Biobank: an open access resource for identifying the causes of a wide range of complex diseases of middle and old Age. PLOS Med. 2015;12:e1001779. doi: 10.1371/journal.pmed.1001779. - DOI - PMC - PubMed
    1. Boyle EA, Li YI, Pritchard JK. An expanded view of complex traits: from polygenic to omnigenic. Cell. 2017;169:1177–1186. doi: 10.1016/j.cell.2017.05.038. - DOI - PMC - PubMed

Publication types

MeSH terms

LinkOut - more resources