. 2018 Mar 2;8(1):3945.
doi: 10.1038/s41598-018-22142-x.

Improved isolation strategies to increase the yield and purity of human urinary exosomes for biomarker discovery

Affiliations

Improved isolation strategies to increase the yield and purity of human urinary exosomes for biomarker discovery

Ali Hashemi Gheinani et al. Sci Rep. .

Abstract

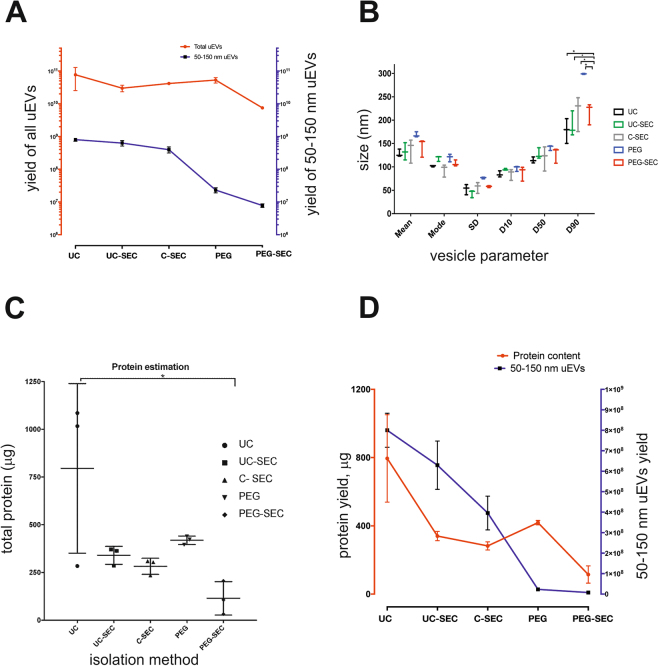
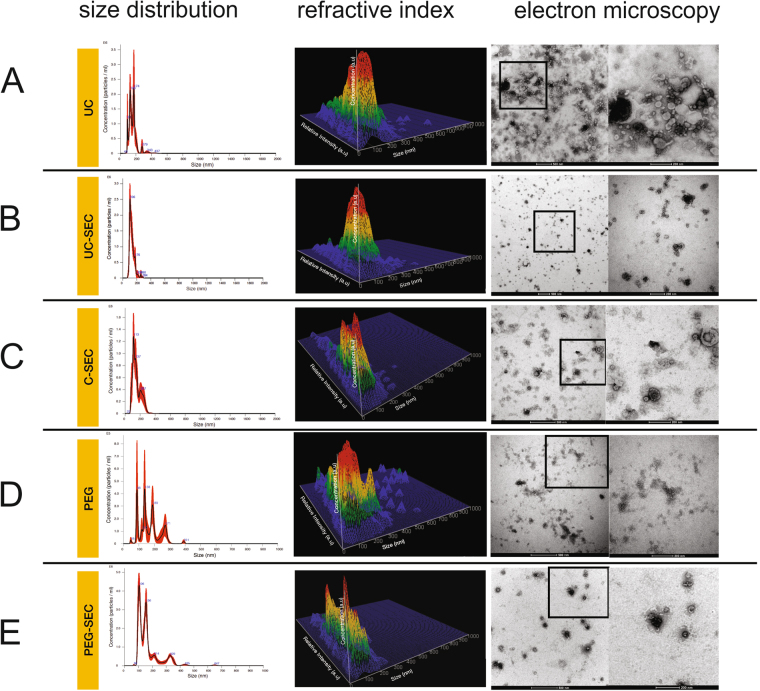
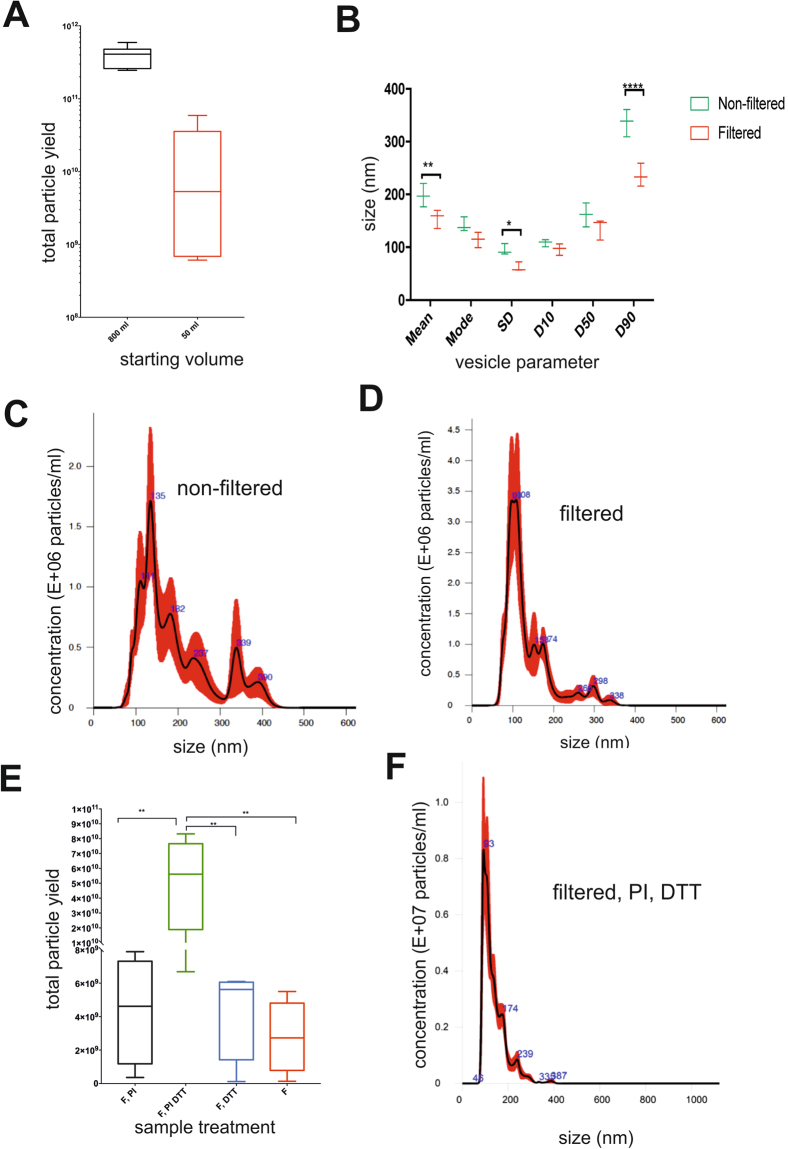
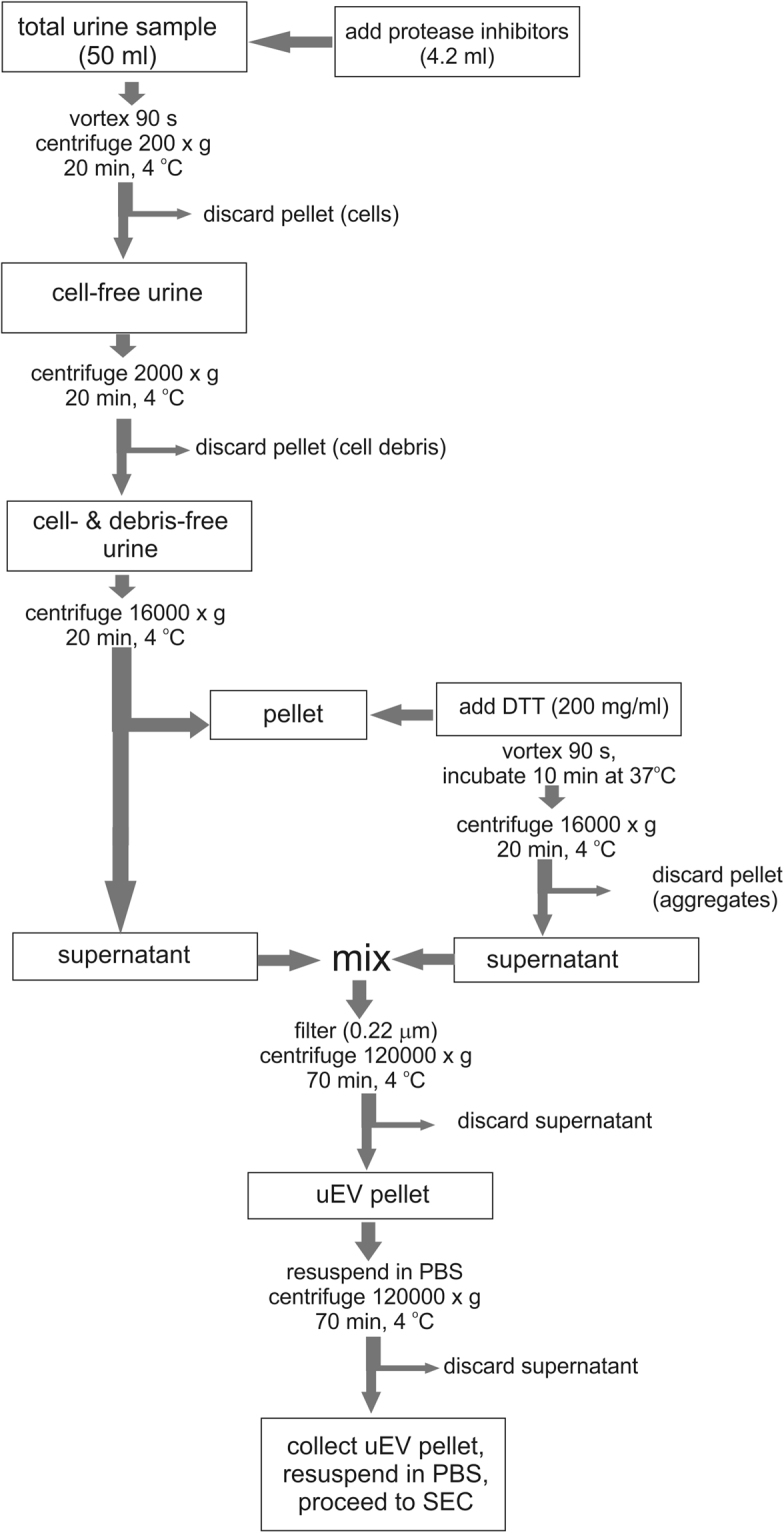
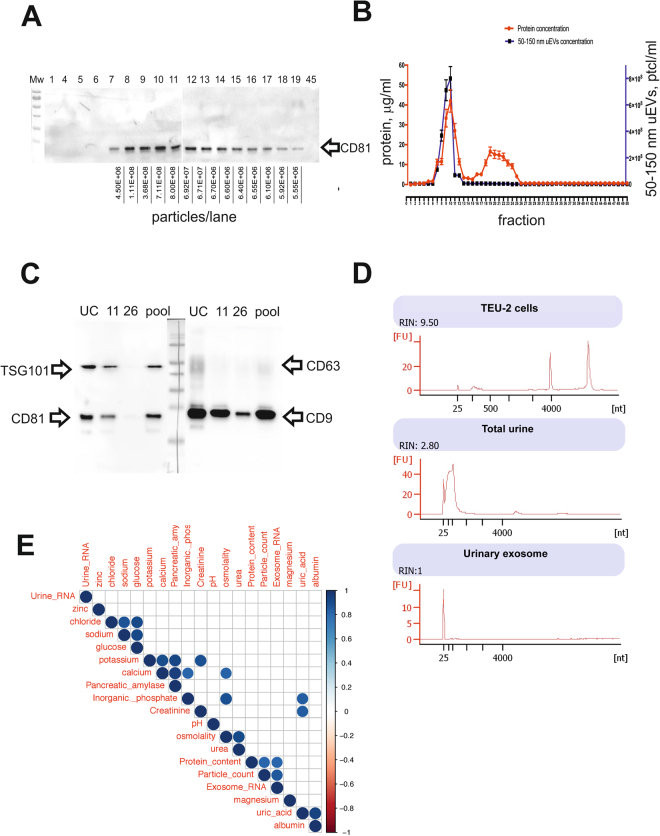
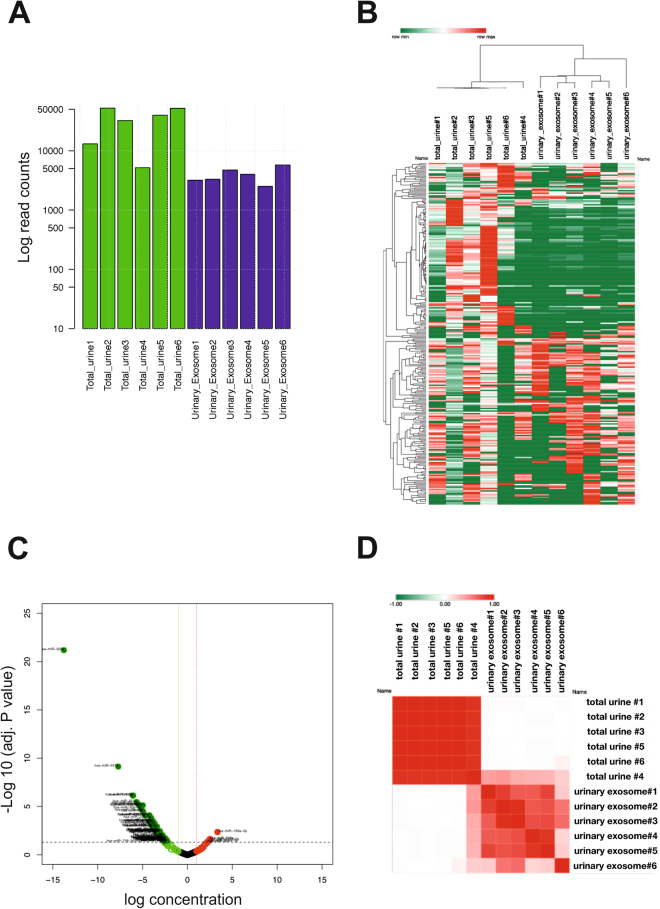
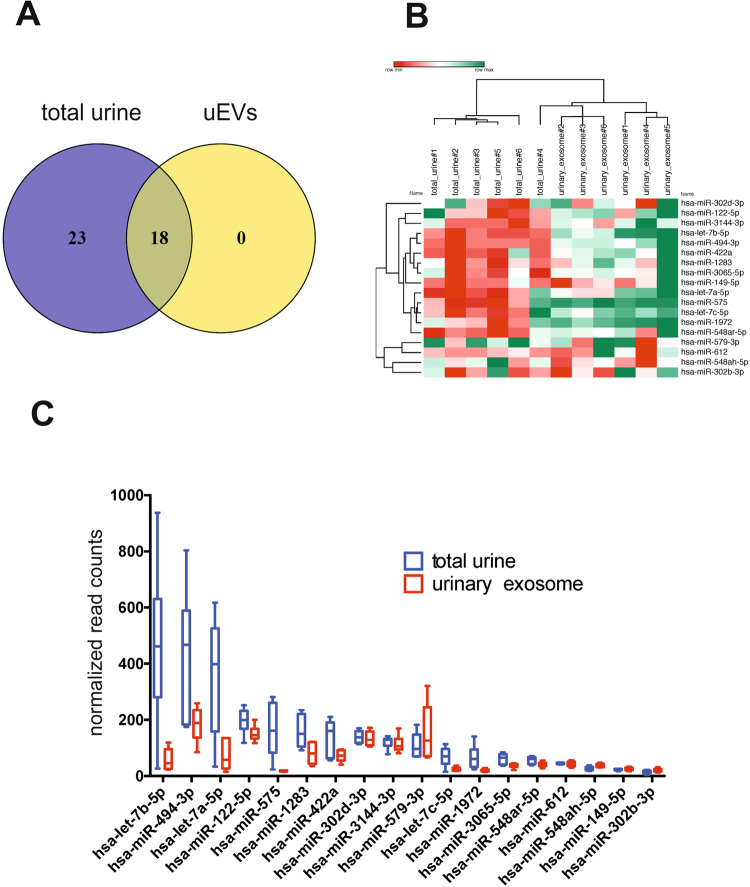
Circulating miRNAs are detected in extracellular space and body fluids such as urine. Circulating RNAs can be packaged in secreted urinary extracellular vesicles (uEVs) and thus protected from degradation. Urinary exosome preparations might contain specific miRNAs, relevant as biomarkers in renal and bladder diseases. Major difficulties in application of uEVs into the clinical environment are the high variability and low reproducibility of uEV isolation methods. Here we used five different methods to isolate uEVs and compared the size distribution, morphology, yield, presence of exosomal protein markers and RNA content of uEVs. We present an optimized ultracentrifugation and size exclusion chromatography approach for highly reproducible isolation for 50-150 nm uEVs, corresponding to the exosomes, from 50 ml urine. We profiled the miRNA content of uEVs and total urine from the same samples with the NanoString platform and validated the data using qPCR. Our results indicate that 18 miRNAs, robustly detected in uEVs were always present in the total urine. However, 15 miRNAs could be detected only in the total urine preparations and might represent naked circulating miRNA species. This is a novel unbiased and reproducible strategy for uEVs isolation, content normalization and miRNA cargo analysis, suitable for biomarker discovery studies.


Conflict of interest statement

The authors declare no competing interests.

Figures

Figure 1
Figure 1
Particle and protein yields of uEVs isolated by different methods. uEVs were isolated from 50 ml of the same urine by 5 different methods: UC = ultracentrifugation, UC-SEC = ultracentrifugation followed by size exclusion chromatography, C-SEC = concentration followed by size exclusion chromatography, PEG = isolation by polyethylene glycol, PEG-SEC = isolation by polyethylene glycol followed by size exclusion chromatography. The results are shown as mean ± SEM of 5 experiments performed in triplicates. (A) Number of uEVs isolated by 5 different methods. NTA was performed on isolated uEVs to calculate total particles (left Y-axis in red) and particles in range of 50–150 nm (right Y-axis in blue) in the same sample. (B) Size characteristics of uEVs. Mean, mode, standard deviation and different size distributions (D10, D50 and D90) were calculated in samples isolated by 5 different methods. D10 = 10% of particles are below the size indicated as D10, D50 = 50% of particles are below the size indicated as D50, D90 = 90% of particles are below the size indicated as D90. Tukey’s multiple comparisons test showed the most significant differences in D90 between PEG-SEC and all other methods (adjusted p value < 0.1–0.0001). (C) Protein content of uEVs measured by BCA. Tukey’s multiple comparisons test was performed and adjusted p-value of UC vs UC-SEC was 0.119, for UC vs C-SEC was 0.0707 and for UC vs. PEG-SEC was 0.0150. (D) Correlation between the total protein amount (left Y-axis in red) and 50–150 nm particle count (right Y-axis in blue) of uEVs.
Figure 2
Figure 2
Size distribution, dispersity, and morphology of uEVs isolated by different methods. Size distribution graphs show the concentration on Y-axis and size distribution in X-axis. Refractive index (a.u. = arbitrary units) shows 3D surface plot representing the quantity of light that uEVs scatter in Z-axis, concentration in Y-axis (particles/ml) and size distribution in X-axis. Electron microscopy pictures (images on the left) and a higher magnification of the inset (on the right) show the morphology of particles isolated by each method. Data of representative samples from each isolation method are shown. (A) Size distribution of particles, 3D surface graph of refractive index and EM picture (500 nm and 200 nm scale) of uEVs isolated by UC. (B) Size distribution of particles, 3D surface graph of refractive index and EM picture (500 nm and 200 nm scale) of uEVs isolated by UC-SEC. (C) Size distribution of particles, 3D surface graph of refractive index and EM picture (500 nm and 200 nm scale) of uEVs isolated by C-SEC. (D) Size distribution of particles, 3D surface graph of refractive index and EM picture (500 nm and 200 nm scale) of uEVs isolated by PEG. (E) Size distribution of particles, 3D surface graph of refractive index and EM picture (500 nm and 200 nm scale) of uEVs isolated by PEG-SEC.
Figure 3
Figure 3
Optimization of the UC-SEC protocol. (A) Effect of starting urine volume on the particle count and experimental variation. UC-SEC was done using 800 ml or 50 ml of the same urine sample and total particles counted by NTA. The data are the mean ± SEM of 6 independent experiments. (B) Filtration significantly reduced the mean size (adjusted p values < 0.0064), SD indicating variation in sub-populations (adjusted p values < 0.0360) and size of bigger particles (D90) (adjusted p values < 0.001) in filtered urine. (C) Size distribution and concentration of particles in a non-filtered urine sample. The most particle-rich SEC fraction from a representative experiment is shown. (D) Size distribution and concentration of particles in a filtered urine sample. Urine filtration results in a more homogenous particle size distribution compared to non-filtered samples. The most particle-rich SEC fraction from a representative experiment is shown. (E) Combination of filtration, PI and DTT treatment resulted in highest yield of uEVs isolated using SEC. All urine samples were filters using 0.22 um filters. The data are the mean ± SEM of 4 replicates, adjusted p-value <0.05. (F) Combination of filtration, PI and DTT treatment on size distribution of particles. The most particle-rich SEC fraction from a representative experiment is shown.
Figure 4
Figure 4
The optimized UC-SEC method overview Midstream, clean catch first-morning urine was collected. Urine samples (50 ml) were mixed with 4.2 ml of protease inhibitor (PI) solution immediately after urine collection. Urine was vortexed and centrifuged at 200 × g for 20 min to remove cells. After discarding the pellet, the cell-free urine was centrifuged at 2000 × g for 20 min to remove cell debris and large protein aggregates. Supernatant was centrifuged at 16000 × g for 20 min to remove ectosomes and other large particles. Supernatant was collected and kept in 4 °C. The pellet was treated with DTT (200 mg/ml) and incubated 10 min in 37 °C. After a short vortex the mixture was centrifuged at 16000 × g for 20 min and supernatant was pooled with the supernatant from last 16000 × g centrifugation step. The pooled supernatants were filtered through 0.22 μm filters and ultracentrifuged at 120000 × g for 70 min. The supernatant was carefully decanted, the pellet overlaid with particle-free PBS and subjected to ultracentrifugation at 120000 × g for 70 min. The final pellet was resuspended in 500 μl of particle-free PBS. The resuspended pellet was used for SEC, NTA, protein quantification and morphology evaluation by EM.
Figure 5
Figure 5
Protein markers and RNA load of exosomes, purified using UC-SEC. (A) In a representative experiment, 20 μl of fractions 1, 4–19 and 45 were tested by Western blotting with anti-CD81 antibody. NTA was used to count 50–150 nm particles in all SEC fractions, and the particle content of each lane indicated. Uncropped images of 2 blots (9 samples each + Mw markers) are presented. (B) Particle and protein concentrations in 50 fractions of the UC-SEC. The data are the mean ± SEM of 3 independent experiments. (C) Exosomal markers CD9, CD63, CD81 and TSG101 were tested by Western blotting. Shown are the UC pellet subsequently used for SEC, fractions 11 and 26 of the SEC and a pool of all exosome-containing SEC fractions of a representative experiment. One membrane was cut and probed with anti-TSG101 + anti-CD81 (left) or anti-CD63 and anti-CD9 (right), and uncropped images combined. (D) Total RNA isolated from TEU-2 cells, total urine and urinary exosomes from UC-SEC was analysed by NanoChip. Length of detected RNA species is indicated (nt). (E) Pearson correlation between urine contents (chemical composition and total RNA) and uEV parameters (exosome miRNA read count, protein content and particle number). Only Pearson correlations with p-value ≤ 0.05 are shown (blue for positive correlation), the intensity of blue colour corresponding to the degree of correlation. The data are diagnostic values for urine composition and RNA, protein and exosome concentrations of 6 total urine samples, processed by the optimized UC-SEC method.
Figure 6
Figure 6
miRNA profiling in the total urine and uEVs. RNA samples were derived directly from 50 ml of total urine or from uEVs, isolated by UC-SEC from 50 ml of the same urine sample, and miRNAs were profiled using NanoString. (A) Bar chart representing the read count differences between different samples. Read counts are shown in logarithmic scale. The data are sum of all detected miRNA (normalised read counts of 6 paired experiments). (B) Hierarchical clustering and heatmap of 256 miRNAs expressed in the total urine and urinary exosomes isolated from the same sample. Each row represents one miRNA and each column represents one sample. Expression levels are colour-coded (bar above, green for low and red for high levels). (C) Volcano graph showing the log10 fold difference of miRNA content in urinary exosomes compared to total urine. The black dashed line represents the p-value of 0.05. Green dash line shows −1.5 fold lower and red dash line shows 1.5 fold higher content of miRNAs in exosomes compared to total urine. (D) Similarity matrix for total urine and urinary exosome samples. The redder a field is, the more similar the samples are in terms of miRNA expression.
Figure 7
Figure 7
miRNAs present in both the total urine and urinary exosome samples. (A) Venn diagram showing miRNAs stably detected all 6 sample pairs of total urine and urinary exosomes. All 18 miRNAs detected in uEVs are also present in the starting total urine samples. (B) PCR validation for NanoString data of 18 intersecting miRNAs. Heatmap and clustering of shared miRNAs indicate their lower levels in uEVs. (C) Expression levels of 18 common miRNAs detected by NanoString. The high and low abundance of miRNA correlated in total urine samples and urinary exosomes. The differences were statistically significant (p ≤ 0.05).

References

    1. Lu M, et al. An analysis of human microRNA and disease associations. PLoS One. 2008;3:e3420. doi: 10.1371/journal.pone.0003420. - DOI - PMC - PubMed
    1. Wilmott JS, Zhang XD, Hersey P, Scolyer RA. The emerging important role of microRNAs in the pathogenesis, diagnosis and treatment of human cancers. Pathology. 2011;43:657–671. doi: 10.1097/PAT.0b013e32834a7358. - DOI - PubMed
    1. Duan LJ, et al. miR-133 modulates TGF-beta 1-induced bladder smooth muscle cell hypertrophic and fibrotic response: Implication for a role of microRNA in bladder wall remodeling caused by bladder outlet obstruction. Cellular Signalling. 2015;27:215–227. doi: 10.1016/j.cellsig.2014.11.001. - DOI - PubMed
    1. Ekman M, et al. Mir-29 repression in bladder outlet obstruction contributes to matrix remodeling and altered stiffness. PLoS One. 2013;8:e82308. doi: 10.1371/journal.pone.0082308. - DOI - PMC - PubMed
    1. Sadegh, M. K. et al. Detrusor Induction of miR-132/212 following Bladder Outlet Obstruction: Association with MeCP2 Repression and Cell Viability. Plos One10 doi:ARTN e011678410.1371/journal.pone.0116784 (2015). - PMC - PubMed

Publication types