

Change in Populations of Macrophages Promotes Development of Delayed Gastric Emptying in Mice
- PMID: 29501441
- PMCID: PMC5985210
- DOI: 10.1053/j.gastro.2018.02.027
Change in Populations of Macrophages Promotes Development of Delayed Gastric Emptying in Mice
Abstract
Background & aims: Muscularis propria macrophages lie close to cells that regulate gastrointestinal motor function, including interstitial cells of Cajal (ICC) and myenteric neurons. In animal models of diabetic gastroparesis, development of delayed gastric emptying has been associated with loss of macrophages that express cytoprotective markers and reduced networks of ICC. Mice with long-term diabetes and normal gastric emptying have macrophages that express anti-inflammatory markers and have normal gastric ICC. Mice homozygous for the osteopetrosis spontaneous mutation in the colony-stimulating factor 1 gene (Csf1op/op) do not have macrophages; when they are given streptozotocin to induce diabetes, they do not develop delayed gastric emptying. We investigated whether population of the gastric muscularis propria of diabetic Csf1op/op mice with macrophages is necessary to change gastric emptying, ICC, and myenteric neurons and investigated the macrophage-derived factors that determine whether diabetic mice do or do not develop delayed gastric emptying.
Methods: Wild-type and Csf1op/op mice were given streptozotocin to induce diabetes. Some Csf1op/op mice were given daily intraperitoneal injections of CSF1 for 7 weeks; gastric tissues were collected and cellular distributions were analyzed by immunohistochemistry. CD45+, CD11b+, F4/80+ macrophages were dissociated from gastric muscularis propria, isolated by flow cytometry and analyzed by quantitative real-time polymerase chain reaction. Cultured gastric muscularis propria from Csf1op/op mice was exposed to medium that was conditioned by culture with bone marrow-derived macrophages from wild-type mice.
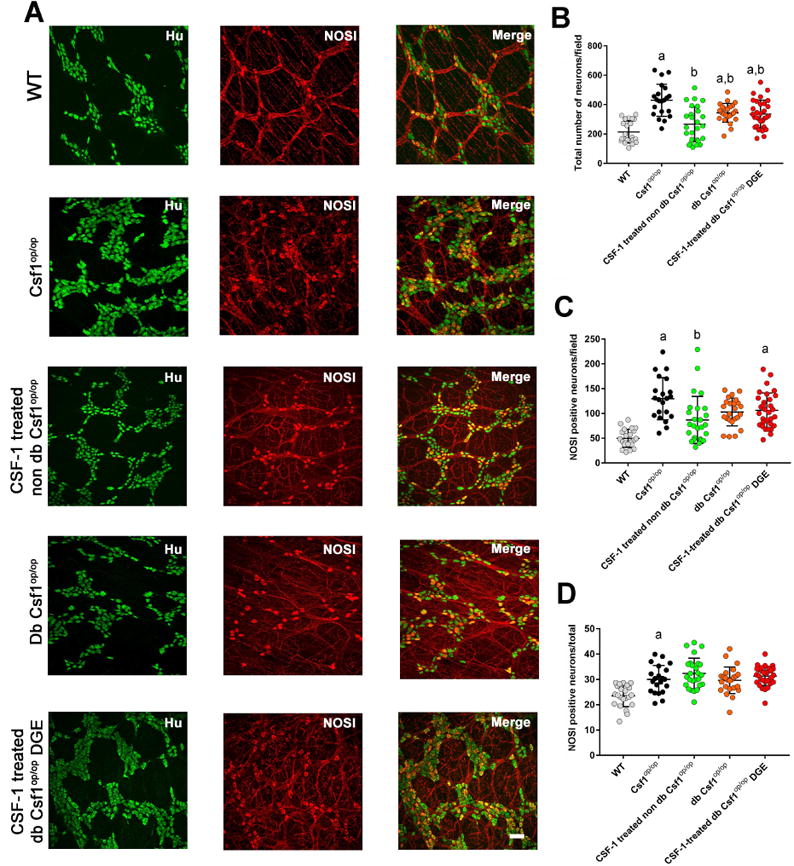
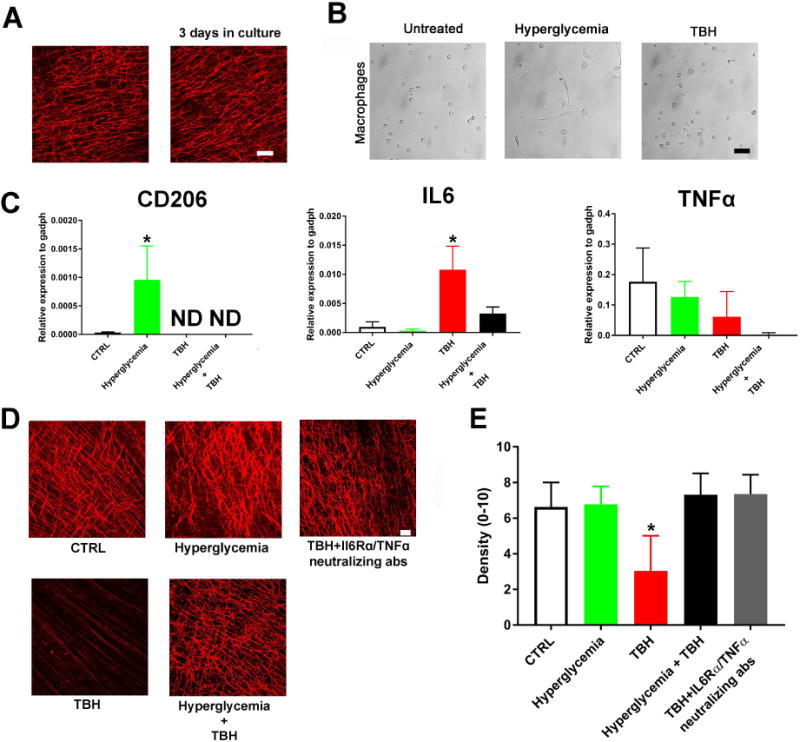
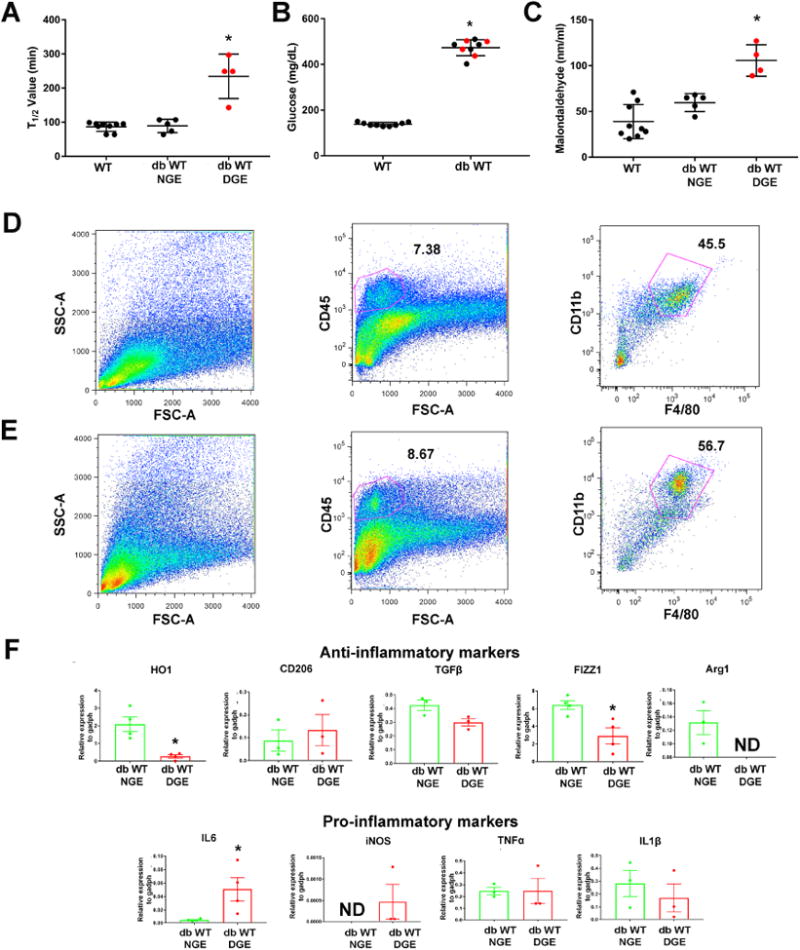
Results: Gastric muscularis propria from Csf1op/op mice given CSF1 contained macrophages; 11 of 15 diabetic mice given CSF1 developed delayed gastric emptying and had damaged ICC. In non-diabetic Csf1op/op mice, administration of CSF1 reduced numbers of gastric myenteric neurons but did not affect the proportion of nitrergic neurons or ICC. In diabetic Csf1op/op mice given CSF1 that developed delayed gastric emptying, the proportion of nitrergic neurons was the same as in non-diabetic wild-type controls. Medium conditioned by macrophages previously exposed to oxidative injury caused damage to ICC in cultured gastric muscularis propria from Csf1op/op mice; neutralizing antibodies against IL6R or TNF prevented this damage to ICC. CD45+, CD11b+, and F4/80+ macrophages isolated from diabetic wild-type mice with delayed gastric emptying expressed higher levels of messenger RNAs encoding inflammatory markers (IL6 and inducible nitric oxide synthase) and lower levels of messenger RNAs encoding markers of anti-inflammatory cells (heme oxygenase 1, arginase 1, and FIZZ1) than macrophages isolated from diabetic mice with normal gastric emptying.
Conclusions: In studies of Csf1op/op and wild-type mice with diabetes, we found delayed gastric emptying to be associated with increased production of inflammatory factors, and reduced production of anti-inflammatory factors, by macrophages, leading to loss of ICC.
Keywords: Cytokine; Gastroparesis; ICC; Immune Response.
Copyright © 2018 AGA Institute. Published by Elsevier Inc. All rights reserved.
Conflict of interest statement
Figures
 and delayed gastric emptying (DGE)
 , age-matched, untreated diabetic
 and non- diabetic Csflop/op (op/op,
 ), controls (WT
 ) and CSF1-treated, non-diabetic Csflop/op
 , diabetic WT with DGE (dbWT DGE,
 ) or NGE (dbWT NGE,
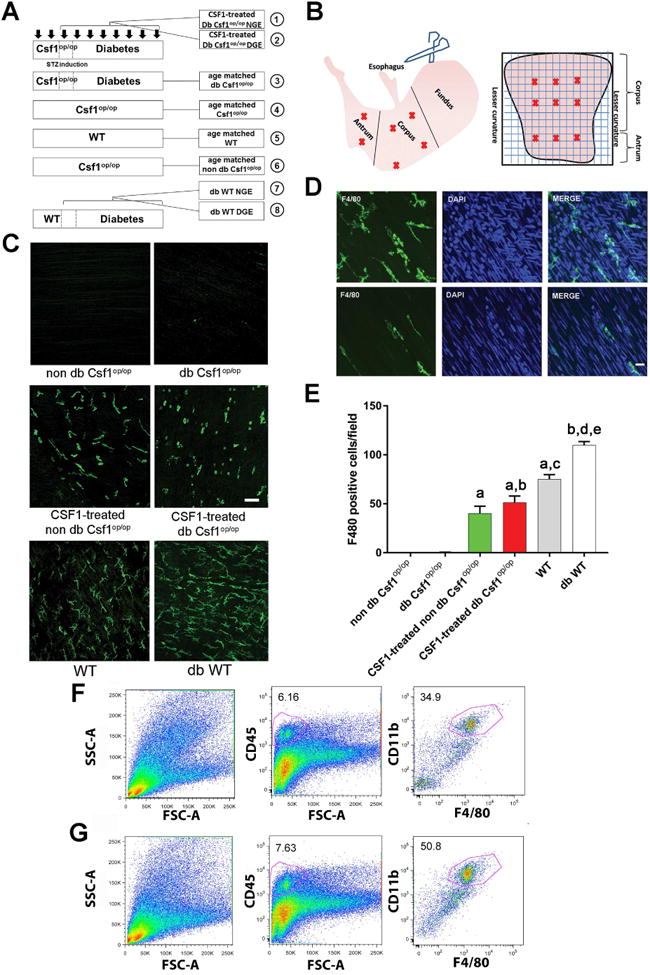
 ). (B) Areas studied for immunohistochemistry. (C) F4/80+ macrophages in the groups of mice. Scale bar: 50μm. (D) F4/80+ macrophages in the gastric circular muscle (lower panels) and myenteric region (upper panels) in CSF1-treated, Csflop/op mice. Scale bar: 25μm. (E) Quantification of macrophages in n=27 fields, N=3 mice. Data are means±SEM. (lway-ANOVA, P<0.05, Significant differences indicated for Tukey post-test comparisons by a vs non- db Csflop/op, b vs dbCsflop/op, c vs CSF1- treated non diabetic Csflop/op, d vs CSF1-treated diabetic Csflop/op, e vs WT). (F) Scatter plots of events from N=3 dissociations from gastric muscularis propria of Csflop/op and (G) WT mice (WT).
Similar articles
-
Diabetic Csf1op/op mice lacking macrophages are protected against the development of delayed gastric emptying.Cell Mol Gastroenterol Hepatol. 2016 Jan 1;2(1):40-47. doi: 10.1016/j.jcmgh.2015.09.001. Cell Mol Gastroenterol Hepatol. 2016. PMID: 26771000 Free PMC article.
-
Macrophages in diabetic gastroparesis--the missing link?Neurogastroenterol Motil. 2015 Jan;27(1):7-18. doi: 10.1111/nmo.12418. Epub 2014 Aug 28. Neurogastroenterol Motil. 2015. PMID: 25168158 Free PMC article. Review.
-
Heme oxygenase-1 protects interstitial cells of Cajal from oxidative stress and reverses diabetic gastroparesis.Gastroenterology. 2008 Dec;135(6):2055-64, 2064.e1-2. doi: 10.1053/j.gastro.2008.09.003. Epub 2008 Sep 11. Gastroenterology. 2008. PMID: 18926825 Free PMC article.
-
CD206-positive M2 macrophages that express heme oxygenase-1 protect against diabetic gastroparesis in mice.Gastroenterology. 2010 Jun;138(7):2399-409, 2409.e1. doi: 10.1053/j.gastro.2010.02.014. Epub 2010 Feb 20. Gastroenterology. 2010. PMID: 20178793 Free PMC article.
-
Histologic changes in diabetic gastroparesis.Gastroenterol Clin North Am. 2015 Mar;44(1):31-8. doi: 10.1016/j.gtc.2014.11.004. Epub 2014 Dec 19. Gastroenterol Clin North Am. 2015. PMID: 25667021 Free PMC article. Review.
Cited by
-
Role of Macrophages and Mast Cells as Key Players in the Maintenance of Gastrointestinal Smooth Muscle Homeostasis and Disease.Cell Mol Gastroenterol Hepatol. 2022;13(6):1849-1862. doi: 10.1016/j.jcmgh.2022.02.017. Epub 2022 Mar 2. Cell Mol Gastroenterol Hepatol. 2022. PMID: 35245688 Free PMC article. Review.
-
Hypoganglionosis in the gastric antrum causes delayed gastric emptying.Neurogastroenterol Motil. 2020 May;32(5):e13766. doi: 10.1111/nmo.13766. Epub 2019 Nov 26. Neurogastroenterol Motil. 2020. PMID: 31773831 Free PMC article.
-
Gut feelings: mechanosensing in the gastrointestinal tract.Nat Rev Gastroenterol Hepatol. 2022 May;19(5):283-296. doi: 10.1038/s41575-021-00561-y. Epub 2022 Jan 12. Nat Rev Gastroenterol Hepatol. 2022. PMID: 35022607 Free PMC article. Review.
-
Reconsideration of the Gastroparetic Syndrome.Curr Gastroenterol Rep. 2023 Apr;25(4):75-90. doi: 10.1007/s11894-023-00865-w. Epub 2023 Apr 1. Curr Gastroenterol Rep. 2023. PMID: 37004633 Review.
-
Intestinal neuron-associated macrophages in health and disease.Nat Immunol. 2025 Jul;26(7):1004-1013. doi: 10.1038/s41590-025-02150-6. Epub 2025 May 21. Nat Immunol. 2025. PMID: 40399608 Review.
References
-
- Farrell FJ, Keeffe EB. Diabetic gastroparesis. Dig Dis. 1995;13:291–300. - PubMed
-
- Talley NJ, Verlinden M, Jones M. Can symptoms discriminate among those with delayed or normal gastric emptying in dysmotility-like dyspepsia? Am J Gastroenterol. 2001;96:1422–8. - PubMed
-
- Vittal H, Farrugia G, Gomez G, et al. Mechanisms of disease: the pathological basis of gastroparesis--a review of experimental and clinical studies. Nat Clin Pract Gastroenterol Hepatol. 2007;4:336–46. - PubMed
Publication types
MeSH terms
Substances
Grants and funding
LinkOut - more resources
Full Text Sources
Other Literature Sources
Research Materials
Miscellaneous
