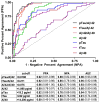
Cerebrospinal fluid biomarkers measured by Elecsys assays compared to amyloid imaging
- PMID: 29501462
- PMCID: PMC6119652
- DOI: 10.1016/j.jalz.2018.01.013
Cerebrospinal fluid biomarkers measured by Elecsys assays compared to amyloid imaging
Abstract
Introduction: Levels of amyloid β peptide 42 (Aβ42), total tau, and phosphorylated tau-181 are well-established cerebrospinal fluid (CSF) biomarkers of Alzheimer's disease, but variability in manual plate-based assays has limited their use. We examined the relationship between CSF biomarkers, as measured by a novel automated immunoassay platform, and amyloid positron emission tomography.
Methods: CSF samples from 200 individuals underwent separate analysis for Aβ42, total tau, and phosphorylated tau-181 with automated Roche Elecsys assays. Aβ40 was measured with a commercial plate-based assay. Positron emission tomography with Pittsburgh Compound B was performed less than 1 year from CSF collection.
Results: Ratios of CSF biomarkers (total tau/Aβ42, phosphorylated tau-181/Aβ42, and Aβ42/Aβ40) best discriminated Pittsburgh Compound B-positive from Pittsburgh Compound B-negative individuals.
Discussion: CSF biomarkers and amyloid positron emission tomography reflect different aspects of Alzheimer's disease brain pathology, and therefore, less-than-perfect correspondence is expected. Automated assays are likely to increase the utility of CSF biomarkers.
Keywords: Alzheimer's disease; Amyloid; Biomarker; Cerebrospinal fluid; Cutoff.
Copyright © 2018 The Authors. Published by Elsevier Inc. All rights reserved.
Figures


Similar articles
-
Concordance Between Different Amyloid Immunoassays and Visual Amyloid Positron Emission Tomographic Assessment.JAMA Neurol. 2017 Dec 1;74(12):1492-1501. doi: 10.1001/jamaneurol.2017.2814. JAMA Neurol. 2017. PMID: 29114726 Free PMC article.
-
Analysis of Cerebrospinal Fluid and [11C]PIB PET Biomarkers for Alzheimer's Disease with Updated Protocols.J Alzheimers Dis. 2016 May 6;52(4):1403-13. doi: 10.3233/JAD-160143. J Alzheimers Dis. 2016. PMID: 27163824
-
Concordance between the updated Elecsys cerebrospinal fluid immunoassays and amyloid positron emission tomography for Alzheimer's disease assessment: findings from the Apollo study.Clin Chem Lab Med. 2025 Mar 13;63(8):1588-1598. doi: 10.1515/cclm-2024-1476. Print 2025 Jul 28. Clin Chem Lab Med. 2025. PMID: 40068924
-
Biomarkers in the Diagnosis and Prognosis of Alzheimer's Disease.J Lab Autom. 2015 Oct;20(5):589-600. doi: 10.1177/2211068214559979. Epub 2014 Nov 25. J Lab Autom. 2015. PMID: 25424384 Review.
-
Clinical validity of cerebrospinal fluid Aβ42, tau, and phospho-tau as biomarkers for Alzheimer's disease in the context of a structured 5-phase development framework.Neurobiol Aging. 2017 Apr;52:196-213. doi: 10.1016/j.neurobiolaging.2016.02.034. Neurobiol Aging. 2017. PMID: 28317649 Review.
Cited by
-
Evaluation of the Serum Dkk-1, Tenascin-C, Oxidative Stress Markers Levels and Wnt Signaling Pathway Genes Expression in Patients with Alzheimer's Disease.J Mol Neurosci. 2021 Apr;71(4):879-887. doi: 10.1007/s12031-020-01710-9. Epub 2020 Sep 15. J Mol Neurosci. 2021. PMID: 32935274
-
Glymphatic system dysfunction predicts amyloid deposition, neurodegeneration, and clinical progression in Alzheimer's disease.Alzheimers Dement. 2024 May;20(5):3251-3269. doi: 10.1002/alz.13789. Epub 2024 Mar 19. Alzheimers Dement. 2024. PMID: 38501315 Free PMC article.
-
Midpoint of sleep is associated with sleep quality in older adults with and without symptomatic Alzheimer's disease.Sleep Adv. 2024 Apr 15;5(1):zpae023. doi: 10.1093/sleepadvances/zpae023. eCollection 2024. Sleep Adv. 2024. PMID: 38711547 Free PMC article.
-
Neuropsychiatric Symptoms and Alzheimer Disease Biomarkers Independently Predict Progression to Incident Cognitive Impairment.Am J Geriatr Psychiatry. 2023 Dec;31(12):1190-1199. doi: 10.1016/j.jagp.2023.07.012. Epub 2023 Jul 26. Am J Geriatr Psychiatry. 2023. PMID: 37544835 Free PMC article.
-
Exploratory Dual PET imaging of [18F] fluorodeoxyglucose and [11C]acetoacetate in type 2 diabetic nonhuman primates.Bioorg Med Chem Lett. 2024 Oct 1;111:129906. doi: 10.1016/j.bmcl.2024.129906. Epub 2024 Jul 25. Bioorg Med Chem Lett. 2024. PMID: 39059565
References
-
- Price JL, Morris JC. Tangles and plaques in nondemented aging and “preclinical” Alzheimer’s disease. Annals of neurology. 1999;45:358–68. - PubMed
-
- Fagan AM, Mintun MA, Mach RH, Lee SY, Dence CS, Shah AR, et al. Inverse relation between in vivo amyloid imaging load and cerebrospinal fluid Abeta42 in humans. Annals of neurology. 2006;59:512–9. - PubMed
Publication types
MeSH terms
Substances
Grants and funding
- U01 AG032438/AG/NIA NIH HHS/United States
- R01 AG034119/AG/NIA NIH HHS/United States
- K01 AG053474/AG/NIA NIH HHS/United States
- RF1 AG053550/AG/NIA NIH HHS/United States
- P01 AG003991/AG/NIA NIH HHS/United States
- P50 AG005681/AG/NIA NIH HHS/United States
- P01 AG026276/AG/NIA NIH HHS/United States
- K23 AG053426/AG/NIA NIH HHS/United States
- R01 EB009352/EB/NIBIB NIH HHS/United States
- P30 NS098577/NS/NINDS NIH HHS/United States
- R03 AG050921/AG/NIA NIH HHS/United States
- UL1 TR000448/TR/NCATS NIH HHS/United States
- UL1 TR002345/TR/NCATS NIH HHS/United States
- KL2 TR000450/TR/NCATS NIH HHS/United States
LinkOut - more resources
Full Text Sources
Other Literature Sources
Medical

