. 2018 Jun:66:12-22.
doi: 10.1016/j.neurobiolaging.2018.02.003. Epub 2018 Feb 10.

Levodopa improves response inhibition and enhances striatal activation in early-stage Parkinson's disease

Affiliations

Levodopa improves response inhibition and enhances striatal activation in early-stage Parkinson's disease

Peter Manza et al. Neurobiol Aging. 2018 Jun.

Abstract

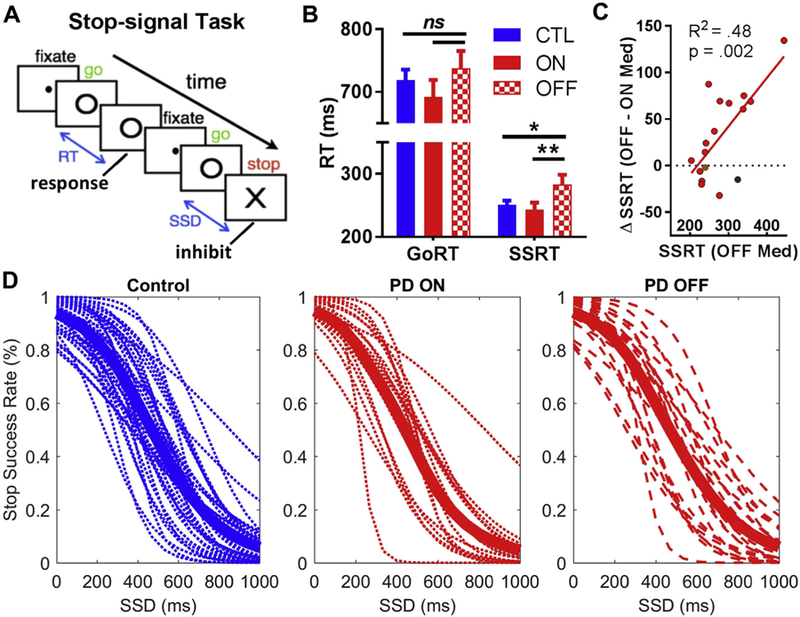
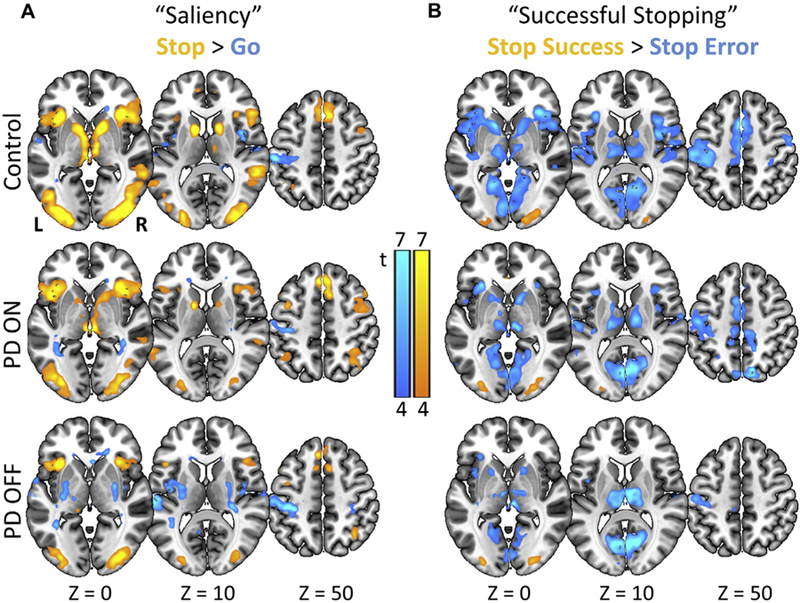
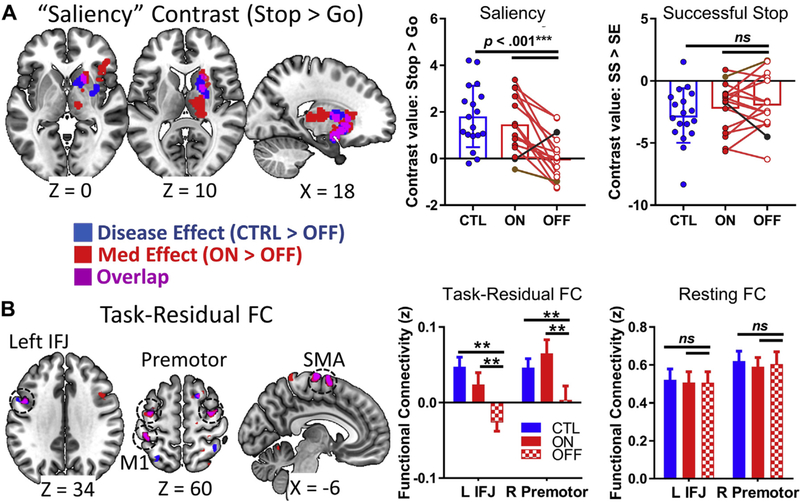
Dopaminergic medications improve the motor symptoms of Parkinson's disease (PD), but their effect on response inhibition, a critical executive function, remains unclear. Previous studies primarily enrolled patients in more advanced stages of PD, when dopaminergic medication loses efficacy, and patients were typically on multiple medications. Here, we recruited 21 patients in early-stage PD on levodopa monotherapy and 37 age-matched controls to perform the stop-signal task during functional magnetic resonance imaging. In contrast to previous studies reporting null effects in more advanced PD, levodopa significantly improved response inhibition performance in our sample. No significant group differences were found in brain activations to pure motor inhibition or error processing (stop success vs. error trials). However, relative to controls, the PD group showed weaker striatal activations to salient events (infrequent vs. frequent events: stop vs. go trials) and fronto-striatal task-residual functional connectivity; both were restored with levodopa. Thus, levodopa appears to improve an important executive function in early-stage PD via enhanced salient signal processing, shedding new light on the role of dopaminergic signaling in response inhibition.

Keywords: Basal ganglia; Cognitive control; Dopamine; Executive function; Movement disorders; Stop-signal task.


Conflict of interest statement

Disclosure statement

The authors thank the Stony Brook Research Foundation for providing funds for participant stipend payment. The study is also supported by grant BCS1309260 (C-sRL) from the National Science Foundation. The authors have no competing interests to disclose.

Figures

Fig. 1.
Fig. 1.
Stop-signal task and behavioral results. (A) A go stimulus “O” appears on each trial, and on 25% of the trials, a stop signal “X” appears shortly after the go signal to instruct participants to withhold the planned response. The SSD, or the time between the go stimulus and the stop signal on a stop trial, is varied based on a staircase procedure. (B) Response time measures on the stop-signal task for all participants. Participants with PD showed significantly longer SSRT in their “off” state (red hatch) compared to their “on” state (red) and the control group (blue), indicating a response inhibition deficit, whereas differences in GoRT were not significant. (C) Greater benefits in response inhibition (i.e., reduction in SSRT from “off” to “on” status) were positively correlated with SSRT “off” medication. The individual with self-reported depression (brown dot) and the individual with low go accuracy (black dot) are shown. (D) Inhibition function for each group, demonstrating that all 3 groups did not violate the basic assumption of the “race model”: as the SSD increases, stop success rate decreases or error rate increases. The thick line in each plot represents the group mean. Note: *, p < 0.05; **, p < 0.01; ns, not significant. Error bars indicate standard error of the mean. Abbreviations: GoRT, go reaction time; PD, Parkinson’s disease; SSD, stop-signal delay; SSRT, stop-signal reaction time. (For interpretation of the references to color in this figure legend, the reader is referred to the Web version of this article.)
Fig. 2.
Fig. 2.
Functional magnetic resonance imaging results: 1-sample t-tests showing SST activations for each group. (A) Activations to “saliency” or all stop > go trials (i.e., infrequent stimuli compared to frequent stimuli). (B) Activations to “successful stopping” or stop success > stop error trials. Maps are thresholded at 4 > t > 7 (where brighter colors indicate higher values), for visualization. (For interpretation of the references to color in this figure legend, the reader is referred to the Web version of this article.)
Fig. 3.
Fig. 3.
Functional magnetic resonance imaging results: Group differences for SST contrasts and functional connectivity (FC), showing disease effects (controls > PD “off”, shown in blue), medication effects (PD “on” > PD “off”, shown in red), and their overlap (shown in purple). (A) Left: Significant disease and medication effects are shown in the thalamus, striatum, and right insula/inferior frontal gyrus for the saliency contrast, including an overlapping region in the right striatum (purple). Right: Post hoc analysis showing that the PD group had lower right striatum saliency-related activations than when on levodopa or compared to controls; however, there were no consistent group differences in this region between successful versus failed stopping. The individual with self-reported depression (brown dot) and the individual with low go accuracy (black dot) are indicated. (B) Left: In exploratory task-residual functional connectivity analysis using the right striatum region from part (A) as a seed region, there were overlapping disease and medication effects in L IFJ, M1, SMA, and bilateral premotor cortices. Right: Post hoc analysis for 2 example regions (L IFJ and R premotor) showing group differences in task-residual functional connectivity, but not resting-state functional connectivity. Task contrast results have a cluster-forming threshold of p < 0.005, with a nonparametric p < 0.05 FWE cluster correction, using SnPM13. Functional connectivity results were not significant at this nonparametric cluster-level threshold, and so only the conjunction is analyzed at an exploratory threshold of p < 0.0025 uncorrected, with a minimum cluster size k > 20. **p < 0.01; ***p < 0.001. Abbreviations: CTL, control; FWE, family-wise error; IFG, inferior frontal junction; L, left; M1, primary motor cortex; PD, Parkinson’s disease; R, right; SMA, supplementary motor area. (For interpretation of the references to color in this figure legend, the reader is referred to the Web version of this article.)

Similar articles

Cited by

References

    1. Alavash M, Hilgetag CC, Thiel CM, Gießing C, 2015. Persistency and flexibility of complex brain networks underlie dual-task interference. Hum. Brain Mapp 36, 3542–3562. - PMC - PubMed
    1. Albrecht DS, Kareken DA, Christian BT, Dzemidzic M, Yoder KK, 2014. Cortical dopamine release during a behavioral response inhibition task. Synapse 68, 266–274. - PMC - PubMed
    1. Alegre M, Lopez-Azcarate J, Obeso I, Wilkinson L, Rodriguez-Oroz MC, Valencia M, Garcia-Garcia D, Guridi J, Artieda J, Jahanshahi M, Obeso JA, 2013. The subthalamic nucleus is involved in successful inhibition in the stop-signal task: a local field potential study in Parkinson’s disease. Exp. Neurol 239, 1–12. - PubMed
    1. Andersson JLR, Skare S, Ashburner J, 2003. How to correct susceptibility distortions in spin-echo echo-planar images: application to diffusion tensor imaging. NeuroImage 20, 870–888. - PubMed
    1. Band GPH, van der Molen MW, Logan GD, 2003. Horse-race model simulations of the stop-signal procedure. Acta Psychologica 112, 105–142. - PubMed

Publication types

MeSH terms