. 2018 Jun:16:146-156.
doi: 10.1016/j.redox.2018.02.021. Epub 2018 Mar 1.

Cardiomyocyte hypertrophy induced by Endonuclease G deficiency requires reactive oxygen radicals accumulation and is inhibitable by the micropeptide humanin

Affiliations

Cardiomyocyte hypertrophy induced by Endonuclease G deficiency requires reactive oxygen radicals accumulation and is inhibitable by the micropeptide humanin

Natividad Blasco et al. Redox Biol. 2018 Jun.

Abstract

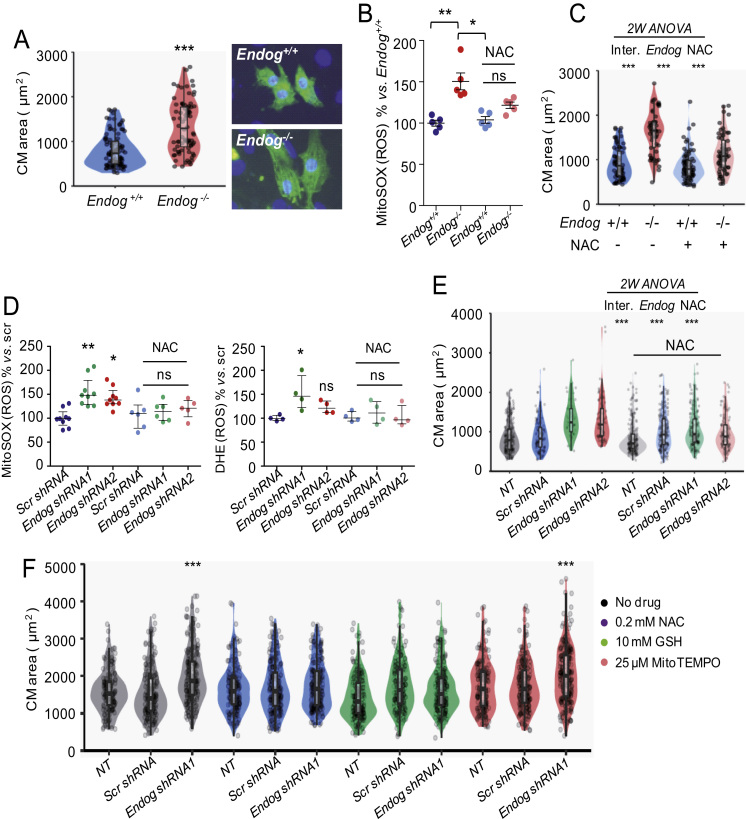
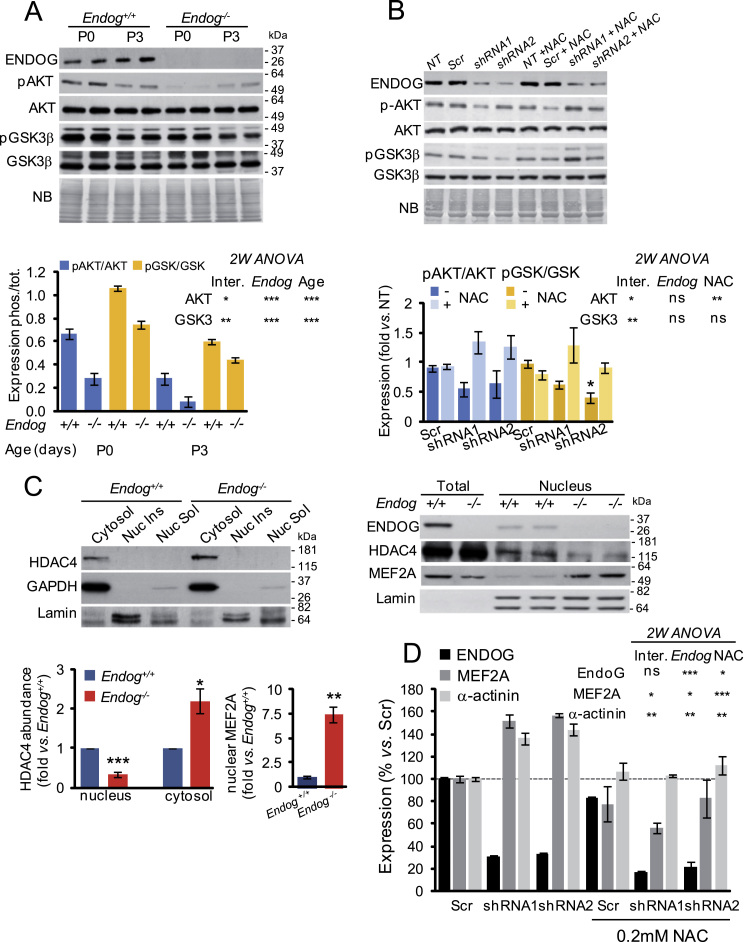
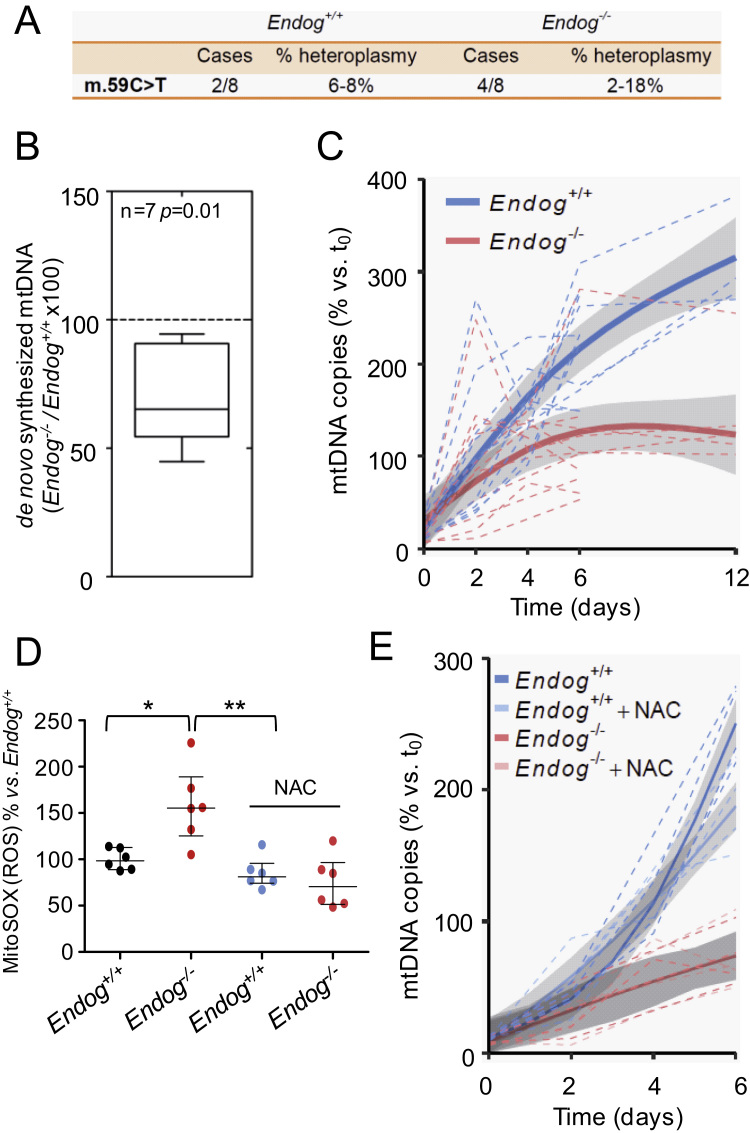
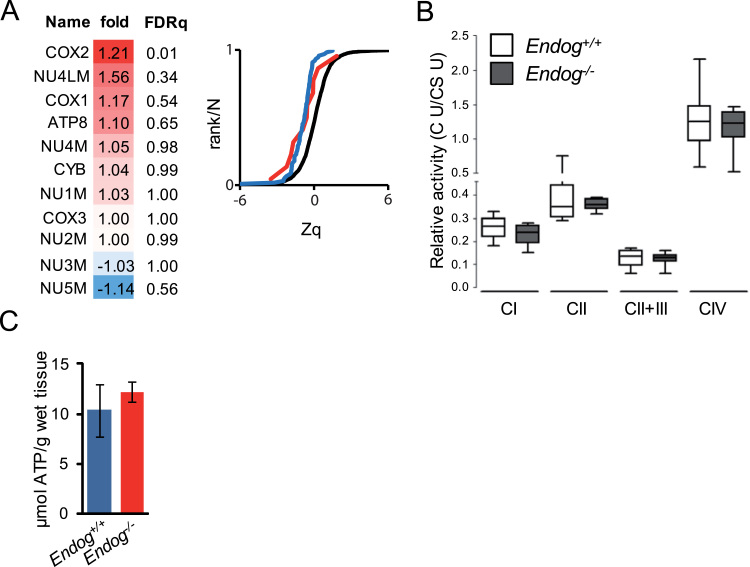
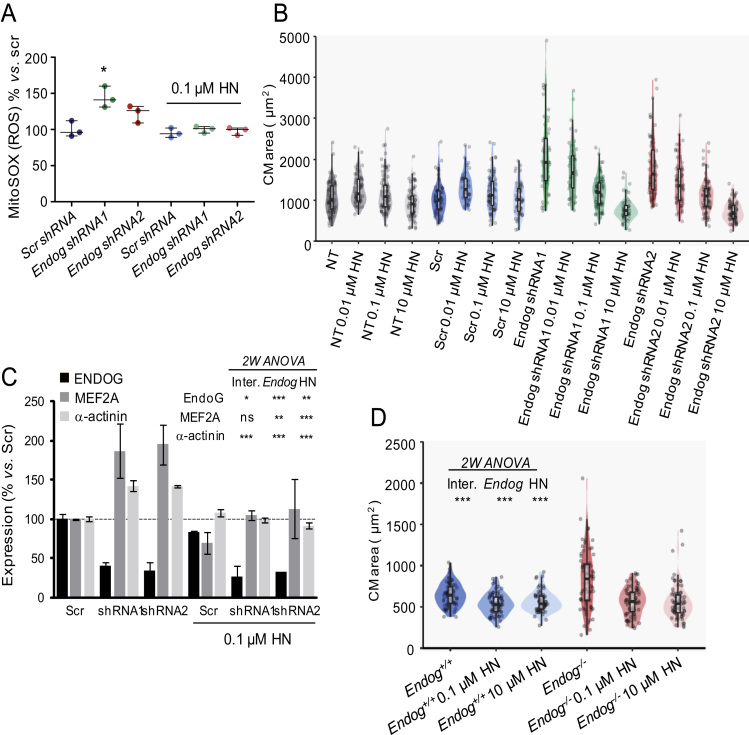
The endonuclease G gene (Endog), which codes for a mitochondrial nuclease, was identified as a determinant of cardiac hypertrophy. How ENDOG controls cardiomyocyte growth is still unknown. Thus, we aimed at finding the link between ENDOG activity and cardiomyocyte growth. Endog deficiency induced reactive oxygen species (ROS) accumulation and abnormal growth in neonatal rodent cardiomyocytes, altering the AKT-GSK3β and Class-II histone deacethylases (HDAC) signal transduction pathways. These effects were blocked by ROS scavengers. Lack of ENDOG reduced mitochondrial DNA (mtDNA) replication independently of ROS accumulation. Because mtDNA encodes several subunits of the mitochondrial electron transport chain, whose activity is an important source of cellular ROS, we investigated whether Endog deficiency compromised the expression and activity of the respiratory chain complexes but found no changes in these parameters nor in ATP content. MtDNA also codes for humanin, a micropeptide with possible metabolic functions. Nanomolar concentrations of synthetic humanin restored normal ROS levels and cell size in Endog-deficient cardiomyocytes. These results support the involvement of redox signaling in the control of cardiomyocyte growth by ENDOG and suggest a pathway relating mtDNA content to the regulation of cell growth probably involving humanin, which prevents reactive oxygen radicals accumulation and hypertrophy induced by Endog deficiency.

Keywords: ENDOG; cardiac hypertrophy; humanin; mitochondrial DNA.


Figures

Fig. 1
Fig. 1
ENDOG deficiency induces hypertrophy and ROS accumulation in neonatal cardiomyocytes that can be prevented by ROS scavengers. (A) Violin plots showing areas of mouse cardiomyocytes (CM) isolated from 8–10 P2–3 neonatal Endog+/+ and Endog-/- pups seeded, fixed and stained with anti-α-actinin (sarcomere, green) and Hoescht 33342 stain (nucleus, blue). Cell area was quantified with the ImageJ software as described in the Materials and Methods section in at least 100 cardiomyocytes per genotype obtained in three independent experiments; *** P<0.001 (Mann-Whitney U test). Points are individual data. Standard boxplot is also included. Representative images are shown on the right. (B) ROS abundance was detected with the MitoSOXTM mitochondrial superoxide indicator in five independent CM cultures of P2–3 neonatal Endog+/+ and Endog-/- mice cultured 48 hours in the presence or absence of 0.2 mM NAC and calculated as indicated in the M&M section. Medians ± interquartile ranges are shown. The Kruskall-Willis test (P<0.01) followed by the Dunn's test were performed. **, P<0.01 vs. Endog+/+; *, P<0.05 vs. NAC, ns = not significant differences vs. Endog+/+. (C) CM areas were measured as in (A) for each of the treatments described in (B); Two-way ANOVA indicated ***, P<0.001 for interaction, Endog expression and NAC treatment. Points are individual data. (D) MitoSOXTM and DHE signals in neonatal rat cardiomyocytes transduced with two different Endog shRNA or scrambled (Scr shRNA) lentiviral vectors and cultured 48 hours in the absence or presence of 0.2 mM NAC. Medians ± interquartile ranges are shown. The Kruskall-Wallis test (P<0.001) followed by the Dunn's test were performed. *, P<0.05; **, P<0.01, ns = not significant differences vs. Scr. N=5–8 (MitoSOX) and N=5 (DHE) independent experiments. (E) Rat neonatal CM areas were measured as in (A) from 3 independent experiments (at least 100 CM/condition) in non-transduced cultures (NT) or cultures transduced with two different Endog shRNA or scrambled (Scr shRNA) lentiviral vectors and cultured 48 hours in the absence or presence of 0.2 mM NAC; Two-way ANOVA indicated ***, P<0.001 for interaction, Endog expression and NAC treatment. Points are individual data. (F) Cross-sectional cardiomyocyte areas were measured as in (A) after treatment of non-transduced (NT), Scr or Endog shRNA-transduced cultures in absence or presence of the ROS scavengers NAC, GSH or MitoTEMPO for 48 hours. Between 150 and 200 areas were recorded per condition and shown in the violin plot, which includes a standard boxplot. The Dunnett's post hoc test comparing all conditions against NT indicated significant differences of Endog shRNA1 without ROS scavenger and with MitoTEMPO. ***, P<0.001. Additional two-way ANOVA showed same results, with significant interaction (P<0.001).
Fig. 2
Fig. 2
Lack of ENDOG induces downregulation of the AKT-GSK3β transduction signaling due to ROS accumulation and promotes the release MEF2 activity through nuclear export of HDAC4. (A) Expression of ENDOG, phospho-AKT Ser473 (pAKT), total AKT (AKT), phospho-GSK3β Ser21/9 (pGSK3β) and total GSK3β (GSK3β) in neonatal Endog+/+ and Endog-/- mice hearts by Western Blot. Representative Western blots with equal loading verified by naphtol blue (NB) membrane staining are shown in the upper panel. Quantitative analysis of densitometric data is shown in the graph. Bars depict means ± standard errors of the phosphorylated/total expression quotients from three independent experiments. Two-way ANOVA indicated that Endog expression and age influenced the ratios of pAKT/AKT and pGSK3/GSK3 *, P<0.05; **, P<0.01; ***, P<0.001.Inter: Interaction between both variables in the experimental value. (B) Analysis of the effect of NAC treatment (0.2 mM) on the phosphorylation of AKT and GSK3β in primary neonatal rat cardiomyocytes transduced with lentiviral vectors containing Endog shRNA or a scrambled sequence (Scr) or not transduced (NT). Expression was checked by Western Blot (upper panel) and equal loading was verified by membrane staining with naphtol blue (NB). Due to important inter-experiment signal differences, densitometric data were normalized dividing the values by the mean of the Scrambled signal and represented as means ± standard errors of three independent experiments (bar graph). Two-way ANOVA indicated whether Endog expression and NAC influenced the ratios of pAKT/AKT and pGSK3/GSK3. (C) Subcellular distribution of HDAC4 and MEF2A in primary mouse cardiomyocytes from neonatal Endog+/+ and Endog-/- hearts. Fractions were analyzed by Western Blot to detect HDAC4 and MEF2A in cytosolic (left panel) and nuclear fractions (right panel), using GAPDH as a cytosolic marker and Lamin as a nuclear marker to control fractionation. Quantification of HDAC4 and MEF2A Western Blot signals are shown in the graphs. Bars depict means ± standard errors of two independent experiments (8–10 hearts / condition / experiment). The Mann-Whitney U test indicated significant differences between groups *, P<0.05; **, P<0.01; ***P<0.001. Nuc Ins: nuclear insoluble fraction (membranes); Nuc Sol: nuclear soluble fraction. (D) Densitometric quantification of ENDOG, MEF2A and α-actinin expression in rat neonatal cardiomyocytes not transduced (NT), transduced with a scrambled construct (Scr) or transduced with Endog-specific shRNA1 and 2 viruses; in the absence or presence of 0.2 mM NAC. Bars are means ± standard errors of densitometric values related to their respective Scr signal. Two-way ANOVA indicated whether Endog silencing and NAC influenced the expression of ENDOG, MEF2A and α-actinin. *, P<0.05; **, P<0.01; ***, P<0.001; ns: not significant.
Fig. 3
Fig. 3
EndoG deficiency has no effect on mtDNA stability but hinders mtDNA synthesis independently of ROS accumulation. (A) Sequencing of mitochondrial DNA extracted from hearts of Endog+/+ and Endog-/- neonatal mice did not show any nucleotide variant associated to the Endog genotype. A single mutation (59 C>T) was detected in heteroplasmy (% frequency vs. reference sequence) within the Phe tRNA (MT-TF) gene in 2 Endog+/+ and 4 Endog-/- mice; N=8 per genotype, ns: not statistically significant differences. (B) Incorporation of dTTP-3H in mtDNA was quantified simultaneously in isolated Endog+/+ and Endog-/- cardiac mitochondria preparations; N=7. Non-parametric sign test for paired observations indicated significant differences due to genotype, P=0.01. (C) MtDNA of MEF from Endog+/+ and Endog-/- mice was depleted with EtBr (25 ng/ml) in order to reach minimum similar levels in both genotypes. Removal of the drug from the culture medium (day 0) allowed recovery of mtDNA content and the mtDNA copy number was determined in Endog+/+ and Endog-/- MEF at the indicated time intervals. The relative mtDNA copy number was quantitated and analyzed as described in the Materials and Methods section. N=5 per genotype. (D) Mitochondrial ROS abundance was quantified using the MitoSOXTM mitochondrial superoxide indicator in Endog+/+ and Endog-/- fibroblasts cultured in the absence or presence of ROS scavenger NAC (0.2 mM). Due to important inter-experiment basal signal oscillations, data were normalized divinding by the Endog+/+ mean before statistical treatment. The Kruskall-Wallis test (P=0.03) was followed by the Dunn's test for pair wise comparisons; *, P<0.05 vs. Endog+/+; **, P<0.01 vs. Endog+/++NAC. Medians ± interquartile ranges are shown. N=6. (E) MtDNA copy number recovery was analyzed in the presence of ROS scavenger NAC. After removal of BrEt (day 0), Endog+/+ and Endog-/- MEF were divided into two groups during one week recovery period. In both genotypes, one group was cultured in a medium with NAC (0.2 mM) and the other group served as control without NAC. At the indicated time intervals, the relative mtDNA copy number was determined in cells from each group as in Fig. 3.C. N=5 per genotype.
Fig. 4
Fig. 4
Mitochondrial respiratory chain expression and activity is not affected by ENDOG deficiency.(A) Left, relative abundance profiles of mitochondria-encoded components of the Electron transport chain in both Endog+/+ and Endog-/- in cardiac mitochondria extracts (FDRq, false discovery rate quotient, significant difference FDRq<0.01). Right graph, sigmoid plot showing the cumulative distributions of log2-ratios in units of the standard deviation at each level (Zq, protein to grand mean variability) (Endog-/- / Endog+/+) of proteins belonging to all oxidative phosphorylation complexes in Endog-/- (red line) and in Endog+/+ (blue line) and the null hypothesis distribution (black line), where a trend to the left would denote increased abundance and a trend to the right would indicate lower abundance vs. the null hypothesis. (B) Complex I, complex II, complex II+III, complex IV and citrate synthase (CS) activities were determined in heart mitochondria extracts from Endog+/+ and Endog-/- mice and expressed as relative activity (specific respiratory chain complex activity / citrate synthase activity), see Materials and Methods section for procedure and statistics. N=5. (C) ATP content of Endog+/+ and Endog-/- mouse hearts. N=3. The Mann-Whitney U test showed no significant differences.
Fig. 5
Fig. 5
The micropeptide humanin reverses the effects on ROS abundance and hypertrophy induced by Endog deficiency. (A) ROS abundance was quantified in neonatal rat cardiomyocytes transduced with lentiviral vectors containing Endog shRNA1 or 2 to silence Endog expression, or a scrambled sequence (Scr) and cultured 48 h in the absence or presence of 0.01 µM humanin (HN). Due to important inter-experiment basal signal oscillations, data were normalized dividing by the Scr mean before statistical treatment. Medians ± interquartile ranges of 3 independent experiments are shown. The Kruskall-Wallis test (P=0.039) was followed by the Dunn's test for pair wise comparisons; *, P<0.05 vs. Scr.(B) Rat neonatal cardiomyocyte cross-sectional areas from non-transduced (NT), Scr or Endog shRNA-transduced cultures in the absence or the presence (48 hours) of HN (0.01, 0.1 or 10 µM), and immunostained with anti-α-actinin. Cell areas were quantified with the ImageJ software in at least 100 cardiomyocytes per genotype from 3 independent experiments (5–8 hearts/experiment). Statistical analysis was performed with a linear regression model with interaction. Adjusted means and 95% confidence intervals are shown in Fig.S3, which indicated significant effects of Endog expression, HN and their interaction on cell size (P<0.001). (C) Expression of muscle-specific factors MEF2A and α-actinin were analyzed by Western Blot in non-transduced (NT), scrambled-transduced (Scr) or Endog shRNA1 (1) or Endog shRNA2 (2) transduced cardiomyocytes, in the absence or presence of 0.1 µM humanin (HN). Bars are means ± standard errors of densitometric values related to their respective Scr signal. Two-way ANOVA indicated whether Endog silencing and HN influenced the expression of ENDOG, MEF2A and α-actinin. *, P<0.05; **, P<0.01; ***, P<0.001; ns: not significant. (D) Effects of 0.1 µM and 10 µM humanin (HN) treatment during 48 hours in the cross-sectional area of cultured cardiomyocytes of Endog+/+ and Endog-/- neonatal mice. Two-way ANOVA indicated ***, P<0.001 for interaction, Endog expression and HN treatment on cell size. Points are individual data.

Similar articles

Cited by

References

    1. McDermott-Roe C. Endonuclease G is a novel determinant of cardiac hypertrophy and mitochondrial function. Nature. 2011;478:114–118. - PMC - PubMed
    1. Hafstad A.D., Nabeebaccus A.A., Shah A.M. Novel aspects of ROS signalling in heart failure. Basic Res Cardiol. 2013;108:359. - PubMed
    1. Rizzi E. β1-Adrenergic blockers exert antioxidant effects, reduce matrix metalloproteinase activity, and improve renovascular hypertension-induced cardiac hypertrophy. Free Radic Biol Med. 2014;73:308–317. - PubMed
    1. Kwon S.H., Pimentel D.R., Remondino A., Sawyer D.B., Colucci W.S. H(2)O(2) regulates cardiac myocyte phenotype via concentration-dependent activation of distinct kinase pathways. J Mol Cell Cardiol. 2003;35:615–621. - PubMed
    1. Wang H.X. NADPH oxidases mediate a cellular "memory" of angiotensin II stress in hypertensive cardiac hypertrophy. Free Radic Biol Med. 2013;65:897–907. - PubMed

Publication types

MeSH terms

LinkOut - more resources