

Mapping the burden of cholera in sub-Saharan Africa and implications for control: an analysis of data across geographical scales
- PMID: 29502905
- PMCID: PMC5946088
- DOI: 10.1016/S0140-6736(17)33050-7
Mapping the burden of cholera in sub-Saharan Africa and implications for control: an analysis of data across geographical scales
Abstract
Background: Cholera remains a persistent health problem in sub-Saharan Africa and worldwide. Cholera can be controlled through appropriate water and sanitation, or by oral cholera vaccination, which provides transient (∼3 years) protection, although vaccine supplies remain scarce. We aimed to map cholera burden in sub-Saharan Africa and assess how geographical targeting could lead to more efficient interventions.
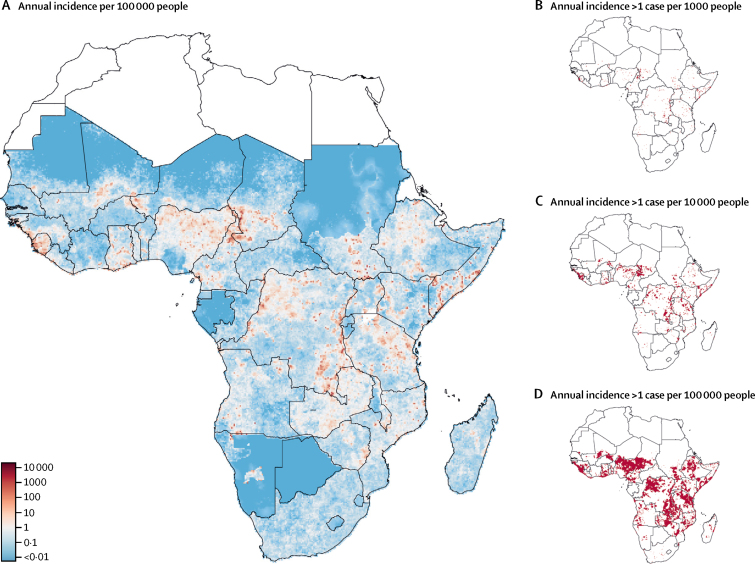
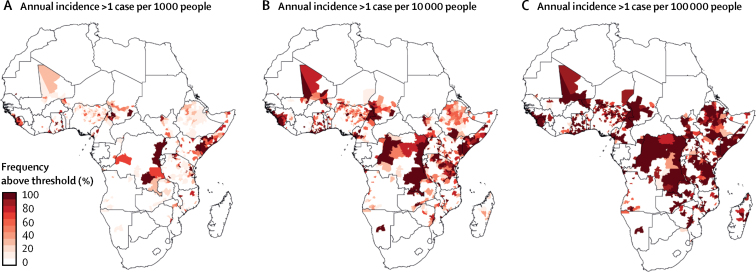
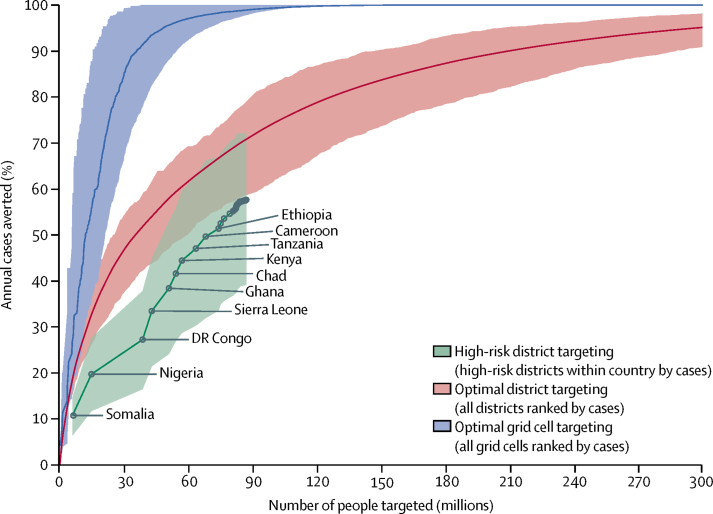
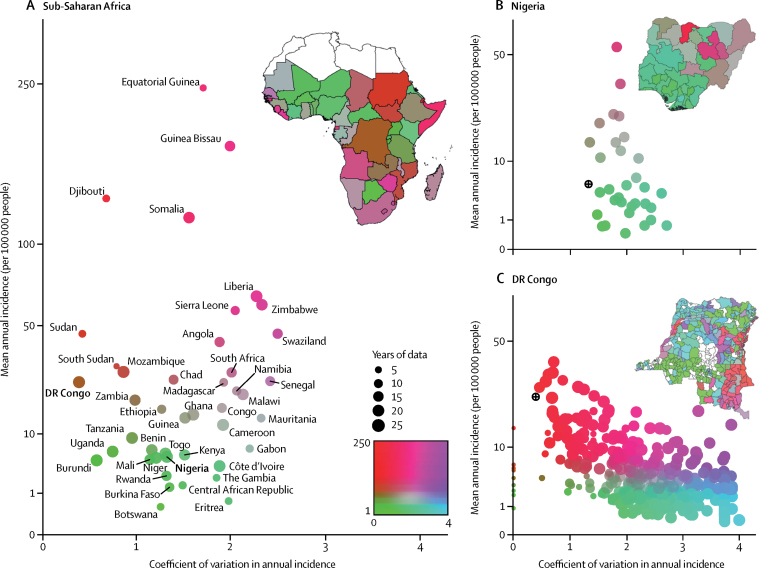
Methods: We combined information on cholera incidence in sub-Saharan Africa (excluding Djibouti and Eritrea) from 2010 to 2016 from datasets from WHO, Médecins Sans Frontières, ProMED, ReliefWeb, ministries of health, and the scientific literature. We divided the study region into 20 km × 20 km grid cells and modelled annual cholera incidence in each grid cell assuming a Poisson process adjusted for covariates and spatially correlated random effects. We combined these findings with data on population distribution to estimate the number of people living in areas of high cholera incidence (>1 case per 1000 people per year). We further estimated the reduction in cholera incidence that could be achieved by targeting cholera prevention and control interventions at areas of high cholera incidence.
Findings: We included 279 datasets covering 2283 locations in our analyses. In sub-Saharan Africa (excluding Djibouti and Eritrea), a mean of 141 918 cholera cases (95% credible interval [CrI] 141 538-146 505) were reported per year. 4·0% (95% CrI 1·7-16·8) of districts, home to 87·2 million people (95% CrI 60·3 million to 118·9 million), have high cholera incidence. By focusing on the highest incidence districts first, effective targeted interventions could eliminate 50% of the region's cholera by covering 35·3 million people (95% CrI 26·3 million to 62·0 million), which is less than 4% of the total population.
Interpretation: Although cholera occurs throughout sub-Saharan Africa, its highest incidence is concentrated in a small proportion of the continent. Prioritising high-risk areas could substantially increase the efficiency of cholera control programmes.
Funding: The Bill & Melinda Gates Foundation.
Copyright © 2018 The Author(s). Published by Elsevier Ltd. This is an Open Access article under the CC BY 4.0 license. Published by Elsevier Ltd.. All rights reserved.
Figures
Comment in
-
Taking aim at cholera.Lancet. 2018 May 12;391(10133):1868-1870. doi: 10.1016/S0140-6736(18)30543-9. Epub 2018 Mar 1. Lancet. 2018. PMID: 29502906 No abstract available.
References
-
- Echenberg M. Cambridge University Press; New York, NY: 2011. Africa in the time of cholera: a history of pandemics from 1817 to the present.
-
- Bhattacharya S, Black R, Bourgeois L. Public health. The cholera crisis in Africa. Science. 2009;324:885. - PubMed
-
- WHO Global Health Observatory data repository. By category. Number of reported deaths, data by country. http://apps.who.int/gho/data/node.main.176?lang=en (accessed Sept 11, 2017).
-
- WHO Global health observatory (GHO) data. Number of reported cholera cases. http://www.who.int/gho/epidemic_diseases/cholera/cases_text/en/ (accessed Jan 15, 2018).
-
- Global Task Force on Cholera Control Ending cholera: a global roadmap to 2030. http://www.who.int/cholera/publications/global-roadmap/en/ (accessed Nov 1, 2017).
MeSH terms
Grants and funding
LinkOut - more resources
Full Text Sources
Other Literature Sources
Medical
