. 2018 Mar 12;33(3):527-541.e8.
doi: 10.1016/j.ccell.2018.01.018. Epub 2018 Mar 1.

The SS18-SSX Oncoprotein Hijacks KDM2B-PRC1.1 to Drive Synovial Sarcoma

Affiliations

The SS18-SSX Oncoprotein Hijacks KDM2B-PRC1.1 to Drive Synovial Sarcoma

Ana Banito et al. Cancer Cell. .

Erratum in

  • The SS18-SSX Oncoprotein Hijacks KDM2B-PRC1.1 to Drive Synovial Sarcoma.
    Banito A, Li X, Laporte AN, Roe JS, Sanchez-Vega F, Huang CH, Dancsok AR, Hatzi K, Chen CC, Tschaharganeh DF, Chandwani R, Tasdemir N, Jones KB, Capecchi MR, Vakoc CR, Schultz N, Ladanyi M, Nielsen TO, Lowe SW. Banito A, et al. Cancer Cell. 2018 Aug 13;34(2):346-348. doi: 10.1016/j.ccell.2018.07.006. Cancer Cell. 2018. PMID: 30107180 Free PMC article. No abstract available.

Abstract

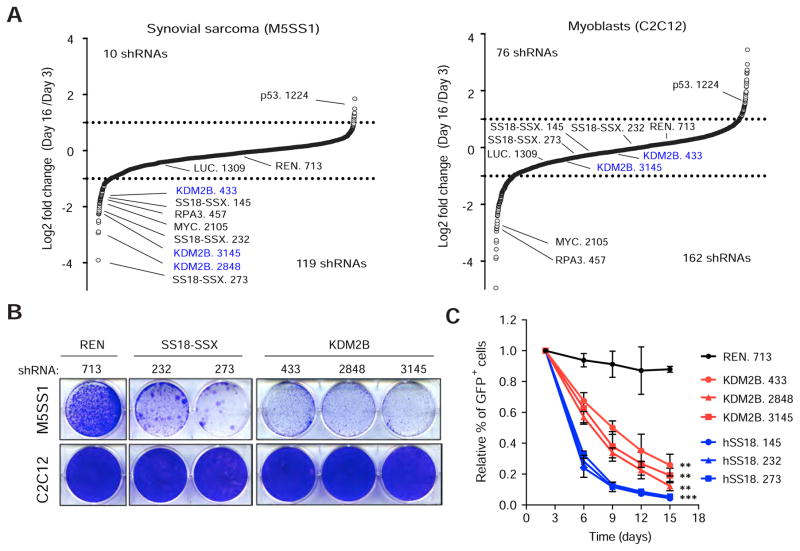
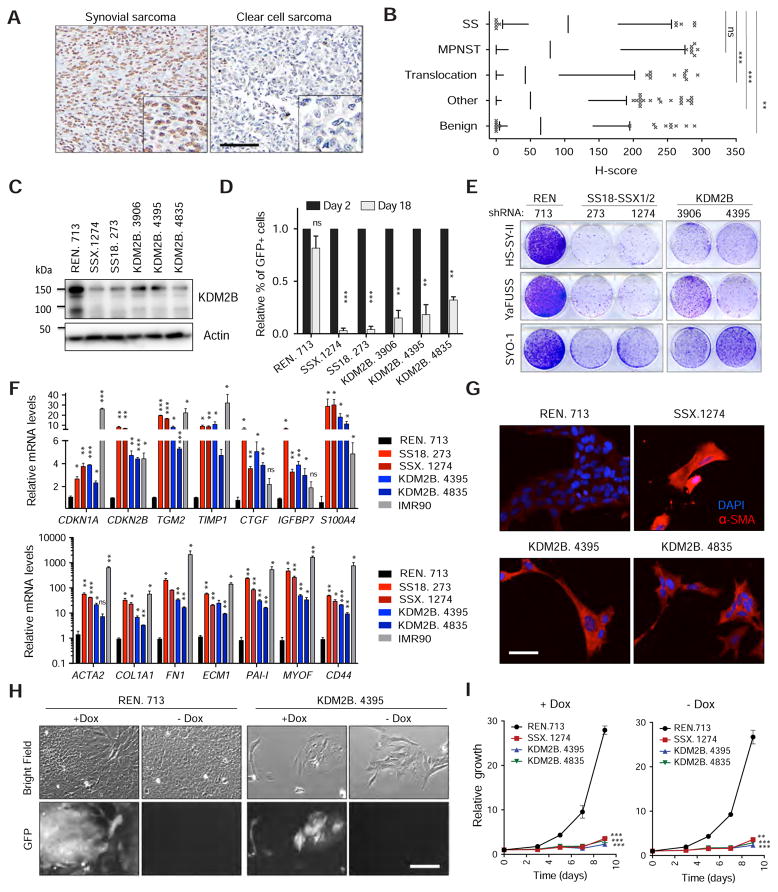
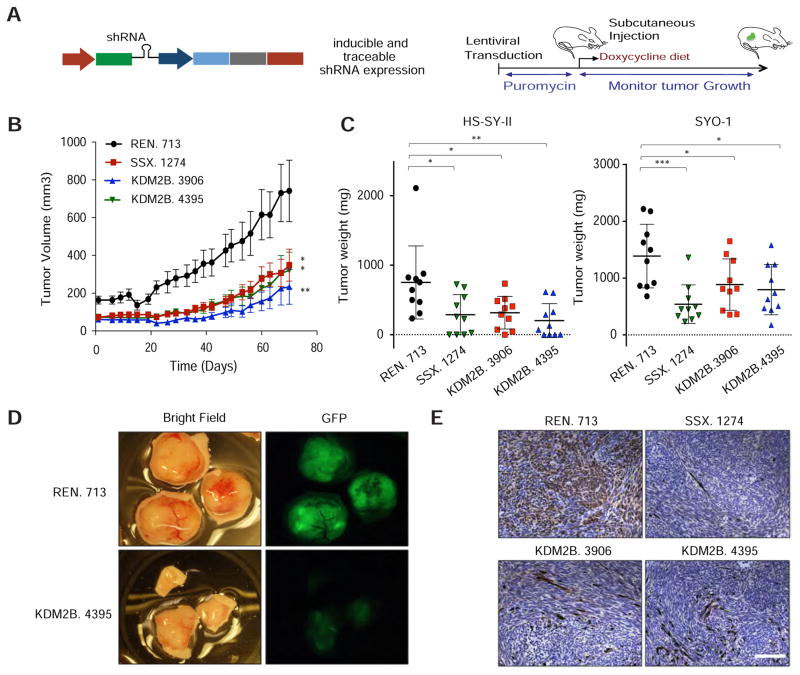
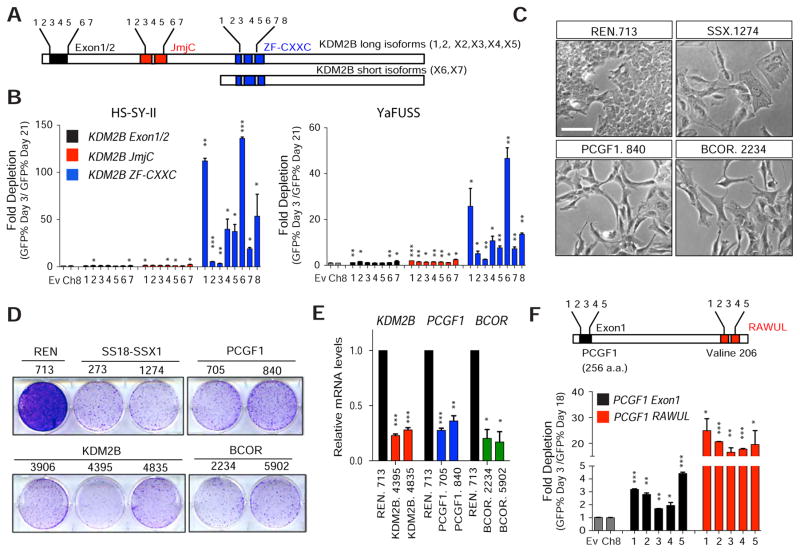
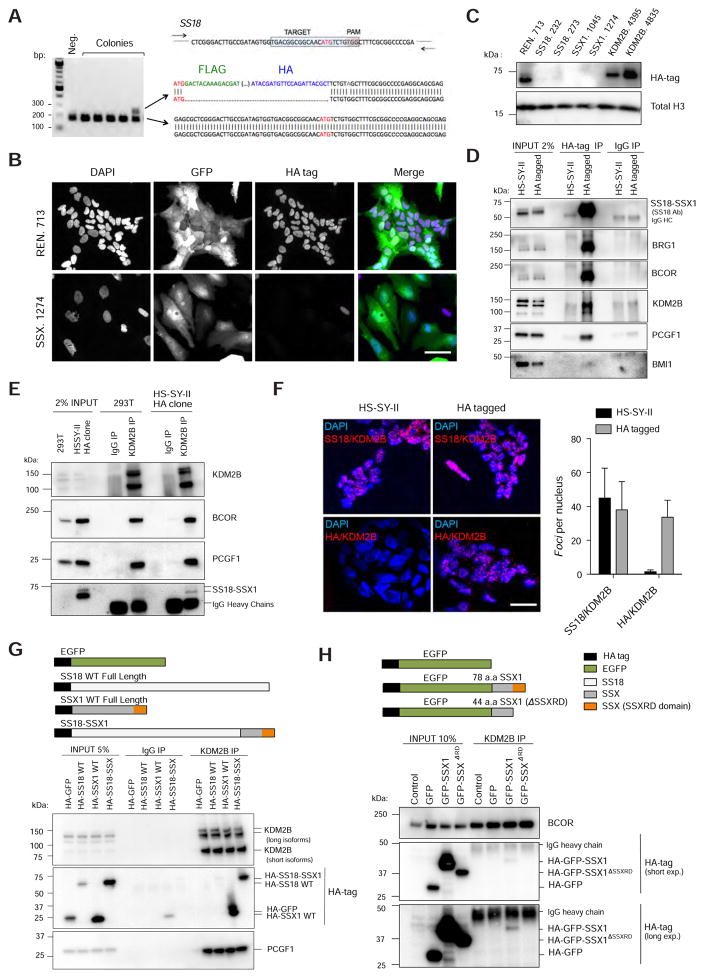
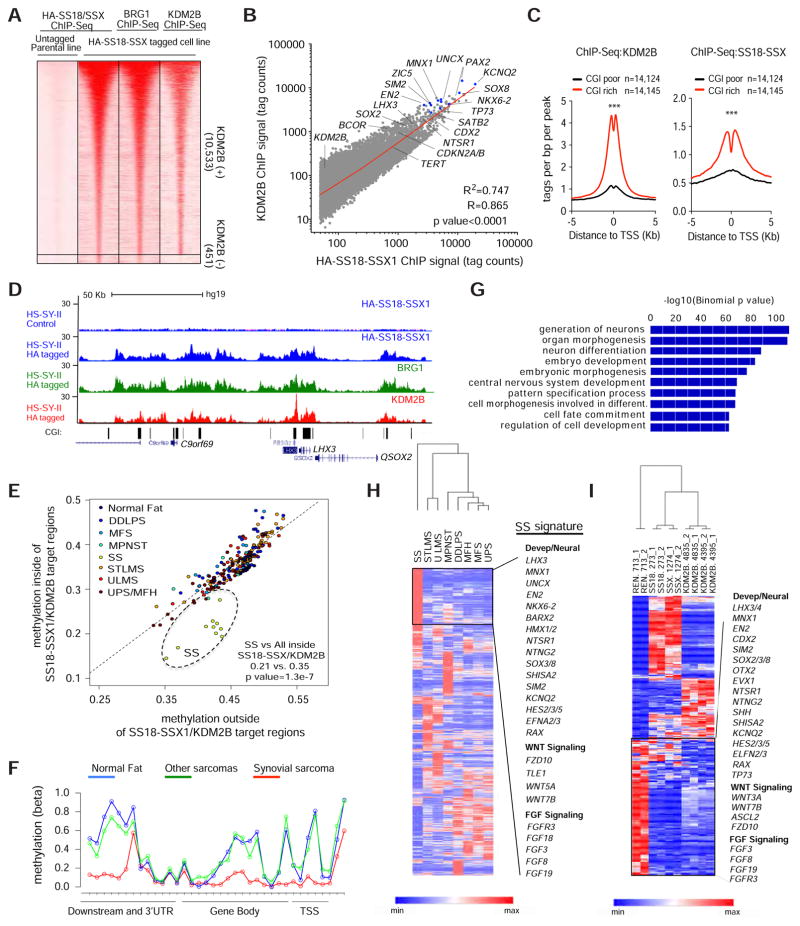
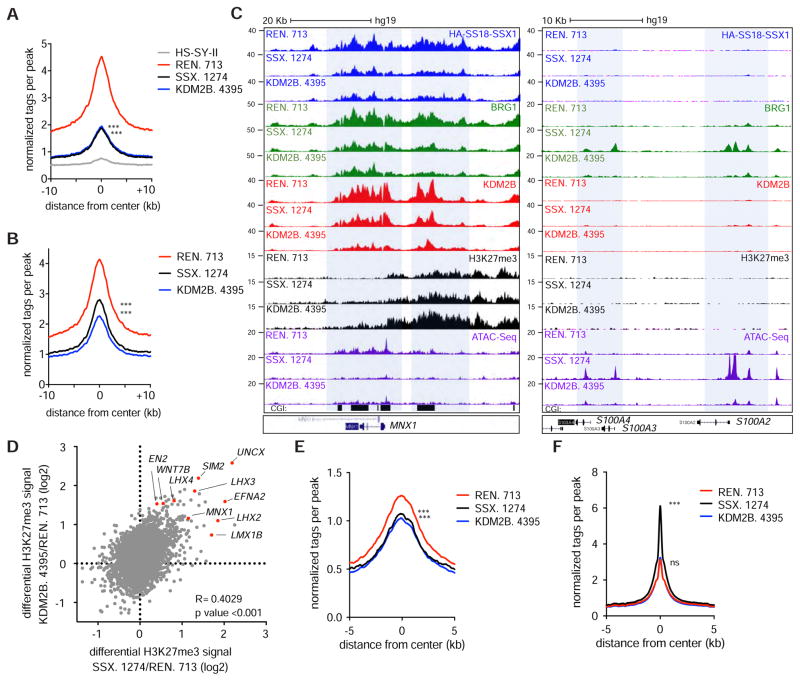
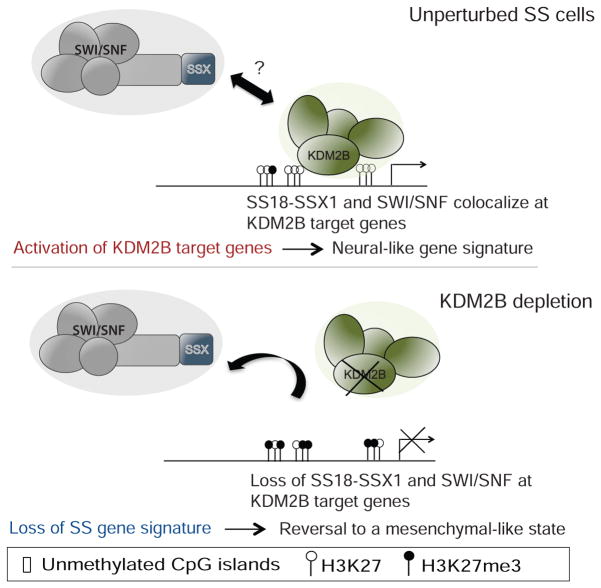
Synovial sarcoma is an aggressive cancer invariably associated with a chromosomal translocation involving genes encoding the SWI-SNF complex component SS18 and an SSX (SSX1 or SSX2) transcriptional repressor. Using functional genomics, we identify KDM2B, a histone demethylase and component of a non-canonical polycomb repressive complex 1 (PRC1.1), as selectively required for sustaining synovial sarcoma cell transformation. SS18-SSX1 physically interacts with PRC1.1 and co-associates with SWI/SNF and KDM2B complexes on unmethylated CpG islands. Via KDM2B, SS18-SSX1 binds and aberrantly activates expression of developmentally regulated genes otherwise targets of polycomb-mediated repression, which is restored upon KDM2B depletion, leading to irreversible mesenchymal differentiation. Thus, SS18-SSX1 deregulates developmental programs to drive transformation by hijacking a transcriptional repressive complex to aberrantly activate gene expression.

Keywords: CRISPR/Cas9-mediated endogenous protein tagging; DNA methylation; SWI/SNF; epigenetics; non-canonical polycomb repressive complex; oncogenic gene fusion; sarcoma.


Conflict of interest statement

DECLARATION OF INTEREST

The authors declare no competing interests.

Figures

Figure 1
Figure 1. KDM2B is an epigenetic dependency in synovial sarcoma
(A) Differences in shRNA representation presented as log2 of the ratio between mean average reads at Tf and T0 in synovial sarcoma cells and myoblasts. shRNAs against Renilla and Luciferase (REN. 713 and LUC. 1309) were used as neutral controls. (B) Clonogenic assay of M5SS1 (upper panel) and C2C12 (lower panel) cells transduced with the indicated shRNAs. (C) Validation of the effect of KDM2B shRNAs in mouse synovial sarcoma cells. Data presented as mean ± s.d. (n = 32) ** p value <0.001, ***p value<0.0001, unpaired t-test. See also Figure S1 and Table S1.
Figure 2
Figure 2. KDM2B inhibition irreversibly triggers mesenchymal differentiation
(A) Representative image of a KDM2B positive (synovial sarcoma) and of a negative (clear cell sarcoma) sample within the same set of sarcoma tissue microarrays (TMAs) analyzed. Scale bar=100 μm. (B) Quantification of KDM2B IHC in sarcoma TMAs showing H-scores for KDM2B staining in synovial sarcomas (SS, n=58), malignant peripheral nerve sheath tumors (MPNST, n=76), other translocation driven sarcomas (Translocation, n=108), other types of sarcoma (Other, n=209) and benign soft tissue tumors (Benign, n=89). The line in the boxes corresponds to the median. The top and bottom of the boxes correspond to the third and first quartiles, respectively. The lines above and below the box correspond to the 10th and 90th percentile. Data points above or below the limits are considered outliers. (C) Immunoblot for KDM2B in HS-SY-II cells transduced with the indicated shRNAs. (D) Cell competition assay for GFP-linked shRNAs in the HS-SY-II human synovial sarcoma cell line. Relative percentage of GFP+ cells to day 2 following shRNA induction. Data are presented as mean + s.d. (n=2). (E) Clonogenic assay of HS-SY-II, YaFUSS and SYO-1 cells transduced with the indicated shRNAs. (F) Quantitative RT-PCR for the expression of fibroblast-related genes. IMR90 human diploid fibroblasts were used as a positive control. Data presented as mean + s.d. (n=2). (G) Immunofluorescence analysis of alpha smooth muscle actin (α-SMA) in HS-SY-II cells, ten days following transduction with the indicated shRNAs. Scale bar=20 μm. (H) Bright field and GFP images of HS-SY-II cells transduced with TRE-regulated shRNAs cultured with doxycycline (+Dox) or upon doxycycline withdrawal (−Dox), at day 10 after Dox withdrawal. Scale bar=25 μm (I) Growth curves for HS-SY-II cells with (+Dox) or without Dox (-Dox), presented as mean ± s.d. (n = 32). *p value<0.05, **p <0.005 ***p value<0.0005. B. Kruskal-Wallis 1-way ANOVA. D, F, I unpaired t-test. See also Figure S2.
Figure 3
Figure 3. KDM2B is required for synovial sarcoma maintenance in vivo
(A) Strategy to evaluate the effect of KDM2B knockdown in vivo in HS-SY-II and SYO-1-derived xenografts. See also STAR methods. (B) Tumor volume was measured over time in HS-SY-II xenografts transduced with the indicated shRNAs. Error bars correspond to mean ± s.e.m (n=10). (C) Tumor weight at the final time point. Data represented as mean ± s.d. (n=10). (D) Bright field and GFP images of HS-SY-II-derived tumors. (E) GFP IHC staining of HS-SY-II-derived tumors. Scale bar=150 μm. B, C, and D. Two-tailed t-test *p value<0.05, **p value<0.005, ***p value<0.0005. See also Figure S2.
Figure 4
Figure 4. The DNA binding domain of KDM2B and the non-canonical PRC1.1 complex are essential for synovial sarcoma proliferation
(A) Schematics showing human KDM2B JmjC and ZF-CxxC protein domains in long and short KDM2B isoforms and location of single guide RNAs (sgRNA). (B) Depletion assays based on the % of GFP+ cells at day 3 and at day 21 following sgRNA transduction. Error bars correspond to mean + s.d. of two independent experiments. (C) Bright field images of HS-SY-II cells transduced with the indicated shRNAs 10 days following shRNA induction. Scale bar=25 μm (D) Clonogenic assay of HS-SY-II cells transduced with the indicated shRNAs. (E) Quantitative RT-PCR for KDM2B, PCGF1 and BCOR expression. Error bars correspond to mean +z s.d. (n=2). (F) Schematics of guide RNAs designed against the first exon or against the RAWUL domain of PCGF1 (surrounding Valine 206). Depletion assays based on the % of GFP+ cells at day 3 and day 18 days following sgRNA transduction in HS-SY-II cells. Error bars correspond mean + s.d. (n=2). Unpaired t-test *p value<0.05, **p value<0.005, ***p value<0.0005. See also Figure S3.
Figure 5
Figure 5. Endogenous SS18-SSX1 interacts with PRC1.1
(A) Endogenous SS18-SSX1 in the HS-SY-II human synovial sarcoma cell line was tagged with Flag-HA epitopes using CRISPR/Cas9-mediated homology-directed repair (HDR). An sgRNA targeting the region around the ATG and an ssDNA was used as template. For screening positive colonies PCR primers flanking the ATG site of SS18 were used (represented as arrows). (B) Immunofluorescence analysis showing nuclear staining using an anti HA-tag antibody. Scale bar=25 μm (C) Western blot analysis for HA tag in HA-SS18-SSX1 cells with the indicated shRNAs. (D) Co-IP analysis using an anti-HA tag antibody in HA-SS18-SSX1 clone. HS-SY-II parental cells were used as a negative control. (E) Co-IP using an anti-KDM2B antibody in HA-SS18-SSX clone and 293T cells. (F) Proximity ligation assay images and respective quantification verifying KDM2B and SS18-SSX in situ co-localization using an SS18 specific antibody or an HA tag antibody in untagged (parental) and HA-tagged HS-SY-II cells. Scale bar=25 μm. Error bars correspond to means + s.d. (n=3). (G) Co-IP in 293T expressing the indicated constructs using an anti-KDM2B antibody. (H) Co-IP using an anti-KDM2B antibody in 293T cells expressing GFP fused to the last 78 aminoacids of SS18-SSX1 (SSX1 fragment), and the same fragment lacking the SSXRD domain. See also Figure S4.
Figure 6
Figure 6. SS18-SSX1 and KDM2B co-occupy and regulate genes that define a synovial sarcoma signature
(A) Heat maps showing HA-SS18-SSX1, BRG1 and KDM2B ChIP-Seq signals over the 10,984 HA-enriched regions identified in HA-SS18-SSX tagged cells. Rows correspond to ±5 Kb regions across the midpoint of each HA-enriched region, ranked by increasing HA-SS18-SSX1 signal in the tagged clone. Color shading corresponds to the HA-SS18-SSX1, BRG1 and KDM2B ChIP-Seq read counts in each region. (B) Scatterplot of absolute HA-SS18-SSX1 and KDM2B signals (tag counts) at 10,533 SS18-SSX1/KDM2B co-occupied regions. (C) KDM2B and SS18-SSX1 binding profiles centered on TSS for CpG-rich promoters and CpG-poor promoters. (D) Gene tracks for HA-SS18-SSX1, BRG1 and KDM2B at CGI rich regions at the LHX3 locus. (E) Average methylation (beta) values for regions inside (y-axis) or outside (x-axis) SS18-SSX1/KDM2B occupied regions. Each data point corresponds to an individual patient sarcoma sample. Different sarcoma sub-types are indicated and color-coded. Synovial sarcomas (SS), undifferentiated pleiomorphic sarcomas/malignant fibrous histiocytoma (UPS/MFH), myxofibrosarcomas (MFS), malignant peripheral nerve sheath tumors (MPNST), uterine leiomyosarcomas (ULMS), soft tissue leiomyosarcomas (STLMS), dedifferentiated liposarcomas (DDLPS). (F) Methylation (beta) values across the LHX3 locus in SS compared with normal tissue (Fat) and all other sarcoma subtypes described in (E). (G) Gene ontology analysis of genes associated with all 10,533 SS18-SSX1/KDM2B occupied regions. (H) Unsupervised clustering based on mean RNA-Seq values of sarcoma sub-types analyzed by The Cancer Genome Atlas (TCGA). Synovial Sarcoma (SS, n=10), STLMS (n=72), ULMS (n=32), MPNST (n=10), DDLPS (n=58), MFS (n=25), Malignant fibrous histiocytoma (MFH n=30) and UPS (n=22). (I) Supervised clustering based on the top 200 genes differentially upregulated or downregulated upon KDM2B knockdown. C. Unpaired t-test, ***p value<0.0001. See also Figure S5–S6 and Tables S2–5.
Figure 7
Figure 7. KDM2B recruits SS18-SSX to activate developmentally regulated genes otherwise subjected to polycomb-mediated gene repression
(A, B) HA-SS18-SSX1 (A) and BRG1 (B) ChIP-Seq enrichment meta-profiles in REN. 713 (control shRNA), SSX.1274 and KDM2B. 4395 conditions representing the average read counts per 20 bp bin across a 20 Kb window centered on 4,567 SSX. 1274 sensitive regions. (C) Gene track for KDM2B, HA-SS18-SSX1 and H3K27me3 ChIP-Seq and ATAC-Seq at the MNX1 and S100A2/4 loci. (D) Scatterplot for differential H3K27me3 levels upon knockdown of SS18-SSX1 or KDM2B at SSX.1274 sensitive regions. Genes with highest gains in H3K27me3 are highlighted. (E, F) ATAC-Seq enrichment meta-profiles representing the average read counts per 20 bp bin across a 10 Kb window centered on 10,984 SS18-SSX1 occupied regions (E) and at 117,459 non-SS18-SSX1 occupied ATAC-Seq peaks (F). Unpaired t-test ***p value<0.0001. See also Figure S7.
Figure 8
Figure 8. Proposed model for KDM2B-dependent SS18-SSX1 activity
In synovial sarcoma KDM2B binds unmethylated CpG islands of developmental genes. KDM2B-PRC1.1 facilitates recruitment of SS18-SSX1 containing SWI/SNF complexes by direct or indirect interaction with SS18-SSX1 leading to increased gene accessibility and consequent aberrant activation of developmental genes that would otherwise be repressed. Upon KDM2B inhibition SS18-SSX1 binding is reduced, allowing H3K27me3 gains at a sub-set of SS18-SSX1 targets, reduced gene accessibility and consequent down-regulation of expression of developmental proteins and TFs, possibly allowing re-establishment of normal differentiation programs.

Comment in

References

    1. Aguirre AJ, Meyers RM, Weir BA, Vazquez F, Zhang CZ, Ben-David U, Cook A, Ha G, Harrington WF, Doshi MB, et al. Genomic Copy Number Dictates a Gene-Independent Cell Response to CRISPR/Cas9 Targeting. Cancer Discov. 2016;6:914–929. - PMC - PubMed
    1. Anders S, Pyl PT, Huber W. HTSeq--a Python framework to work with high-throughput sequencing data. Bioinformatics. 2015;31:166–169. - PMC - PubMed
    1. Andricovich J, Kai Y, Peng W, Foudi A, Tzatsos A. Histone demethylase KDM2B regulates lineage commitment in normal and malignant hematopoiesis. J Clin Invest. 2016;126:905–920. - PMC - PubMed
    1. Baird K, Davis S, Antonescu CR, Harper UL, Walker RL, Chen Y, Glatfelter AA, Duray PH, Meltzer PS. Gene expression profiling of human sarcomas: insights into sarcoma biology. Cancer Res. 2005;65:9226–9235. - PubMed
    1. Barham W, Frump AL, Sherrill TP, Garcia CB, Saito-Diaz K, VanSaun MN, Fingleton B, Gleaves L, Orton D, Capecchi MR, et al. Targeting the Wnt pathway in synovial sarcoma models. Cancer Discov. 2013;3:1286–1301. - PMC - PubMed

Publication types

MeSH terms