. 2018 Mar 22;173(1):153-165.e22.
doi: 10.1016/j.cell.2018.02.004. Epub 2018 Mar 1.

Reducing Pericyte-Derived Scarring Promotes Recovery after Spinal Cord Injury

Affiliations

Reducing Pericyte-Derived Scarring Promotes Recovery after Spinal Cord Injury

David Oliveira Dias et al. Cell. .

Abstract

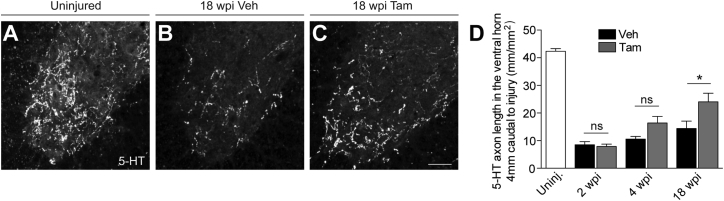
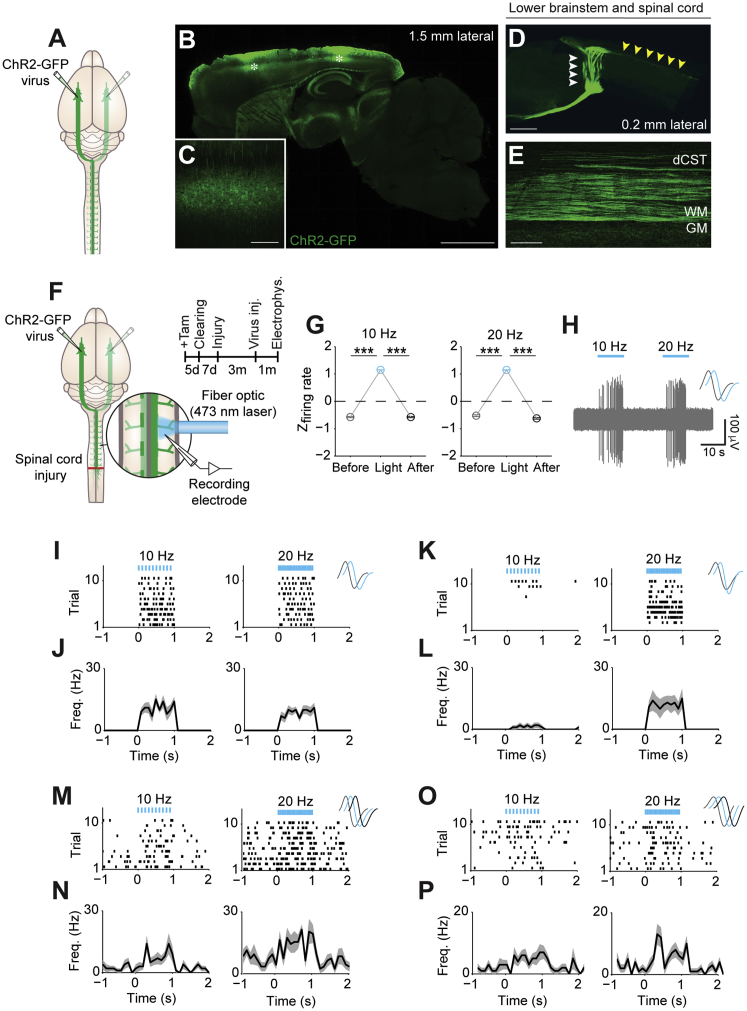
CNS injury often severs axons. Scar tissue that forms locally at the lesion site is thought to block axonal regeneration, resulting in permanent functional deficits. We report that inhibiting the generation of progeny by a subclass of pericytes led to decreased fibrosis and extracellular matrix deposition after spinal cord injury in mice. Regeneration of raphespinal and corticospinal tract axons was enhanced and sensorimotor function recovery improved following spinal cord injury in animals with attenuated pericyte-derived scarring. Using optogenetic stimulation, we demonstrate that regenerated corticospinal tract axons integrated into the local spinal cord circuitry below the lesion site. The number of regenerated axons correlated with improved sensorimotor function recovery. In conclusion, attenuation of pericyte-derived fibrosis represents a promising therapeutic approach to facilitate recovery following CNS injury.

Keywords: axon regeneration; fibrosis; optogenetics; pericyte; scar; sensorimotor functional recovery; spinal cord injury.


Figures

None
Graphical abstract
Figure 1
Figure 1
Attenuation of Pericyte-Derived Scarring Results in Reduced Fibrosis following Spinal Cord Injury (A) Genetic strategy to block the generation of progeny by type A pericytes. (B and C) Sagittal view of the lesion site in vehicle (B) and Tam (C) animals immunostained for PDGFRβ 2 wpi. Scale bars, 100 μm. (D) Percentage of scar occupancy by PDGFRβ-expressing stromal cells in lesion sites of vehicle or tamoxifen animals 2 wpi. Dark gray and white circles represent Tam and Tam-def animals, respectively. Horizontal lines represent the mean. (E) Top ten gene ontology terms significantly enriched in injury sites of vehicle versus Tam animals 2 wpi. Numbers on the right show differentially expressed genes falling into each term. Fold change >1.5, Padj < 0.05 by modified Fisher exact test (EASE score). (F) Top ten canonical pathways differentially enriched in lesions of vehicle versus Tam animals 2 wpi. Fold change >1.5, p < 0.05 by right-tailed Fisher exact test. (G) Heatmap of differentially expressed fibrosis-associated genes in the uninjured spinal cord and in lesion sites of vehicle and Tam animals 2 wpi. Unsupervised hierarchical clustering dendrogram based on Pearson correlations. Color code shows log10 (1 + fragments per kilobase of transcript sequence per million mapped fragments [FPKM]) values. Red and blue indicate low and high gene expression, respectively. Fold change >1.5, FDR adjusted p < 0.05. n = 10 (vehicle), n = 12 (Tam) animals in (D) and n = 4 (Uninj., uninjured), n = 4 (vehicle), n = 4 (Tam) animals in (G). ∗∗∗∗p < 0.0001 by two-sided, unpaired Student’s t test. See also Figures S1 and S2 and Tables S1 and S2.
Figure S1
Figure S1
Genetic Strategy to Modulate the Generation of Type A Pericyte Progeny, Related to Figure 1 (A–D) Cross sections of the spinal cord of Glast-YFP (A, B) and Glast-Rasless-YFP (C, D) mice showing recombined (YFP+) type A pericytes (PDGFRβ+) tightly associated with the vasculature (podocalyxin+) under uninjured conditions (A, C) and type A pericyte-derived cells in the injured spinal cord 5 days after a dorsal funiculus incision (B, D). White arrowheads point at type A pericyte-derived cells that detached from the blood vessel wall. (E–H) Cross sections of uninjured (E, G) and injured spinal cord 5 dpi (F, H) showing proliferation (EdU incorporation) of recombined pericytes and progeny in Glast-YFP (E, F) and Glast-Rasless-YFP (G, H) mice. White and yellow arrowheads in E, G depict cells single positive for EdU and YFP, respectively. White arrowheads in F, H show YFP+ cells that incorporated EdU. (I) Density of recombined (Rec.) and non-recombined (Non rec.) PDGFRβ-expressing stromal cells in the uninjured and injured spinal cord 5 dpi of Glast-YFP and Glast-Rasless-YFP mice. Following injury, the number of recombined pericyte-derived stromal cells per area is greatly reduced in Glast-Rasless-YFP mice compared to Glast-YFP control mice. (J) Proportion of PDGFRβ-expressing cells associated with (ON vessel) or detached from (OFF vessel) the blood vessel wall in the uninjured and injured spinal cord 5 dpi of Glast-Rasless-YFP and control Glast-YFP mice. Under homeostatic conditions all pericytes are associated with the vasculature in both Glast-YFP and Glast-Rasless-YFP animals. Upon injury, the percentage of PDGFRβ+ cells located in distance to the blood vessel wall is greatly reduced in Glast-Rasless-YFP mice paralleled by a higher percentage of cells remaining associated with the vessel compared to control Glast-YFP animals. (K) Density of proliferating and non-proliferating PDGFRβ-expressing cells in the uninjured and injured spinal cord 5 dpi of Glast-Rasless-YFP and Glast-YFP control animals. In the uninjured spinal cord, PDGFRβ+ pericytes did not incorporate EdU in neither Glast-Rasless-YFP nor Glast-YFP mice. Injury-induced proliferation of PDGFRβ+ stromal cells is greatly decreased in Glast-Rasless-YFP mice compared to control Glast-YFP animals. The density of non-proliferating stromal cells is not significantly altered. (L) Percentage of proliferating and non-proliferating recombined PDGFRβ-expressing cells in the uninjured and injured spinal cord 5 dpi of Glast-Rasless-YFP and Glast-YFP control animals. Under homeostatic conditions virtually no recombined cells incorporate EdU in Glast-Rasless-YFP or Glast-YFP mice. The proliferation of recombined PDGFRβ+ cells induced by the injury is dramatically decreased in Glast-Rasless-YFP animals compared to control Glast-YFP mice. This gives a relative increase in the proportion of non-proliferative recombined cells. (M–R) Low power photographs and sagittal view of the spinal cord of Glast-Rasless-YFP mice showing dense (vehicle; M, P), reduced (intermediate recombination penetrance, Tam; N, Q) or low/no (full recombination penetrance, Tam-def; O, R) PDGFRβ+ fibrotic scarring at the injury site 2 weeks after a dorsal hemisection. Dashed circles mark the injured area and border a tissue defect () in R. Images in P, Q are the same as in Figures 1B and 1C, respectively. Scale bars represent 0.5 mm (M-O), 200 μm (R), 100 μm (P, Q) and 50 μm (A-H). Data in I-L shown as mean ± SEM. n = 3 (uninjured Glast-YFP), n = 4 (uninjured Glast-Rasless-YFP), n = 4-5 (Glast-YFP injury), n = 4 (Glast-Rasless-YFP injury) animals in I-L. ns, non-significant; ∗∗∗∗p < 0.0001 by One-Way ANOVA followed by Tukey’s post hoc test.
Figure S2
Figure S2
Attenuation of Injury-Induced Proliferation of Type A Pericytes Results in Reduced Fibrosis following Spinal Cord Injury, Related to Figure 1 (A) Heatmap of all differentially expressed genes between lesion sites of vehicle and Tam animals 2 wpi. Gene expression values of this cohort of genes in the uninjured spinal cord were included for comparison. Genes are clustered according to gene ontology (left margin). Color code shows TMM-normalized FPKM values. Red and blue indicate low and high gene expression, respectively; Fold change > 1.5; FDR adjusted p < 0.05. (B and C) Top ten gene ontology cellular component (B) and molecular function (C) terms significantly enriched in injury sites of vehicle versus Tam animals 2 wpi. Numbers on the right show differentially expressed genes falling into each term. Fold change > 1.5, Padj < 0,05 by modified Fisher Exact test (EASE score). (D) Relative expression level of fibrosis-associated genes 2 wpi compared with uninjured control mice determined by qRT-PCR. (E) Western blot analyses of uninjured spinal cord tissue (Uninj.) and injury sites of vehicle (Veh) and Tam animals 2 wpi. YFP expression (recognized by anti-GFP antibody) is restricted to Glast-Rasless-YFP animals undergoing recombination of the reporter allele mediated by tamoxifen administration (Tam animals). Uninjured and injured control Glast-Rasless-YFP mice that received vehicle without tamoxifen (Veh animals) do not recombine and therefore show no expression of the YFP reporter protein. The housekeeping protein GAPDH was used as loading control. (F–Q) Sagittal sections of the spinal cord of Glast-Rasless animals 2 wpi showing fibrotic (F-J, L-P) and glial (K, Q) scarring. FPKM, fragments per kilobase of transcript sequence per million mapped fragments. Scale bar represents 200 μm (F-Q). Data in D shown as mean ± s.e.m. n = 4 (uninjured), n = 4 (vehicle), n = 4 (Tam) animals in A; n = 7-10 (vehicle), n = 11-12 (Tam) animals in D; n = 6 (vehicle), n = 6 (Tam) animals in E. ns, non-significant. p < 0.05, ∗∗p < 0.01 by Mann-Whitney U-test.
Figure S3
Figure S3
Reduction of Pericyte-Derived Scarring Influences the Response of Other Scar-Forming Cells, Related to Figure 2 (A–L) Sagittal views of the spinal cord 4 wpi showing CD68-expressing inflammatory cells (A-F) and GFAP-positive scar-forming astrocytes (B,D,F,G-L) in Glast-Rasless animals. (M) Area occupied by CD68-positive cells spanning 500 μm rostral and caudal to the lesion center. (N and O) Density of OPCs found within 100 μm rostral and caudal to the glial-fibrotic lesion border (scar-forming OPCs, N) and within a 100 μm wide strip of spared but reactive neural tissue 500 μm away from either side of the lesion core (O). (P) Percentage of area occupied by GFAP-positive astrocytes within 500 μm rostral and caudal to the lesion center. (Q and R) Glial scar score reflecting the complexity level of the glial network (from no astrocytic hypertrophy – score 0, to hypertrophied astrocytes with formation of glial limitans bordering the lesion core – score 3) at various distances rostral to the lesion site. (S–V) BDA-traced CST axon tips intermingle and make contact with recombined (YFP+) type A pericyte-derived cells (S), CD68-expressing immune cells (T), reactive astrocytes (U) and OPCs (V) 2 wpi. White arrowheads point at CST axons contacting scar-forming cells. (W–Z) Sagittal sections of the spinal cord at 4 wpi depicting regrowing CST axons in relation to GFAP-positive glial processes in vehicle (W), Tam (X, Y) and Tam-def animals (Z). Dashed lines in E,F,K,L,Z border a tissue defect (). A,B; C,D and E,F denote paired images. Scale bars represent 25 μm (S-T), 100 μm (A-L) and 200 μm (W-Z). Data shown as mean ± SEM. 2 wpi, n = 10 (vehicle), n = 9 (Tam), n = 3 (Tam-def) animals; 4 wpi, n = 5 (vehicle), n = 5 (Tam), n = 2 (Tam-def) animals. ns, non-significant; p < 0.05, ∗∗p < 0.01 by One-Way ANOVA followed by Tukey’s post hoc test in M-P and two-sided, unpaired Student’s t-test (corrected for multiple comparisons using Holm-Sidak method) in Q,R.
Figure 2
Figure 2
Pericyte-Derived Scarring Influences Retraction Bulb Formation, Dieback, and Regeneration of CST Axons (A and B) Sagittal view of the lesion site 2 wpi showing BDA+ CST axons stopping at the glial scar (GFAP+) and some axons reaching to the lesion core (A) and stopping at YFP+ pericyte-derived cells (B). (C) Proportion of BDA+ CST axons contacting astrocytes, OPCs, immune cells and type A pericyte-derived stroma at 2 wpi. (D–J and L) Sagittal view of the injured spinal cord showing BDA+ CST retraction bulbs (D–I) and quantification (J and L). White arrowheads point at axon tips. Indicates the edge of a tissue defect (failure to close the injury site) in Tam-def animals. (K and M) Mean distance of CST axon tips to the lesion margin. (N–Q) Low-power images of BDA+ CST axons in sagittal sections of the injured spinal cord. Arrowheads indicate the lesion site. D, V, R, C on the top right corner in (A) and (N) denote dorsal, ventral, rostral, and caudal to the injury, respectively. Scale bars represent 500 μm (N–Q), 200 μm (A and D–I), 50 μm (B), and 20 μm (insets, D–I). Data shown as mean ± SEM. n = 6 (type A stroma), n = 14–16 (astrocytes, OPCs, immune cells) in (C); 2 wpi, n = 10 (vehicle), n = 9 (Tam), n = 3 (Tam-def) animals in (J) and (K); 4 wpi, n = 5 (vehicle), n = 5 (Tam), n = 2 (Tam-def) animals in (L) and (M). ns, non-significant; p < 0.05 by one-way ANOVA followed by Tukey’s post hoc test. See also Figure S3.
Figure 3
Figure 3
Moderate Reduction of Pericyte-Derived Scarring Facilitates CST Axon Regeneration after Spinal Cord Injury (A–H) Low-power images (A–F) and camera Lucida projections (G and H) of BDA+ CST axons in sagittal sections of the injured spinal cord. Arrowheads indicate the lesion site. (I–K) Sagittal view of the injured spinal cord showing stalled BDA+ CST axons proximal to a tissue defect () in a Tam-def animal. (I) and (J) denote paired images. (L) Percentage of scar occupancy by PDGFRβ-expressing stromal cells in lesion sites of vehicle and tamoxifen animals assessed for axonal regrowth 18 wpi. Dark gray and white circles represent Tam and Tam-def animals, respectively. Horizontal lines represent the mean. (M and N) Correlation between the recombination efficiency and percentage of scar core occupied by PDGFRβ+ stromal cells (M) or tissue defect volume (N) in Glast-Rasless mice. Matched animals are indicated with the same color in (M) and (N). (O and P) Percentage of BDA+ CST axon regeneration (relative to the total number of traced CST axons present at 3 mm rostral to the lesion) at (O) the lesion core and (P) at different rostral (R) and caudal (C) distances from the injury site 18 wpi. (Q) Cumulative percentage of BDA+ CST axon regeneration at 0.5 mm caudal to the injury. (R) Distribution of BDA+ CST axon regeneration across different regions of the spinal cord assessed 4 mm caudal to the injury. (S and T) Cross section of the spinal cord of a Tam animal showing regenerated vGlut1/2+ BDA-labeled CST axons 4 mm caudal to the lesion 18 wpi (T). Enlargement of box in (S). (U–W) Three examples of BDA-labeled regenerated CST axons containing Synapsin I (Syn I)+ vesicles found in close proximity to postsynaptic GluR2/3 receptors, indicating synapses. Scale bars represent 500 μm (A, D, I, and J), 250 μm (B and E), 200 μm (S), 100 μm (C, F, and K), 20 μm (T), and 2 μm (U–W). Data shown as mean ± SEM. n = 8 (vehicle), n = 10 (Tam), n = 2 (Tam-def) animals in (L)–(R). ns, non-significant; ∗∗∗∗p < 0.0001 by two-sided, unpaired Student’s t test in (L). p < 0.05, ∗∗p < 0.01 by one-way ANOVA followed by Tukey’s post hoc test in (O). ∗∗∗p < 0.001 by Mann-Whitney U-test in (Q). Two-way RM ANOVA: main effect of group, F(1,16) = 5.649, p = 0.0303 in (P) and main effect of group, F(1,80) = 16.52, p = 0.0001 in (R). p < 0.05, ∗∗p < 0.01, ∗∗∗∗p < 0.0001 by Fisher’s LSD post hoc test in (P) and (R). See also Figure S4.
Figure S4
Figure S4
Distribution of CST Axons Rostral and Caudal to Lesions with Dense or Attenuated Fibrotic Scarring, Related to Figure 3 (A and B) Composite projection images (top) and camera lucida projections (bottom) of serial sagittal sections of injured spinal cord demonstrating BDA+ CST axon growth through, around, and past the lesion site in Tam (B) but not vehicle (A) animals 18 wpi. Black color coded axons illustrate CST axon growth through the medial zone of the spinal cord (mostly dorsal and ventral column white matter and central canal), blue represents growth within the medial-lateral zone (mostly dorsal and ventral gray matter) and red depicts axons extending through the lateral zone (mostly white mater). Camera lucida projection images at the bottom were generated by stacking the medial, medial-lateral and lateral projections into one final projection image. White arrowheads and shaded gray area in composite projection images (top) and camera lucida projections (bottom) indicate the lesion site, respectively. (C–L) Cross sections of the spinal cord showing the distribution of BDA-labeled CST axons 4 mm rostral (C, H) and caudal (D, I) to lesion sites of vehicle (C, D) or Tam (H, I) animals 18 wpi. E-G and J-L, Enlargement of boxes in (D) and (I), respectively. Dashed lines outline the ventral part of the dorsal column. dCST, main dorsal corticospinal tract; dGM, dorsal gray matter; iGM, intermediate gray matter; vGM, ventral gray matter. Scale bars represent 500 μm (A, B), 100 μm (C, H), 50 μm (E-G, J-L) and 200 μm (D,I).
Figure 4
Figure 4
Moderate Reduction of Pericyte-Derived Scarring Facilitates RST Axon Regeneration after Spinal Cord Injury (A–D) Coronal view of 5-HT-immunoreactive raphespinal fibers in the spinal cord ventral horn of Glast-Rasless-YFP mice 4 mm caudal to the lesion 18 wpi (A–C) and quantification (D). Scale bars represent 50 μm (A–C). Data shown as mean ± SEM. n = 4 (Uninj.) animals; 2 wpi: n = 10 (vehicle), n = 12 (Tam); 4 wpi: n = 5 (vehicle), n = 7 (Tam); 18 wpi: n = 8 (vehicle), n = 12 (Tam) animals. p < 0.05 by one-way ANOVA followed by Tukey’s post hoc test.
Figure 5
Figure 5
Local Photoactivation of ChR2-Expressing CST Axon Terminals Generates Postsynaptic Activity in Local Spinal Neurons (A) Schematic depicting the strategy used to label the CST. (B–E) Sagittal view of the brain (B–D) and spinal cord (D and E) 4 weeks after bilateral injection of AAV9-CAG-ChR2-GFP into layer V of the sensorimotor cortex demonstrating the effective expression of the opsin throughout the neurospinal axis. (C) Membrane-bound ChR2-GFP expression in pyramidal neurons. Asterisk in (B) depicts viral injection sites. White and yellow arrowheads in (D) point at the decussation of CST at the lower brainstem level and axons projecting down the spinal cord, respectively. (F) Experimental outline illustrating the strategy employed to photoactivate ChR2-GFP+ CST axon terminals in the cervical spinal cord rostral to the lesion combined with recordings of local spinal neurons in anesthetized Glast-Rasless mice injected with AAV9-CAG-ChR2-GFP in the sensorimotor cortex. (G) Average Z firing rate of spinal units in response to spinal illumination. Photoactivation of ChR2-GFP+ CST axon terminals elicits postsynaptic responses in spinal neurons rostral to the lesion. (H) Representative spike trace from a spinal unit rostral to the lesion showing robust and time-locked recruitment upon photoactivation. (I–L) Peri-event raster plots (I and K) and histograms (J and L) showing 2 examples of light-driven recruitment of new, previously silent, spinal units upon photoactivation. (M–P) Peri-event raster plots (M and O) and histograms (N and P) of 2 light-driven spinal units that increased firing rate upon photoactivation. For illustration of bilateral virus tracing in (A) and (F), injections into the left and right hemispheres of the brain are represented as bright and faded green color, respectively. Blue bars/lines represent 473 nm optical stimulation. Photostimulation in (G)–(P): 473 nm light, 5 mW, 3 ms pulses, 10 or 20 Hz. Insets in (H), (I), and (K) show spontaneous (gray) or light-evoked (blue) spike waveforms of recorded spinal neurons. Insets in (M) and (O) show spike waveforms of recorded spinal neurons before (gray), during (blue) or after (black) photostimulation. Before, 1 s before illumination; light, 1 s during illumination; after, 1 s post illumination. Scale bars, 2 mm (B), 1 mm (D), 200 μm (C and E). Data shown as mean ± SEM. n = 8 neurons in (G). ∗∗∗p < 0.001 by paired Student’s t test. See also Figures S5 and S6.
Figure S5
Figure S5
Viral Expression of ChR2 in the Mouse Sensorimotor Cortex, Related to Figures 5 and 6 (A–C) Cross section through the mouse sensorimotor cortex (A-C) showing expression of ChR2–GFP (C) in deep layer V neurons (A, B). Cux1 and Ctip2 label superficial and deep cortical layers, respectively. in C denotes involuntary infection of the brain surface. (D–O) ChR2–GFP+ cells co-express the layer V specific marker ER81 (D-F), known CST projection neuron markers such as UCHL-1 (G-I), mu Crystallin (J-L) and the excitatory, glutamatergic neuron marker CaMKIIα (M-O). Yellow arrowheads point at cells single positive for ER81, UCHL-1, mu crystalline and CaMKIIα, respectively. White arrowheads denote ChR2-GFP+ cells co-expressing the marker. (P) Percentage of ChR2-GFP+ neurons expressing (and not expressing) CaMKIIα in cortical layer V. (Q–X) Cross sections through the dorsal root ganglion (Q-T) and peripheral nerve (U-X) showing the absence of ChR2-GFP labeling in NeuN-, neurofilament H-positive peripheral nervous system neurons and axons (Q-V), cholinergic spinal motor axons (ChAT-positive; S, T, W, X) and S100-, P0-positive satellite glial cells/ Schwann cells (Q, R, U-X). A-C, D-F, G-I, J-L, M-O, Q, R; S, T; U, V and W, X denote paired images. ER81, also known as ETV1 (E twenty-six variant 1); UCHL-1, ubiquitin carboxyl-terminal hydrolase isozyme L1 (also known as PGP9.5); CaMKIIα, calcium/calmodulin-dependent protein kinase II alpha; ChAT, choline acetyltransferase. Data shown as mean ± SEM.; n = 3 animals in P. Scale bars represent 200 μm (A-C), 100 μm (D-O, Q, R, W, X) and 50 μm (S, T, U, V).
Figure S6
Figure S6
Optogenetic Activation of Pyramidal Neurons and Evaluation of Cortico-Spinal Communication by Orthodromic and Antidromic Activation of the CST, Related to Figures 5 and 6 (A) Schematic of optogenetic stimulation and recording paradigm in the sensorimotor cortex of anesthetized Glast-Rasless mice. (B and C) Representative spike traces from a ChR2-expressing pyramidal neuron photostimulated at 10 (B) or 20 (C) Hz. (D–G) Raster plots (D), peristimulus time histogram (PSTH; E), normalized change in firing rate (F) and spike probability (G) of a representative pyramidal neuron from the M1 cortex upon 10, 20, 30 and 40 Hz photoactivation. (H and K) Schematic summary of orthodromic photostimulation of the CST paired with cervical spinal cord recordings in anesthetized Glast-Rasless mice transduced with control AAV9-CAG-GFP (H) or AAV-CAG-ChR2-GFP (K) in the sensorimotor cortex. (I–M) Peri-event raster plots (I, L) and histograms (J, M) of representative units from the cervical spinal cord of animals transduced with AAV9-CAG-GFP (I, J) or AAV-CAG-ChR2-GFP (L, M) in the sensorimotor cortex upon 10 Hz cortical illumination. (N and Q) Schematic summary depicting antidromic photostimulation of CST axon terminals in the cervical spinal cord combined with cortical recordings in anesthetized Glast-Rasless-YFP mice transduced with control AAV9-CAG-GFP (N) or AAV9-CAG-ChR2-GFP (Q) in the sensorimotor cortex. (O–S) Peri-event raster plots (O, R) and histograms (P, S) of representative sensorimotor cortex layer V pyramidal neurons of animals transduced with AAV9-CAG-GFP (O, P) or AAV-CAG-ChR2-GFP (R, S) in the sensorimotor cortex upon 10 Hz spinal illumination. Blue lines/bars represent 473 nm optical stimulation. Photostimulation: 5 mW, 3cms pulses, 10 or 20 or 30 or 40cHz in A-G and 10 mW, 10cms pulse, 10cHz in H-S. Inset in B, C shows spike waveforms of a typical pyramidal neuron before (gray), during (blue) or after (black) photoactivation and in J, M and P, S show spike waveforms of recorded spinal neurons and archetypal spike waveforms of pyramidal neurons, respectively. For illustration of bilateral virus transduction in schematics, injections into the left and right hemispheres of the brain are represented as bright and faded green color, respectively. Before, 1 s before illumination; Light, 1 s during illumination; After, 1 s post illumination. Data in F shown as mean ± SEM. ∗∗∗p < 0.001 by paired Student’s t test.
Figure 6
Figure 6
Regenerated CST Axons Functionally Integrate into the Local Spinal Circuit Caudal to the Lesion Optogenetic assessment of functional integration of regenerated CST axons in the injured spinal cord of vehicle (A–G) and Tam (H–N) animals, 18 wpi. (A and H) Schematic and experimental outline of in vivo optogenetic stimulation and recording paradigm in the spinal cord caudal to the lesion. (B and I) Average Z firing rate of spinal units in response to spinal illumination. Photostimulation does not modulate postsynaptic activity of local spinal neurons caudal to the lesion in vehicle animals (B) but drives postsynaptic activity in spinal neurons in Tam animals (I). (C and J) Representative spike trace from a spinal unit recorded caudal to lesion showing no response in vehicle animals (C) and increased firing in response to illumination of regenerated ChR2-expressing CST axon terminals in Tam animals (J). (D–G and K–N) Raster plots (D and K), peristimulus time histogram (PSTH) (E and L), normalized change in firing rate (F and M) and spike probability (G and N) of a representative spinal unit caudal to the lesion not responding (vehicle, D–G) and responding (Tam, K–N) to photoactivation. Photostimulation in (B)–(G) and (I)–(N): 473 nm light, 5 mW, 3 ms pulses, 10 or 20 Hz. Data shown as mean ± SEM. n = 8 and n = 5 neurons in (B) and (I), respectively. ns, non-significant; ∗∗∗p < 0.001 by paired Student’s t test. See also Figures S5 and S6.
Figure 7
Figure 7
Attenuation of Pericyte-Derived Scarring Promotes Functional Recovery after Spinal Cord Injury (A and B) Percentage of hind limb errors in the horizontal ladder test (A) and regularity index of step sequence using Catwalk automated gait analyses (B) after dorsal hemisection. (C) Schematics and experimental outline for ChR2-assisted in vivo behavioral testing. (D) Number of hind paw strokes in response to sensorimotor cortex photoactivation (3 × 10 s = 30 s in total). (E and G) Percentage of ChR2-GFP+ CST (E) and 5-HT (G) axon density. (F and H) Correlation between light-induced hind paw strokes and percentage of ChR2-GFP+ CST axons (F) or 5-HT axon density (H). Data shown as mean ± SEM. n = 8 (vehicle), n = 10 (Tam) animals in (A) and (B) and n = 5 (Uninj., GFP), n = 4 (Uninj., ChR2-GFP), n = 7 (SCI vehicle, ChR2-GFP), n = 7 (SCI Tam, ChR2-GFP) animals in (D)–(H). ns, non-significant; ∗∗p < 0.01, ∗∗∗∗p < 0.0001 by two-sided, unpaired Student’s t test in (D), (E), and (G). Two-way RM ANOVA: main effect of group, F(1,16) = 9.546, p = 0.0070 in (A) and main effect of group, F(1,16) = 11.004, p = 0.0043 in (B). Holm-Sidak post hoc test, p < 0.05, ∗∗p < 0.01, ∗∗∗p < 0.001 in (A) and (B). See also Figure S7 and Movies S1 and S2.
Figure S7
Figure S7
Attenuation of Pericyte-Derived Scarring Facilitates CST and RST Regeneration after Spinal Cord Injury, Related to Figure 7 (A and B) Correlation between the number of regenerated CST axons at the lesion core and the percentage of scar core occupied by PDGFRβ+ stromal cells (A) or percentage of hind limb errors in the horizontal ladder test (B), 18 wpi. (C) Coronal view of the uninjured spinal cord at high thoracic level showing ChR2-GFP+ CST axon bundles running along the dorsal and dorsolateral funiculi and dense collateral innervation of the gray matter. (D) Close up of the uninjured spinal cord depicting ChR2-GFP+ CST axon bundles exiting the main dCST and branching out to densely innervate the dorsal and intermediate gray matter. (E and F) Cross sections of spinal cord from Glast-Rasless animals at 18 wpi illustrating the absence or presence of regenerated ChR2-GFP+ CST axons 0.5 mm caudal to lesions of vehicle (E) or Tam (F) animals, respectively. (G–R) Co-immunostaining of 5-HT raphespinal fibers, ChAT-expressing motor neurons and synaptophysin-positive synaptic vesicles in coronal sections of the spinal cord ventral horn of uninjured (G-J) and injured vehicle (K-N) and Tam (O-R) animals 4 mm caudal to the lesion 18 wpi. G-J; K-N and O-R depict paired images. dCST, dorsal corticospinal tract; dGM, dorsal gray matter; iGM, intermediate gray matter. n = 8 (vehicle), n = 10 (Tam) animals in A, B. Scale bars represent 500 μm (C), 100 μm (D-F), 50 μm (G, K, O) and 25 μm (H-J, L-N, P-R).

Comment in

  • To Scar or Not to Scar.
    Narang A, Zheng B. Narang A, et al. Trends Mol Med. 2018 Jun;24(6):522-524. doi: 10.1016/j.molmed.2018.04.007. Epub 2018 May 2. Trends Mol Med. 2018. PMID: 29729835 Free PMC article.

Similar articles

Cited by

References

    1. Anders S., Huber W. Differential expression analysis for sequence count data. Genome Biol. 2010;11:R106. - PMC - PubMed
    1. Anders S., Pyl P.T., Huber W. HTSeq--a Python framework to work with high-throughput sequencing data. Bioinformatics. 2015;31:166–169. - PMC - PubMed
    1. Anderson M.A., Burda J.E., Ren Y., Ao Y., O’Shea T.M., Kawaguchi R., Coppola G., Khakh B.S., Deming T.J., Sofroniew M.V. Astrocyte scar formation aids central nervous system axon regeneration. Nature. 2016;532:195–200. - PMC - PubMed
    1. Arenkiel B.R., Peca J., Davison I.G., Feliciano C., Deisseroth K., Augustine G.J., Ehlers M.D., Feng G. In vivo light-induced activation of neural circuitry in transgenic mice expressing channelrhodopsin-2. Neuron. 2007;54:205–218. - PMC - PubMed
    1. Arganda-Carreras I., Fernández-González R., Muñoz-Barrutia A., Ortiz-De-Solorzano C. 3D reconstruction of histological sections: Application to mammary gland tissue. Microsc. Res. Tech. 2010;73:1019–1029. - PubMed

Publication types

MeSH terms

Substances