. 2018 Mar 22;173(1):166-180.e14.
doi: 10.1016/j.cell.2018.02.012.

Brain-wide Electrical Spatiotemporal Dynamics Encode Depression Vulnerability

Affiliations

Brain-wide Electrical Spatiotemporal Dynamics Encode Depression Vulnerability

Rainbo Hultman et al. Cell. .

Abstract

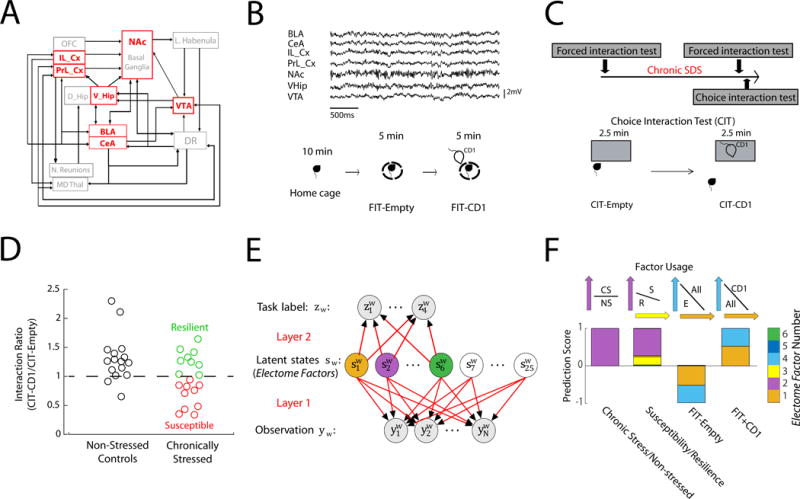
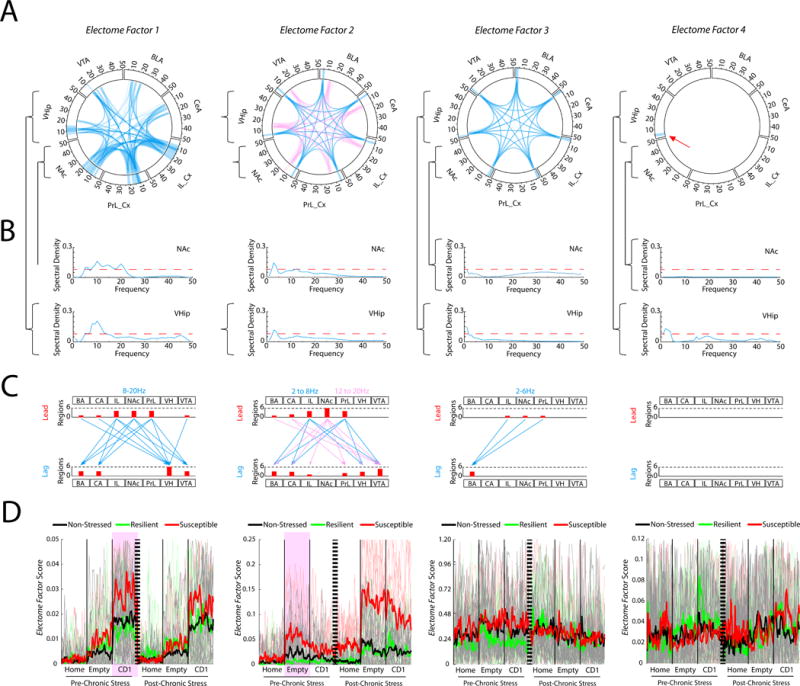
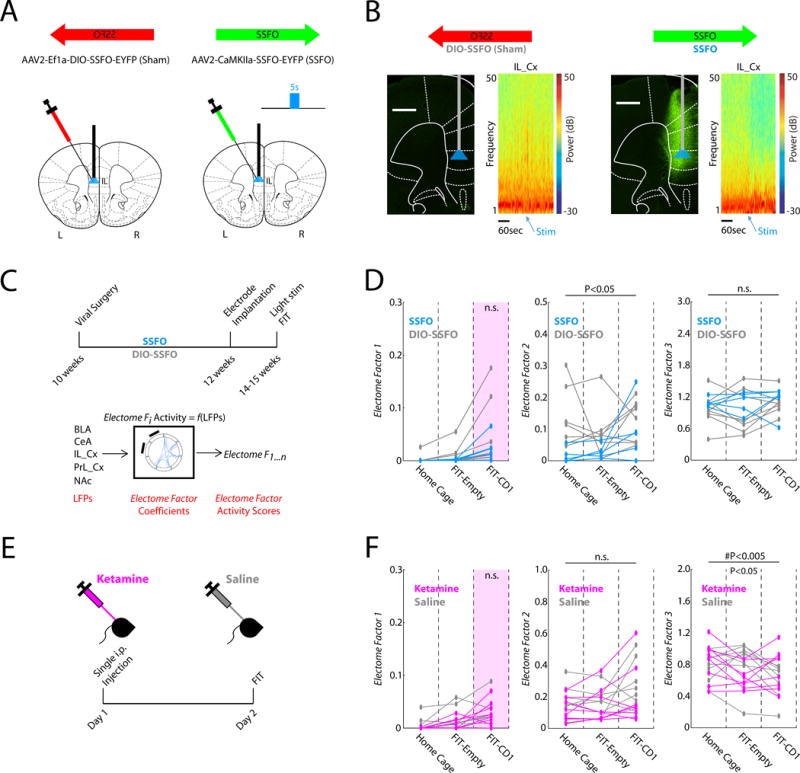
Brain-wide fluctuations in local field potential oscillations reflect emergent network-level signals that mediate behavior. Cracking the code whereby these oscillations coordinate in time and space (spatiotemporal dynamics) to represent complex behaviors would provide fundamental insights into how the brain signals emotional pathology. Using machine learning, we discover a spatiotemporal dynamic network that predicts the emergence of major depressive disorder (MDD)-related behavioral dysfunction in mice subjected to chronic social defeat stress. Activity patterns in this network originate in prefrontal cortex and ventral striatum, relay through amygdala and ventral tegmental area, and converge in ventral hippocampus. This network is increased by acute threat, and it is also enhanced in three independent models of MDD vulnerability. Finally, we demonstrate that this vulnerability network is biologically distinct from the networks that encode dysfunction after stress. Thus, these findings reveal a convergent mechanism through which MDD vulnerability is mediated in the brain.

Keywords: brain; depression; electricity; ketamine; networks; oscillations; spatiotemporal dynamics; stress.


Conflict of interest statement

Declaration of Interests: The authors have no competing financial interests.

Figures

Figure 1
Figure 1. Identification of stress-related networks using machine learning
A) Partial structural wiring diagram across MDD related brain regions in mice. We recorded from areas shown in red. B) Sample LFP traces recorded concurrently from seven implanted brain areas (top). Homecage—Forced interaction test (FIT) used to probe brain activity during: homecage, placed inside a small sub-chamber in an empty cage, or inside small sub-chamber in a cage with a CD1 mouse (bottom). C) Experimental timeline (top), and schematic of choice interaction test (CIT) to identify susceptible vs. resilient mice after cSDS (bottom). D) Choice interaction ratios after 10 days of cSDS compared to non-stress controls. E) Cross-spectral factor analysis model where observations are brain features (LFP power, cross-area synchrony, and cross-area phase offsets) that are shared by latent states (networks). These networks coordinate distinct ‘emotional brain states’ represented by a given task label (i.e. susceptibility vs. resilience). We trained 25 descriptive latent networks. Six of these networks were also trained to be predictive F) Four networks/Electome Factors identified using a support vector machine jointly discriminated the stress states (Networks 1, 2, 3, and 4). Example support vectors are shown above.
Figure 2
Figure 2. Four Electome Factors signal distinct stress states
A) Power and coherence measures that compose each network. Brain areas and oscillatory frequency bands ranging from 1 to 50Hz are shown around the rim of the circle plot. The spectral power measures that contribute to each Electome Factor are depicted by the highlights around the rim, and synchrony measures are depicted by the lines connecting the brain regions through the center of the circle. Pink and blue ribbons are used for Electome Factor2 to highlight the two separate frequency bands that compose the factor (Blue, 2-8Hz; Pink, 12-20Hz). B) The NAc and VHip spectral power density plots are shown as examples for each Electome Factor. The red dashed horizontal line identifies the relative spectral density threshold used to depict the Electome Factor plots. C) Phase offset measures that define directionality within each Electome Factor (phase activity is shown at a threshold of 0.1 radians). Histograms quantify the number of lead and lagging circuit interactions for each brain region. D) Electome Factor activation during pre- and post-stress home cage—FIT recordings. The thick colored lines show the average across animals, while the thin lines in the background show the values from individual mice. Two Electome Factors (highlighted by purple) showed test-related statistical differences between susceptible and resilient mice prior to cSDS exposure (P<0.01; n=5–7 mice/group). See also Fig. S1.
Figure 3
Figure 3. Electome Factor activity correlates with brain-wide cellular firing
A) Example neuron waveforms. B–D) Mean firing rates are plotted against wave properties (peak to valley ratio and peak to valley width) for amygdala (basolateral and central), prefrontal cortex (prelimbic and infralimbic cortex), VTA, NAc, and ventral hippocampus. E) Example of PFC neuron that showed significant firing relative to Electome Factor 2 activity in the home cage. F) Population firing relative to Electome Factor activity (N = 644 cells). Yellow bars highlight units that showed firing that correlated with Electome Factor activity. Green bars highlight units that showed anti-correlated firing relative to Electome Factor activity. The percentage of units from each area that show firing correlated with one of the four Electome Factors is shown to the right. The percentage of units across the show correlated firing with each Electome Factor (irrespective of recording site) is shown on the bottom.
Figure 4
Figure 4. VHip-Sdk1 overexpression selectively increases Electome Factor 1 activity in stress-naïve mice
A) Mice were subjected social defeat twice daily for 4 days (i.e. accelerated defeat). The Sdk1 overexpression group exhibited increased susceptibility. B) Experimental schematic for neurophysiological recordings. C) Cannutrode enables site-specific viral injection in chronically implanted mice (left), surgical schematic (middle), and image showing GFP expression in chronically implanted mouse. D) LFPs recorded during the FIT were transformed using the initial dCSFA Electome model/coefficients. E) Sdk1 overexpression in VHip increased Electome Factor 1 activity during the FIT-CD1 (p<0.05 for comparison activity in HSV-Sdk1 and HSV-GFP mice using a one-tailed Wilcoxon rank-sum test). Purple boxes highlight network biomarkers of vulnerability to chronic stress in normal mice (see Fig. 2). F–G) Sdk1 overexpression had no significant effect on F) social interaction or G) immobility during a forced swim test in non-stressed mice. Data are represented as mean ± SEM.
Figure 5
Figure 5. Enhanced Electome Factor 1 activity in two translational models of MDD vulnerability
A) Experimental schematic. B) Chronic IFNα administration reduced social behavior in the classic three-chamber test (^P<0.05 for novel-mouse effect using two-way ANOVA, #P<0.05 using paired t-test, *P=0.05 using unpaired t-test). C) No locomotor differences were observed in the open field (t1,18=0.599, P=0.56 using an unpaired two-tailed t-test; N=10 mice per group). D) Sucrose preference test (*P<0.05 using paired t-test). E) Schematic for neurophysiological experiments. F) Chronic IFNα treatment recapitulated the neurophysiological signature of stress vulnerability identified in Electome Factor 1, but not Electome Factor 2. G) Schematic for ELS paradigm and experimental timeline for neurophysiological testing. H) Impact of ELS and cSDS on social behavior (#P<0.05 for ELS × sub-threshold cSDS interaction effect using two-tailed two-way ANOVA; *P<0.05 using unpaired two-tailed t-test). I) Experimental schematic for in vivo recording experiments. J) ELS mice exhibited higher Electome Factor 1 activity during exposure to a CD1 mouse compared to normally reared controls. No difference was observed in Electome Factor 2 activity. Data are represented as mean ± SEM.
Figure 6
Figure 6. Biologically distinct mechanism underlies MDD vulnerability
A) IL_Cx infection strategy. B) Prominent suppression of IL_Cx gamma (30-50Hz) oscillations was observed after blue light stimulation in animals expressing SSFO. Representative Prefrontal cortex histological images in SSFO mice and DIO-SSFO controls. Broad EYFP labeling was observed in PrL_Cx and IL_Cx in SSFO mice. The light fiber was implanted at the dorsal IL_Cx border. C) Schematic for SSFO experiments. D) Electome Factor activity in SSFO mice compared to the DIO-SSFO sham controls (N=5–8 mice/group). E) Schematic for Ketamine experiment. F) Electome Factor activity in Ketamine treated mice compared to saline treated controls (n=8 mice/group).
Figure 7
Figure 7. Experimental findings a Electome model of MDD vulnerability
A) Summary of experimental findings. Arrows indicate direction of change in Electome Factor scores under conditions on left. Results in green indicate confirmation of experimental hypotheses. B) Putative model of MDD vulnerability and behavioral dysfunction based on experimental observations. Experiences such as early life trauma increase Electome Factor 1 activity which promotes vulnerability. Chronic stress in vulnerable animals increases Electome Factor 2 and 3 activities, yielding MDD pathology. Antidepressants suppress Electome Factor 2 and 3 to reverse behavioral pathology. Manipulations that suppress Electome Factor 1 in stress-naïve mice remain to be discovered.

References

    1. A ÁM, Rosasco L, Lawrence ND. Kernels for vector-valued functions: a review. Foundations and Trends in Machine Learning. 2011:195–266.
    1. Adhikari A, Topiwala MA, Gordon JA. Synchronized Activity between the Ventral Hippocampus and the Medial Prefrontal Cortex during Anxiety. Neuron. 2010;65:257–269. - PMC - PubMed
    1. Bagot RC, Cates HM, Purushothaman I, Lorsch ZS, Walker DM, Wang J, Huang X, Schluter OM, Maze I, Pena CJ, et al. Circuit-wide Transcriptional Profiling Reveals Brain Region-Specific Gene Networks Regulating Depression Susceptibility. Neuron. 2016;90:969–983. - PMC - PubMed
    1. Berton O, McClung CA, Dileone RJ, Krishnan V, Renthal W, Russo SJ, Graham D, Tsankova NM, Bolanos CA, Rios M, et al. Essential role of BDNF in the mesolimbic dopamine pathway in social defeat stress. Science. 2006;311:864–868. - PubMed
    1. Bonaccorso S, Puzella A, Marino V, Pasquini M, Biondi M, Artini M, Almerighi C, Levrero M, Egyed B, Bosmans E, et al. Immunotherapy with interferon-alpha in patients affected by chronic hepatitis C induces an intercorrelated stimulation of the cytokine network and an increase in depressive and anxiety symptoms. Psychiatry Res. 2001;105:45–55. - PubMed

Publication types

MeSH terms