. 2018 Mar 22;173(1):104-116.e12.
doi: 10.1016/j.cell.2018.02.014. Epub 2018 Mar 1.

Regulation of Cell Cycle to Stimulate Adult Cardiomyocyte Proliferation and Cardiac Regeneration

Affiliations

Regulation of Cell Cycle to Stimulate Adult Cardiomyocyte Proliferation and Cardiac Regeneration

Tamer M A Mohamed et al. Cell. .

Abstract

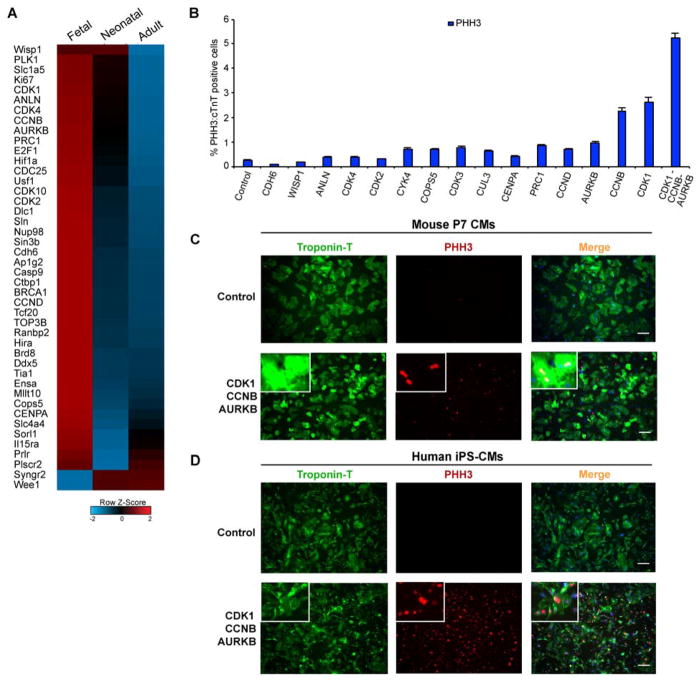
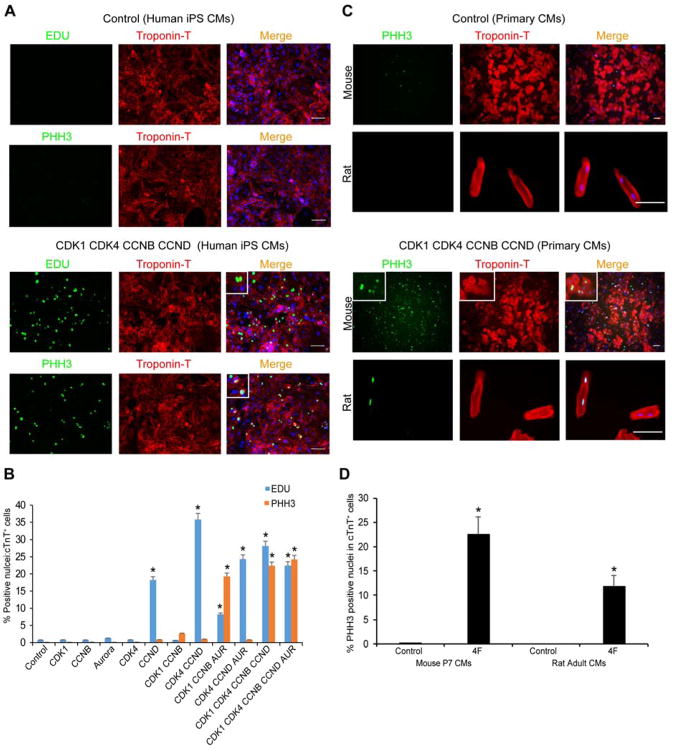
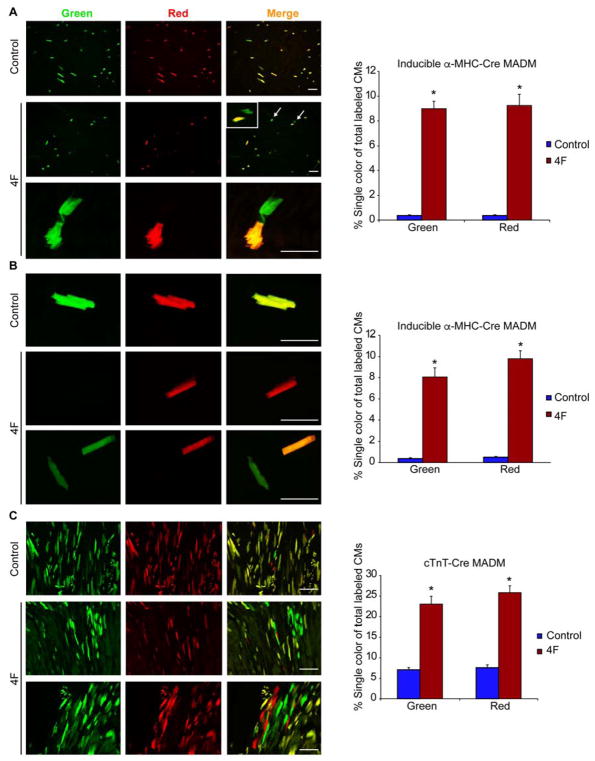
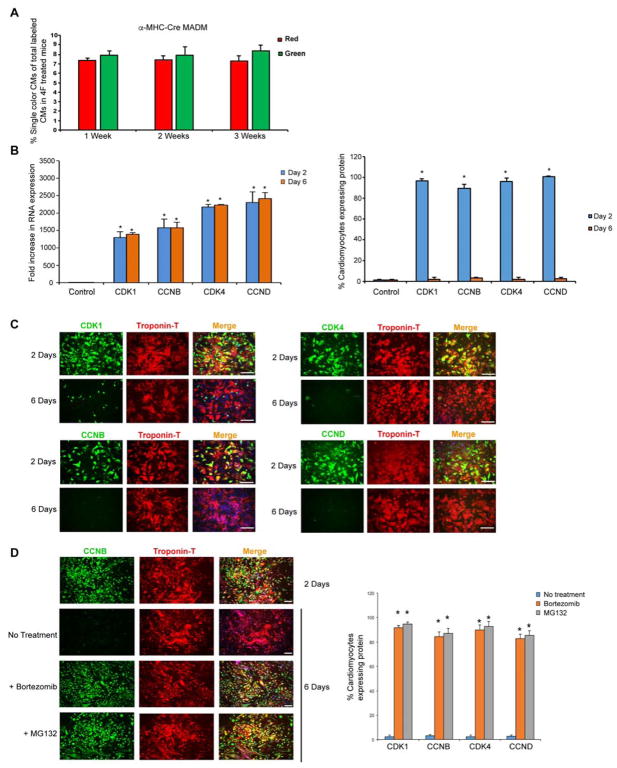
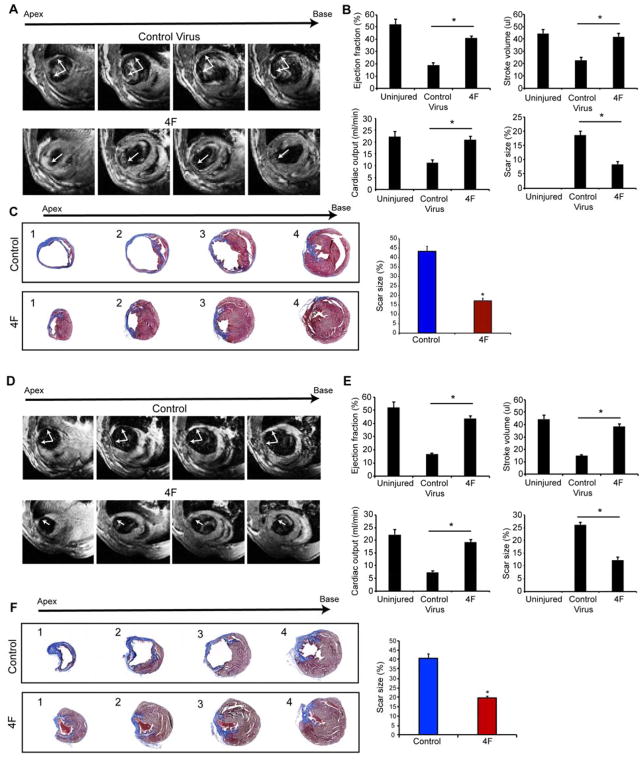
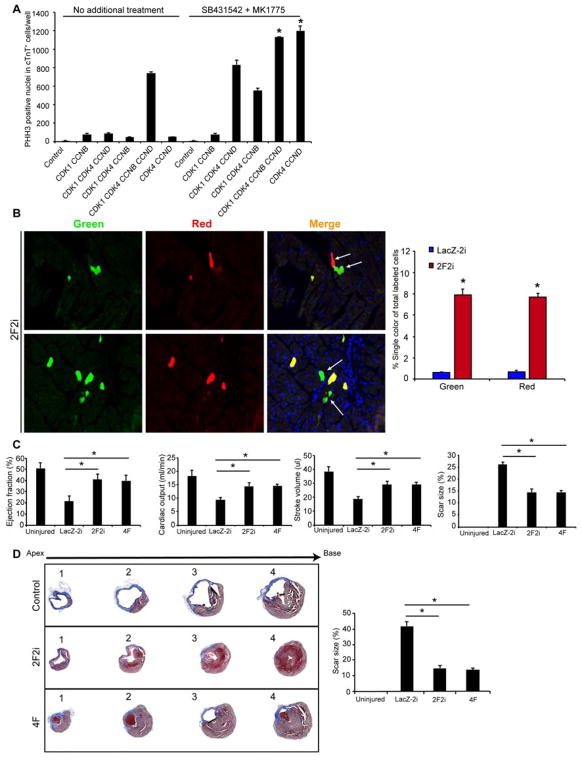
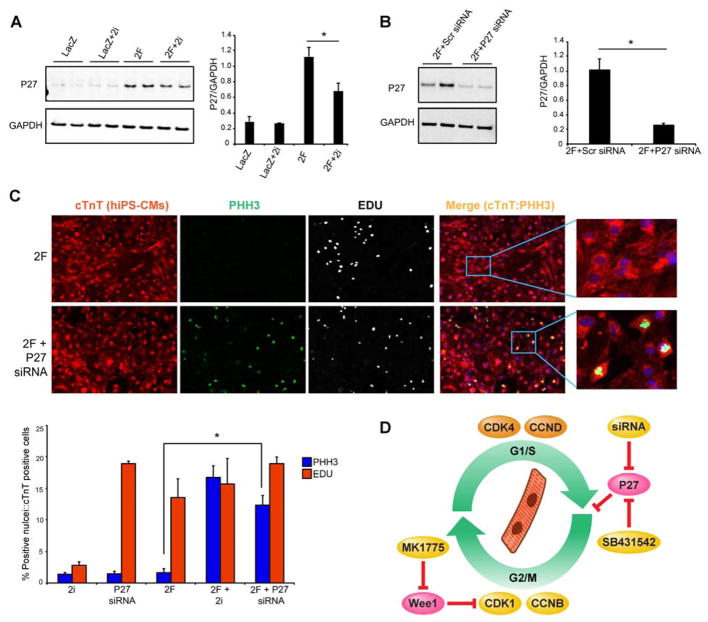
Human diseases are often caused by loss of somatic cells that are incapable of re-entering the cell cycle for regenerative repair. Here, we report a combination of cell-cycle regulators that induce stable cytokinesis in adult post-mitotic cells. We screened cell-cycle regulators expressed in proliferating fetal cardiomyocytes and found that overexpression of cyclin-dependent kinase 1 (CDK1), CDK4, cyclin B1, and cyclin D1 efficiently induced cell division in post-mitotic mouse, rat, and human cardiomyocytes. Overexpression of the cell-cycle regulators was self-limiting through proteasome-mediated degradation of the protein products. In vivo lineage tracing revealed that 15%-20% of adult cardiomyocytes expressing the four factors underwent stable cell division, with significant improvement in cardiac function after acute or subacute myocardial infarction. Chemical inhibition of Tgf-β and Wee1 made CDK1 and cyclin B dispensable. These findings reveal a discrete combination of genes that can efficiently unlock the proliferative potential in cells that have terminally exited the cell cycle.

Keywords: CDK; cardiomyocyte; cell cycle; cell division; cyclin; cytokinesis; heart; heart failure; proliferation; regeneration.


Conflict of interest statement

DECLARATION OF INTERESTS

A patent application by T.M.A Mohamed and D. Srivastava entitled “Method for Inducing Cell Division of Cardiomyocytes” has been filed (published PCT Application Number: WO2016/164371).

Figures

Figure 1
Figure 1. Screening of Fetal Cell-Cycle Genes that Can Promote Cardiomyocyte Phospho-histone 3 (PHH3) expression
(A) Row normalized Z-score heatmap (average of n=3) shows selected transcriptome data for differentially expressed genes related to cell-cycle regulation between fetal (E10.5), neonatal (P1) and adult (8-week-old) mouse hearts. (B) Bar graph shows the percentage of cardiomyocyte (cTnT+) nuclei positive for phospho-histone H3 (PHH3) 48 hours after adenoviral infection to overexpress the indicated protein in post-natal day 7 (P7) primary mouse cardiomyocytes. (C, D) Immunocytochemistry of P7 primary mouse cardiomyocytes (C) or 60-day-old human iPS–derived cardiomyocytes (D) infected with a control adenovirus or CDK1-CCNB-AURORA expressing adenoviruses and immunostained 48 hours later with antibodies to PHH3 (red), cardiac Troponin T (green) and DAPI (blue) to mark nuclei; insets represent higher magnification of cells. Also, see Figure S1.
Figure 2
Figure 2. CDK1-CDK4-CCNB-CCND Induces EDU- and PHH3-Positive Human, Mouse and Rat Cardiomyocytes In Vitro
(A) Representative immunocytochemistry images of PHH3, EDU, cardiac TroponinT (cTnT) and Dapi in 60-day-old human iPS-derived cardiomyocytes (iPS-CMs) 48 hours after control or CDK1-CDK4-CCNB-CCND (4F) viral infection, shown with higher magnification insets. (B) Quantification of EDU+:cTnT+ or PHH3+:cTnT+ nuclei among CMs in response to overexpression of the indicated proteins in 60-day-old human iPS-CMs (n=3 independent experiments, *p<0.05). (C) Representative immunocytochemistry of P7 primary mouse cardiomyocytes (top rows) and 4-month-old adult rat cardiomyocytes (lower rows) infected with LacZ (Control, top panel) or 4F (CDK1-CDK4-CCNB-CCND, lower panel) expressing adenoviruses and stained 48 hours later with PHH3 (green), cTnT (red) and DAPI nuclear stain (blue); insets represent higher magnification. (D) Quantification of mouse or rat cTnT+ cardiomyocytes that were PHH3+ as a percentage of total cTnT+ cells (n=260 cells cTnT+ counted for each type). Bars represent average of three experiments and error bars indicate SEM (*p<0.05). Also, see Figure S1.
Figure 3
Figure 3. Mosaic Analysis of Double Markers (MADM) Genetically Label Cardiomyocytes after Cell Division and Reveal Cytokinesis In Vivo with 4F
(A, B) Representative immunofluorescence images and quantification of single colored (red or green) cells, indicating cardiomyocytes that underwent cytokinesis, in α-MHC MER-CRE-MER MADM mice in histological sections (A) or isolated cardiomyocytes (B) after Cre-induction in 4-month-old adult mice. Lower panel in (A) represents higher magnification. Colorless or double-labeled cells were indeterminate for cytokinesis. Mice were injected intramyocardially with adenoviruses encoding CDK1, CCNB, CDK4, and CCND (4F) or control Lac-Z virus at the time of MI induction (n=6–8 animals in each group, (8000 cells analyzed/group) *p<0.05). (C) Representative images and quantification of single-colored cardiomyocytes in constitutive (cTnT)-CRE MADM mice with control or 4F viral infection after MI (n=3 animals in each group, (8000 cells analyzed/group) *p<0.05). 4F rows in (B) and (C) indicate distinct cells or histologic areas. Bars indicate average of experiments with SEM; student t-Test was used to compare between the two groups. Also, see Figure S2–S6.
Figure 4
Figure 4. Cardiomyocytes Degrade Overexpressed Cell-Cycle Proteins over Time in a Proteasome-Dependent Manner
(A) Quantification of single-colored cells in α-MHC-Cre MADM mice 1, 2 and 3 weeks after coronary ligation and 4F infection. After the initial increase in number of single-colored cells during the first week, there was no further increase (n=600 cells analyzed from four animals in each group). (B) Bar graphs show RNA expression (left panel) and protein expression (right panel) of the overexpressed cell cycle genes at 2 and 6 days after infection (n=3, *p<0.05). (C) Representative immunofluorescence images and quantification for indicated protein (green) and cardiac Troponin-T (red) over time demonstrates a decline in the overexpressed protein expression by day 6 after adenoviral infection of each (n=3 independent experiments, *p<0.05). (D) Representative images (for CCNB) and quantification of cTnT+ cardiomyocytes treated with proteosome inhibitors (Bortezomib or MG132) for 48 hours starting at day 4 demonstrate persistent protein expression of the overexpressed cell cycle genes at day 6 (n=3, *p<0.05) in the presence of proteosome inhibitors. Bars indicate means and SEM. Also, see Figure S7.
Figure 5
Figure 5. CDK1:CCNB:CDK4:CCND (4F) Expression Enhances Cardiac Function in Mice after Acute or Sub-Acute Myocardial Infarction
(A) Representative transverse magnetic resonance images (MRI) 12 weeks after myocardial infarction and adenovirus injection at the time of the infarction shows ventricular wall thinning at the infarct site in the control group with improvement in animals that received the 4F (arrows). Multiple images from the bottom (apex) to the top of the ventricular chambers (base) are shown. (B) Ejection fraction, stroke volume, cardiac output and scar size (through all heart slices), as measured by blinded MRI, were significantly improved in 4F-treated mice, compared to control mice (n=9, *p<0.05). (C) Representative histological sections through multiple levels of the heart (apex (1) towards base (4)) with Masson’s Trichrome staining showing the scar tissue in blue and the healthy myocardium in red, with and without 4F treatment. Bar graph shows the quantification of scar size by histology (through levels 1–4 as described in the methods) (n=9, *p<0.05). Bars indicate means and error bars indicate SEM. Student t-Test was used to compare between the two groups. (D) Representative MRI images 12 weeks after myocardial infarction and virus injection 1 week after infarction shows the wall thinning at the infarct site in the control group, which was improved in the animals that received the 4F. (E) Ejection fraction, stroke volume, cardiac output and scar size as measured by MRI, were significantly improved in 4F-treated mice compared to control mice (n=9, *p<0.05). Bars indicate means with SEM. (F) Representative histological sections through multiple levels of the heart with Masson’s Trichrome staining, with and without 4F treatment delivered one week after injury. Bar graph shows the quantification of scar size by histology (n=9, *p<0.05). Also, see Figure S7.
Figure 6
Figure 6. CDK4 and CCND, with Transient Wee1 and TGFβ Inhibition (2F2i), Induces Cardiomyocyte Proliferation and Enhances Cardiac Function after Injury
(A) Histograms quantifying the number of PHH3+ nuclei in cTnT+ human iPS-CMs upon expression of indicated combinations of factors in the presence or absence of a Wee1 inhibitor (MK1775) and a TGFβ inhibitor (SB431542) (*p<0.05). (B) Representative immunofluorescence images and quantification of single colored (red or green) cells in histologic sections of α-MHC MER-CRE-MER MADM mice, indicating cardiomyocytes that underwent cytokinesis (n=4 animals in each group *p<0.05). (C) Ejection fraction, stroke volume, cardiac output and scar size (through all ventricular heart slices), as measured by blinded MRI after 3 months, were similarly improved in 2F2i and 4F-treated mice compared to control mice (n=8, *p<0.05). (D) Representative histological sections through multiple levels of the heart (apex [1] towards base [4]) with Masson’s Trichrome staining showing the scar tissue in blue and the healthy myocardium in red, with LacZ-2i, 2F2i, or 4F treatment. Bar graph shows quantification of scar size by histology (through levels 1–4 as described in the methods) (n=8, *p<0.05). Bars represent means and error bars indicate SEM. One-way ANOVA was used to compare between the three groups.
Figure 7
Figure 7. Wee1 and TGFβ Inhibition (2i) Limit P27 Activation Induced by CDK4 and CCND
(A) Representative western blots and quantification for P27 expression in human iPS-CMs overexpressing either LacZ control virus, or 2F (CDK4/CCND) in the presence or absence of the 2i after 48 hours (n=3 independent experiments, *p<0.05). Bars indicate average ratio of image density for each protein band relative to GAPDH intensity, with SEM. (B) Representative western blots and quantification of P27 knockdown using P27 siRNA vs scrambled (Scr) control siRNA (n=3 independent experiments, *p<0.05). (C) Representative images and quantification for EDU incorporation and histone H3 phosphorylation (PHH3) to examine the effect of knocking down P27 using siRNA compared to 2i in the setting of 2F introduced into human iPS-CMs (n=3 independent experiments, *p<0.05). (D) Summary of findings showing that a combination of four cell cycle regulators can induce cytokinesis of mature cardiomyocytes in vitro and in vivo resulting in repair of damaged hearts. Similar results were obtained with only two cell cycle regulators (CDK4/CCND) and either inhibition of Wee1 using MK1775 and Tgf-β using SB431542, or P27 knockdown with siRNA.

Comment in

  • Regeneration: Mending broken hearts.
    Strzyz P. Strzyz P. Nat Rev Mol Cell Biol. 2018 May;19(5):277. doi: 10.1038/nrm.2018.18. Epub 2018 Mar 7. Nat Rev Mol Cell Biol. 2018. PMID: 29511343 No abstract available.
  • Regeneration: Mending broken hearts.
    Strzyz P. Strzyz P. Nat Rev Cardiol. 2018 May;15(5):253. doi: 10.1038/nrcardio.2018.30. Epub 2018 Mar 22. Nat Rev Cardiol. 2018. PMID: 29565034 No abstract available.
  • To Be Young at Heart.
    Hsieh PCH, Kamp TJ. Hsieh PCH, et al. Cell Stem Cell. 2018 Apr 5;22(4):475-476. doi: 10.1016/j.stem.2018.03.003. Cell Stem Cell. 2018. PMID: 29625063

References

    1. Aguirre A, Montserrat N, Zacchigna S, Nivet E, Hishida T, Krause MN, Kurian L, Ocampo A, Vazquez-Ferrer E, Rodriguez-Esteban C, et al. In vivo activation of a conserved microRNA program induces mammalian heart regeneration. Cell Stem Cell. 2014;15:589–604. - PMC - PubMed
    1. Aguirre A, Sancho-Martinez I, Izpisua Belmonte JC. Reprogramming toward heart regeneration: stem cells and beyond. Cell Stem Cell. 2013;12:275–284. - PubMed
    1. Ali SR, Hippenmeyer S, Saadat LV, Luo L, Weissman IL, Ardehali R. Existing cardiomyocytes generate cardiomyocytes at a low rate after birth in mice. Proc Natl Acad Sci U S A. 2014;111:8850–8855. - PMC - PubMed
    1. Ang YS, Rivas RN, Ribeiro AJ, Srivas R, Rivera J, Stone NR, Pratt K, Mohamed TM, Fu JD, Spencer CI, et al. Disease Model of GATA4 Mutation Reveals Transcription Factor Cooperativity in Human Cardiogenesis. Cell. 2016;167:1734–1749. e1722. - PMC - PubMed
    1. Benjamini Y, Hochberg Y. Controlling the False Discovery Rate - a Practical and Powerful Approach to Multiple Testing. J Roy Stat Soc B Met. 1995;57:289–300.

Publication types

MeSH terms