. 2018 Mar 13;10(3):834-847.
doi: 10.1016/j.stemcr.2018.01.039. Epub 2018 Mar 1.

Contractile Work Contributes to Maturation of Energy Metabolism in hiPSC-Derived Cardiomyocytes

Affiliations

Contractile Work Contributes to Maturation of Energy Metabolism in hiPSC-Derived Cardiomyocytes

Bärbel M Ulmer et al. Stem Cell Reports. .

Abstract

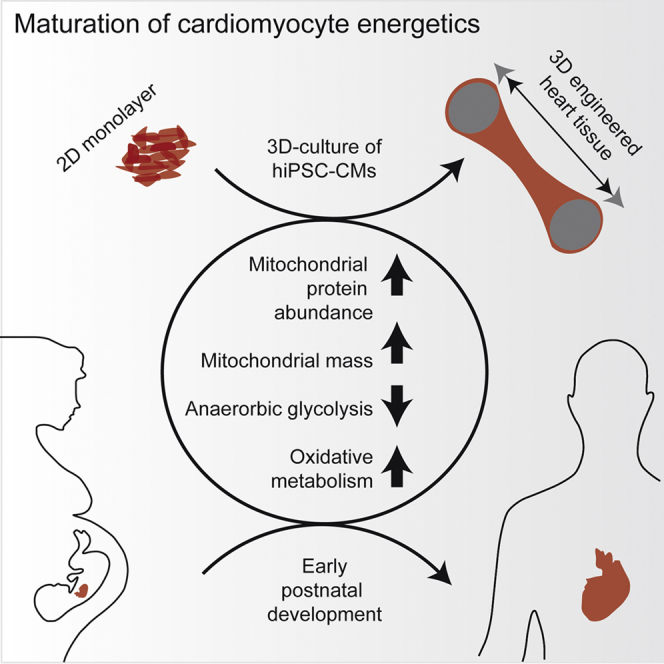
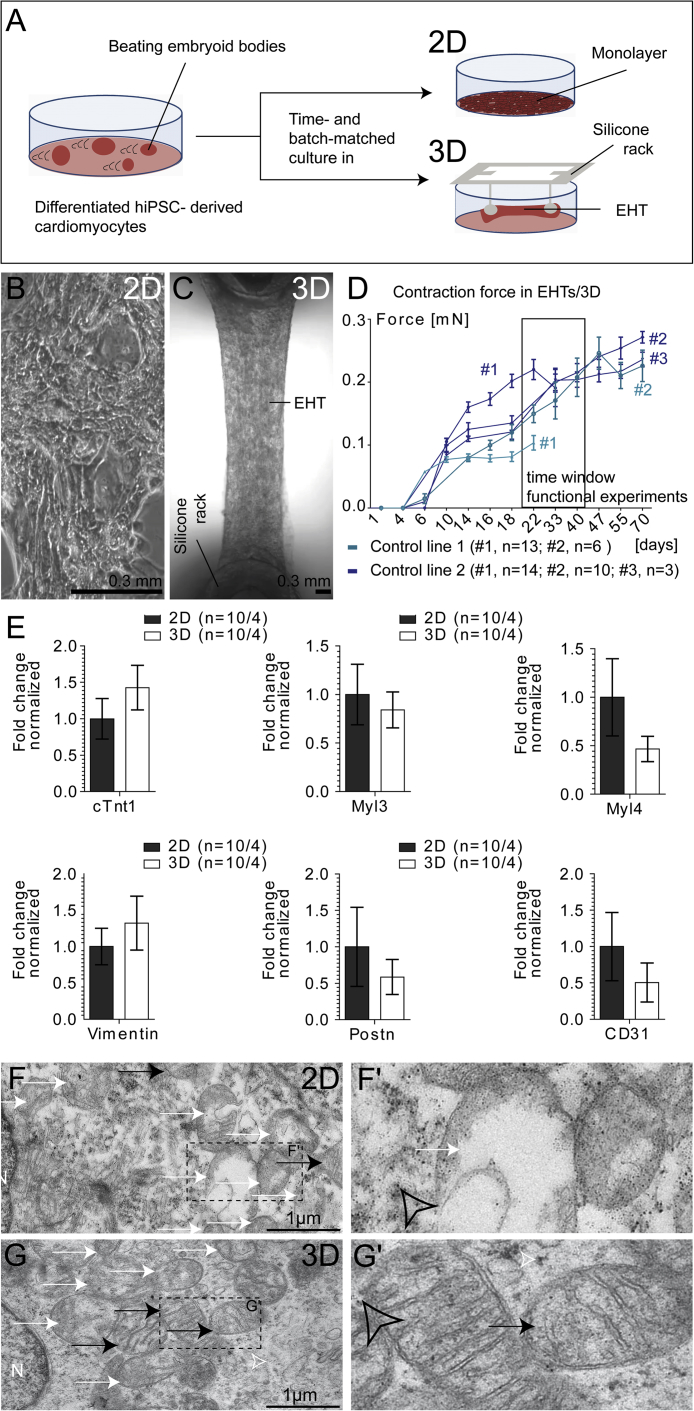
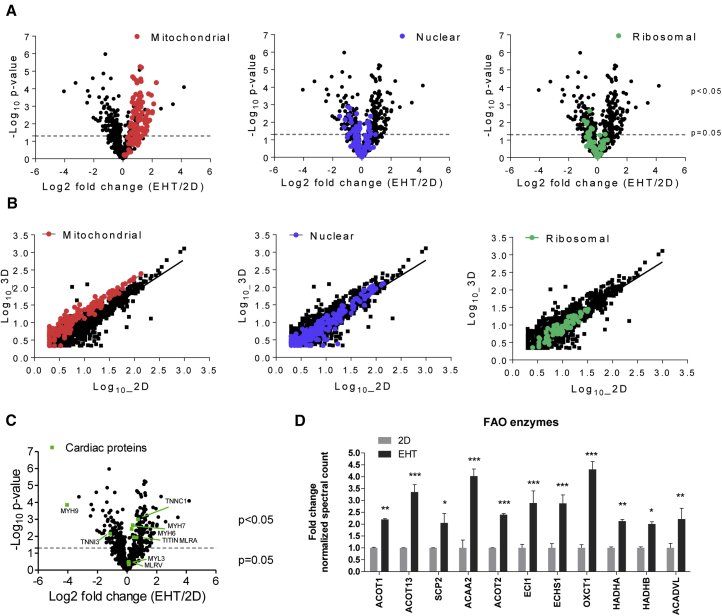
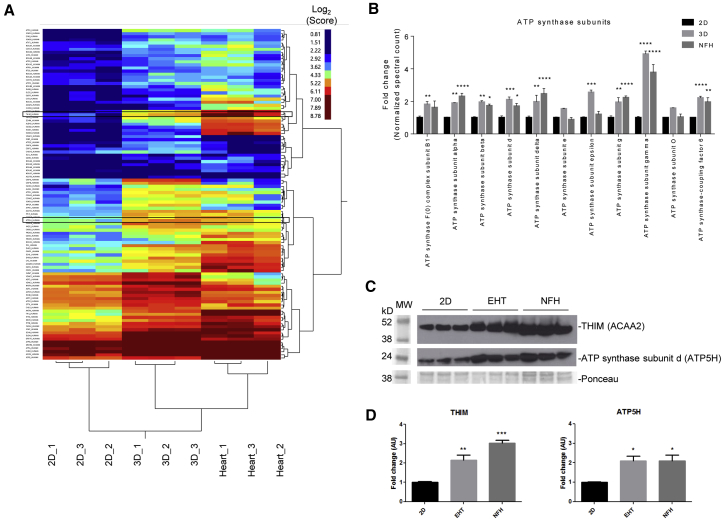
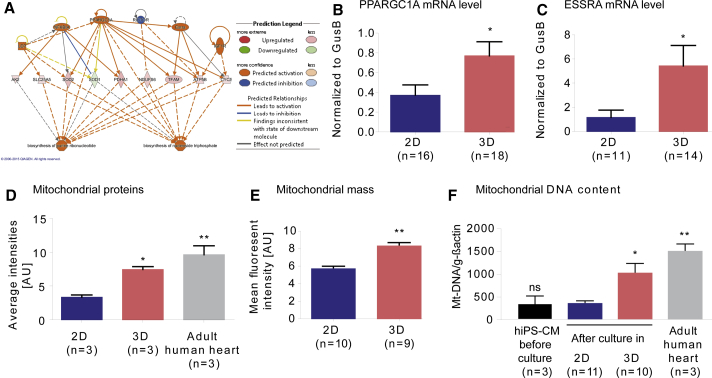
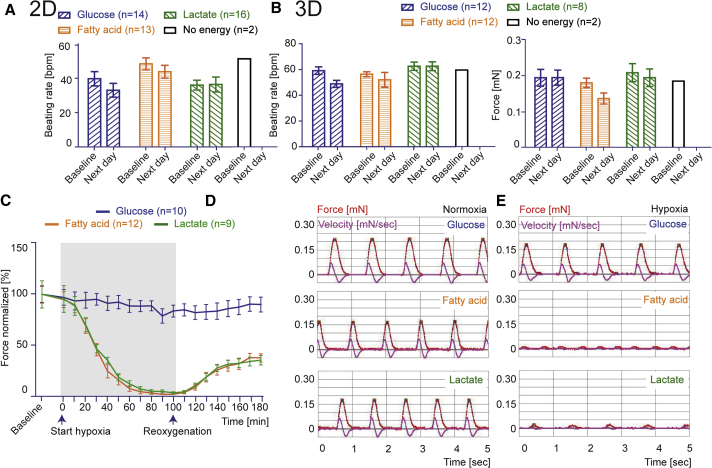
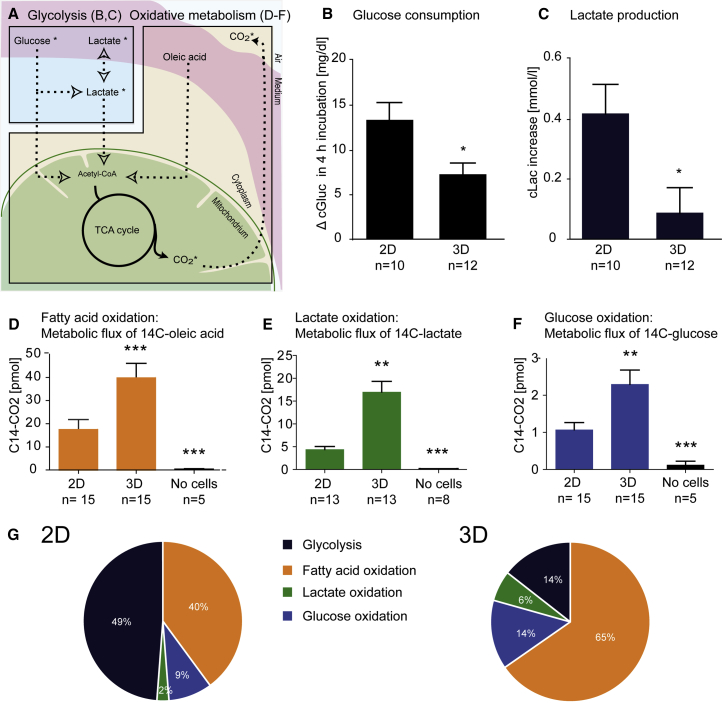
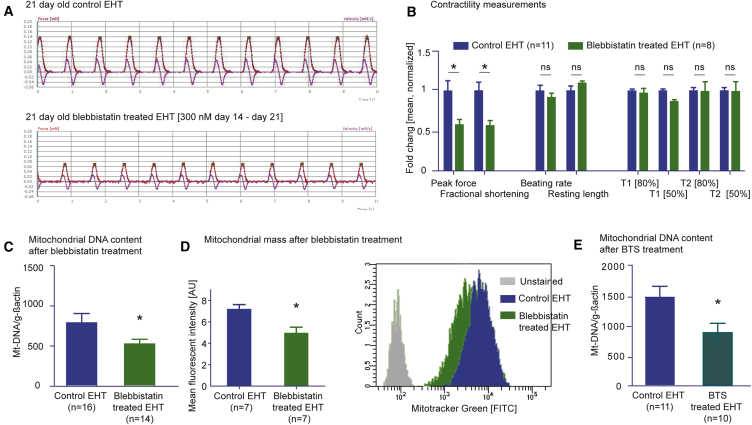
Energy metabolism is a key aspect of cardiomyocyte biology. Human induced pluripotent stem cell-derived cardiomyocytes (hiPSC-CMs) are a promising tool for biomedical application, but they are immature and have not undergone metabolic maturation related to early postnatal development. To assess whether cultivation of hiPSC-CMs in 3D engineered heart tissue format leads to maturation of energy metabolism, we analyzed the mitochondrial and metabolic state of 3D hiPSC-CMs and compared it with 2D culture. 3D hiPSC-CMs showed increased mitochondrial mass, DNA content, and protein abundance (proteome). While hiPSC-CMs exhibited the principal ability to use glucose, lactate, and fatty acids as energy substrates irrespective of culture format, hiPSC-CMs in 3D performed more oxidation of glucose, lactate, and fatty acid and less anaerobic glycolysis. The increase in mitochondrial mass and DNA in 3D was diminished by pharmacological reduction of contractile force. In conclusion, contractile work contributes to metabolic maturation of hiPSC-CMs.

Keywords: developmental hypertrophy; engineered heart tissue; human induced pluripotent stem cell-derived cardiomyocytes; maturation; metabolism.


Figures

None
Graphical abstract
Figure 1
Figure 1
2D and 3D Culture of Human Induced Pluripotent Stem Cell-Derived Cardiomyocytes (A) Schematic depiction of experimental setup. (B and C) Bright-field image of representative 2D and 3D hiPSC after 3 weeks; still frame from Movie S1. (D) Force development of 3D hiPSC-CMs. Black frame indicates time window for functional analyses. (E) qPCR results of 2D and 3D hiPSC-CMs for cardiomyocyte (MYL3, MYL4, cTNT1), fibroblast (vimentin, POSTN), and endothelial (CD31) markers. (F and G) Transmission electron microscopy (TEM) pictures in 2D compared with 3D hiPSC-CMs (black arrow, mitochondria; white arrow, degenerated mitochondria). (F′) and (G′) are blow-ups of dashed boxes in (F) and (G) (open arrowheads: glycogen granules); samples prepared from one experiment. n denotes biological replicates/independent experiments of both control cell lines; error bars show means ± SEM. Related data are depicted in Figure S1 and Movie S1.
Figure 2
Figure 2
Quantitative Analysis of Proteomic Profiles of Human iPSC-Derived 2D or EHT Samples (A) Volcano plots to compare the mean log2 fold changes (EHT/2D) of normalized spectral counts and the log10 of the p values obtained in t test comparison. Protein classes are highlighted. Note the strong presence of mitochondrial proteins in 3D samples. (B) Scatterplots demonstrating the mean log10 normalized spectral counts of 2D and 3D hiPSC-CMs. Proteins enriched in 3D are located above the line of best fit and vice versa for 2D. Protein classes are highlighted. (C) Volcano plot showing main cardiac proteins highlighted in green. (D) Examples of mitochondrial protein spectral count analysis involved in fatty acid oxidation (FAO) and respiration (data extracted from A). Samples (n = 3 per group) prepared from one experiment. p < 0.05, ∗∗p < 0.01 and ∗∗∗p < 0.001, EHT versus 2D (two-way ANOVA plus Bonferroni post test); error bars show means ± SEM. Related data are depicted in Figure S2.
Figure 3
Figure 3
Comparison of the Mitochondrial Proteome between 2D, 3D, and Non-failing Human Hearts (A) Clustering analysis of mitochondrial proteins for 2D and 3D hiPSCs and non-failing heart samples. Expression levels are depicted as a color code ranging from blue (low expression) to red (high expression). (B–D) Further analysis was performed for a selection of proteins involved in fatty acid oxidation and respiratory chain. (B) Proteome data of ATP synthase subunits. (C) Western blot analysis of 2D, 3D, and NFH for mitochondrial proteins such as 3-ketoacyl-CoA thiolase (ACAA2) and ATP synthase subunit d (ATP5H) (framed in A) in comparison with Ponceau staining. (D) Quantification of western blot analysis in (C). Samples (n = 3 per group) prepared from one experiment. p < 0.05, ∗∗p < 0.01, ∗∗∗p < 0.001, and ∗∗∗∗p < 0.001 versus 2D (one-way ANOVA plus Bonferroni post test); error bars show means ± SEM. Related data are depicted in Figure S3.
Figure 4
Figure 4
Expression of Mitochondrial Biogenesis-Related PGC-1α Signaling Pathway and Mitochondrial Protein, Mass, and DNA Content in hiPSC-CMs (A) Analysis of “Regulator Effects” by IPA of proteins significantly different between 2D and 3D: highest consistency score for effector network involved in the biosynthesis of purine ribonucleotides and nucleoside triphosphates and directed by PPARGC1/PGC-1α and ESSRA, among other proteins. (B and C) qRT-PCR for PPARGC1/PGC-1α (B) and ESSRA (C). (D) Average intensity (normalized spectral counts as a measure for relative protein abundance) between samples of mitochondrial proteins detected by quantitative proteomics in hiPSC-CMs cultured in 2D or 3D compared with non-failing heart; protein must be identified in at least 2 out of 9 samples. (E) Quantification of flow cytometry with MitoTracker Green FM of 2D versus 3D CMs. (F) PCR amplification of genomic DNA for the mitochondrial encoded NADH dehydrogenase (Mt-ND1/2), normalized to the nuclear encoded gene actin, human heart samples (1× non-failing, 2× terminal heart failure). n denotes biological replicates, ≥3 independent experiments of both control cell lines. p < 0.05 and ∗∗p < 0.01 versus 2D (two-tailed unpaired t test, B, C, and E; error bars show means ± SEM). p < 0.05 and ∗∗p < 0.01 versus 2D (one-way ANOVA plus Bonferroni post test, D and F; error bars show means ±SEM; ns, not significant). Related data are depicted in Figure S4.
Figure 5
Figure 5
Metabolic Ability of 2D CMs and 3D CMs (A) Beating rate for hiPSC-CMs of both control cell lines in 2D. (B) Beating rate and contractile force for hiPSC-CMs of both control cell lines in 3D in feeding medium containing only one energy source for 20 hr, 1 mM fatty acid, 1 mM lactate, 5 mM glucose, or no energy substrate. (C–E) Normalized force development (C) and original recordings (D and E) of 3D hiPSC-CMs during 100 min of hypoxia treatment (gray box) and reoxygenation. n denotes biological replicates from three independent experiments of both control cell lines; error bars show means ± SEM. Related data are depicted in Figure S5 and Movie S2.
Figure 6
Figure 6
Lactate Production and Oxidative Metabolism in hiPSC-CMs (A) Schematic depiction of metabolic processes. Glycolysis was analyzed in (B) and (C), and oxidative metabolism in (D) to (G). (B and C) Cell culture media concentration of glucose (cGluc) and lactate (cLac) after 4 hr of incubation in complete medium. Glucose consumption (B) and lactate production (C) in 2D and 3D hiPSC-CMs. (D–F) Analysis of metabolic flux for radioactive 14C-labeled oleic acid (D), [14C]lactate (E), or [14C]glucose (F) after 4 hr of incubation. (G) Calculated relative amount of ATP produced by oxidative metabolism and glycolysis. n denotes biological replicates from three independent experiments. p < 0.05 versus 2D (two-tailed unpaired t test, B and C; error bars show means ± SEM). ∗∗p < 0.01 and ∗∗∗p < 0.001 versus 2D (one-way ANOVA plus Bonferroni post test, D–F; error bars show means ± SEM). Related raw data of individual experiments are depicted in Figure S6.
Figure 7
Figure 7
Analysis of Mitochondrial Biogenesis after Pharmacological Reduction of Force (A) Original recordings of EHTs ± myosin II inhibitor blebbistatin (300 nM) for 7 days from day 14 to day 21. (B) Comparison of contractility parameter of EHTs incubated ± blebbistatin (300 nM) on day 21. (C) PCR amplification of genomic DNA for Mt-ND1/2, normalized to the nuclear encoded gene actin of 3D ± blebbistatin. (D) MitoTracker Green FM FACS of dissociated 3D hiPSC-CMs ± blebbistatin (300 nM). (E) PCR amplification of genomic DNA for Mt-ND1/2, normalized to the nuclear encoded gene actin of 3D ± BTS. n denotes biological replicates from three independent experiments. p < 0.05 versus 2D (two-tailed unpaired t test); error bars show means ± SEM. Related raw data of individual experiments are depicted in Figure S7.

References

    1. Bhute V.J., Bao X., Dunn K.K., Knutson K.R., McCurry E.C., Jin G., Lee W.H., Lewis S., Ikeda A., Palecek S.P. Metabolomics identifies metabolic markers of maturation in human pluripotent stem cell-derived cardiomyocytes. Theranostics. 2017;7:2078–2091. - PMC - PubMed
    1. Birket M.J., Casini S., Kosmidis G., Elliott D.A., Gerencser A.A., Baartscheer A., Schumacher C., Mastroberardino P.G., Elefanty A.G., Stanley E.G. PGC-1α and reactive oxygen species regulate human embryonic stem cell-derived cardiomyocyte function. Stem Cell Reports. 2013;1:560–574. - PMC - PubMed
    1. Birket M.J., Ribeiro M.C., Kosmidis G., Ward D., Leitoguinho A.R., van de Pol V., Dambrot C., Devalla H.D., Davis R.P., Mastroberardino P.G. Contractile defect caused by mutation in MYBPC3 revealed under conditions optimized for human PSC-cardiomyocyte function. Cell Rep. 2015;13:733–745. - PMC - PubMed
    1. Breckwoldt K., Letuffe-Brenière D., Mannhardt I., Schulze T., Ulmer B., Werner T., Benzin A., Klampe B., Reinsch M.C., Laufer S. Differentiation of cardiomyocytes and generation of human engineered heart tissue. Nat. Protoc. 2017;12:1177–1197. - PubMed
    1. Correia C., Koshkin A., Duarte P., Hu D., Teixeira A., Domian I., Serra M., Alves P.M. Distinct carbon sources affect structural and functional maturation of cardiomyocytes derived from human pluripotent stem cells. Sci. Rep. 2017;7:1–17. - PMC - PubMed

Publication types

MeSH terms

LinkOut - more resources