

Altered Peptide Ligands Impact the Diversity of Polyfunctional Phenotypes in T Cell Receptor Gene-Modified T Cells
- PMID: 29503203
- PMCID: PMC6079370
- DOI: 10.1016/j.ymthe.2018.01.015
Altered Peptide Ligands Impact the Diversity of Polyfunctional Phenotypes in T Cell Receptor Gene-Modified T Cells
Abstract
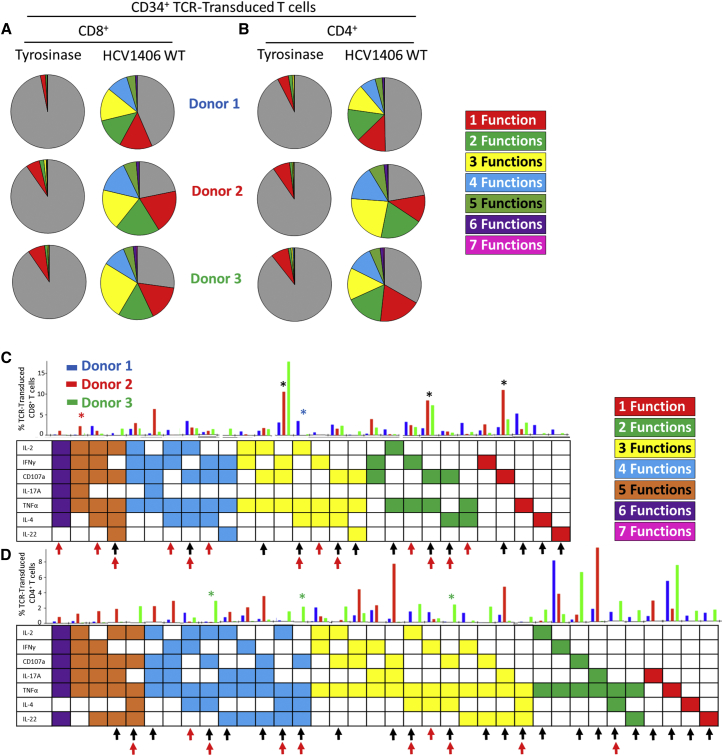
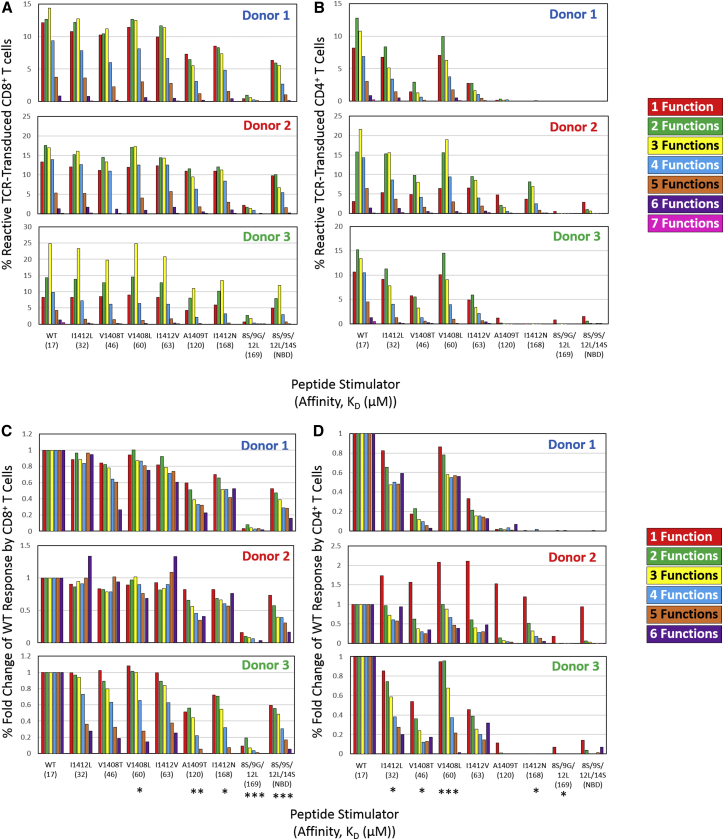
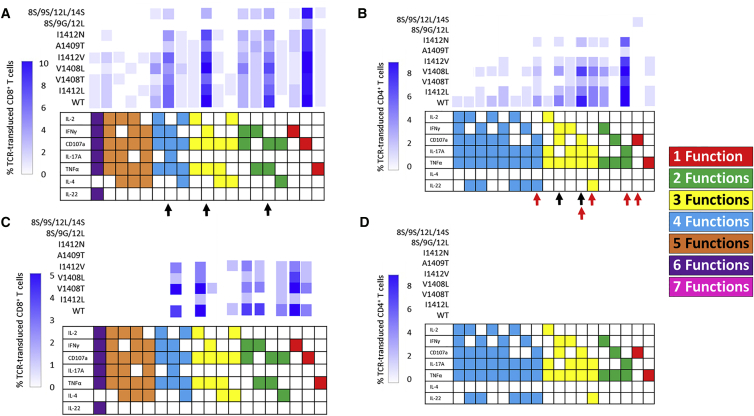
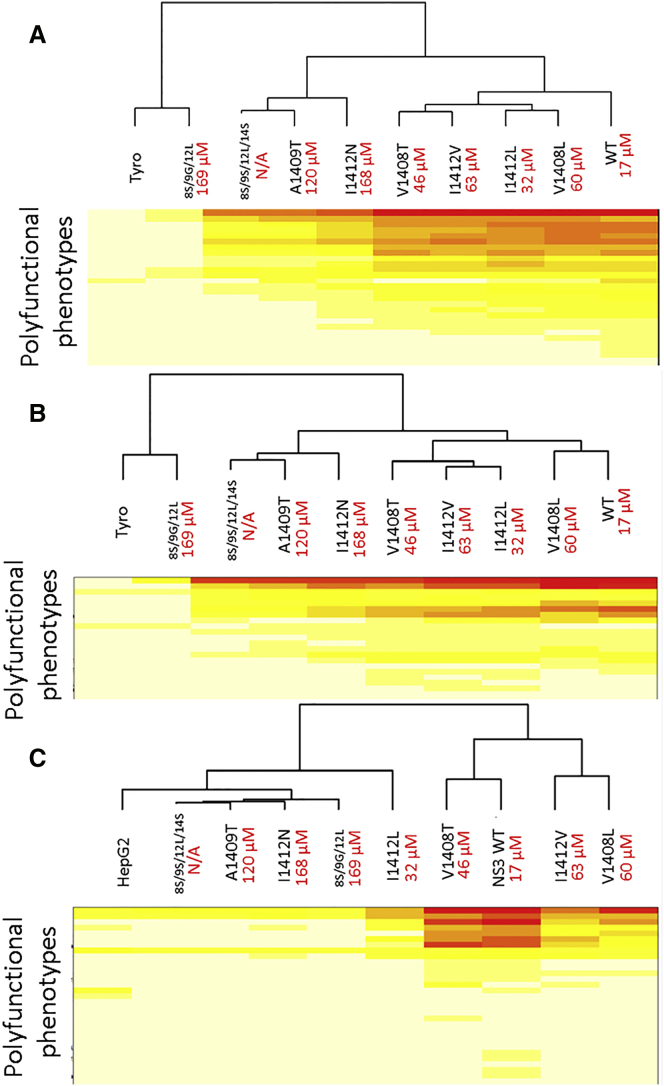
The use of T cell receptor (TCR) gene-modified T cells in adoptive cell transfer has had promising clinical success, but often, simple preclinical evaluation does not necessarily accurately predict treatment efficacy or safety. Preclinical studies generally evaluate one or a limited number of type 1 cytokines to assess antigen recognition. However, recent studies have implicated other "typed" T cells in effective anti-tumor/viral immunity, and limited functional evaluations may underestimate cross-reactivity. In this study, we use an altered peptide ligand (APL) model and multi-dimensional flow cytometry to evaluate polyfunctionality of TCR gene-modified T cells. Evaluating six cytokines and the lytic marker CD107a on a per cell basis revealed remarkably diverse polyfunctional phenotypes within a single T cell culture and among peripheral blood lymphocyte (PBL) donors. This polyfunctional assessment identified unexpected phenotypes, including cells producing both type 1 and type 2 cytokines, and highlighted interferon γneg (IFNγneg) antigen-reactive populations overlooked in our previous studies. Additionally, APLs skewed functional phenotypes to be less polyfunctional, which was not necessarily related to changes in TCR-peptide-major histocompatibility complex (pMHC) affinity. A better understanding of gene-modified T cell functional diversity may help identify optimal therapeutic phenotypes, predict clinical responses, anticipate off-target recognition, and improve the design and delivery of TCR gene-modified T cells.
Keywords: T cell; T cell receptor; adoptive cell therapy; affinity; altered peptide ligand; gene-modified T cells; multi-dimensional flow cytometry; polyfunctionality.
Copyright © 2018 The American Society of Gene and Cell Therapy. Published by Elsevier Inc. All rights reserved.
Figures
Similar articles
-
Immunophenotypic Analysis of CAR-T Cells.Methods Mol Biol. 2020;2086:195-201. doi: 10.1007/978-1-0716-0146-4_14. Methods Mol Biol. 2020. PMID: 31707677
-
Isolation and Characterization of an HLA-DRB1*04-Restricted HPV16-E7 T Cell Receptor for Cancer Immunotherapy.Hum Gene Ther. 2018 Oct;29(10):1202-1212. doi: 10.1089/hum.2018.091. Hum Gene Ther. 2018. PMID: 30136612
-
Chronic TCR-MHC (self)-interactions limit the functional potential of TCR affinity-increased CD8 T lymphocytes.J Immunother Cancer. 2019 Nov 5;7(1):284. doi: 10.1186/s40425-019-0773-z. J Immunother Cancer. 2019. PMID: 31690351 Free PMC article.
-
TCR affinity for p/MHC formed by tumor antigens that are self-proteins: impact on efficacy and toxicity.Curr Opin Immunol. 2015 Apr;33:16-22. doi: 10.1016/j.coi.2015.01.003. Epub 2015 Jan 22. Curr Opin Immunol. 2015. PMID: 25618219 Free PMC article. Review.
-
TCR-Like CAR-T Cells Targeting MHC-Bound Minor Histocompatibility Antigens.Front Immunol. 2020 Feb 28;11:257. doi: 10.3389/fimmu.2020.00257. eCollection 2020. Front Immunol. 2020. PMID: 32184779 Free PMC article. Review.
Cited by
-
Tumor rejection properties of gp100209-specific T cells correlate with T cell receptor binding affinity towards the wild type rather than anchor-modified antigen.Mol Immunol. 2021 Jul;135:365-372. doi: 10.1016/j.molimm.2021.05.001. Epub 2021 May 11. Mol Immunol. 2021. PMID: 33990005 Free PMC article.
-
Engineering the T cell receptor for fun and profit: Uncovering complex biology, interrogating the immune system, and targeting disease.Curr Opin Struct Biol. 2022 Jun;74:102358. doi: 10.1016/j.sbi.2022.102358. Epub 2022 Mar 25. Curr Opin Struct Biol. 2022. PMID: 35344834 Free PMC article. Review.
-
Retro-inverso D-peptides as a novel targeted immunotherapy for Type 1 diabetes.J Autoimmun. 2020 Dec;115:102543. doi: 10.1016/j.jaut.2020.102543. Epub 2020 Sep 17. J Autoimmun. 2020. PMID: 32951964 Free PMC article.
-
Melanoma reactive TCR-modified T cells generated without activation retain a less differentiated phenotype and mediate a superior in vivo response.Sci Rep. 2021 Jun 25;11(1):13327. doi: 10.1038/s41598-021-92808-6. Sci Rep. 2021. PMID: 34172810 Free PMC article.
-
Understanding TCR affinity, antigen specificity, and cross-reactivity to improve TCR gene-modified T cells for cancer immunotherapy.Cancer Immunol Immunother. 2019 Nov;68(11):1881-1889. doi: 10.1007/s00262-019-02401-0. Epub 2019 Oct 8. Cancer Immunol Immunother. 2019. PMID: 31595324 Free PMC article. Review.
References
-
- Parkhurst M.R., Yang J.C., Langan R.C., Dudley M.E., Nathan D.A., Feldman S.A., Davis J.L., Morgan R.A., Merino M.J., Sherry R.M. T cells targeting carcinoembryonic antigen can mediate regression of metastatic colorectal cancer but induce severe transient colitis. Mol. Ther. 2011;19:620–626. - PMC - PubMed
Publication types
MeSH terms
Substances
Grants and funding
LinkOut - more resources
Full Text Sources
Other Literature Sources
Molecular Biology Databases
