. 2018 Mar:29:128-145.
doi: 10.1016/j.ebiom.2018.02.017. Epub 2018 Feb 23.

Reciprocal modulation of mesenchymal stem cells and tumor cells promotes lung cancer metastasis

Affiliations

Reciprocal modulation of mesenchymal stem cells and tumor cells promotes lung cancer metastasis

Giulia Fregni et al. EBioMedicine. 2018 Mar.

Abstract

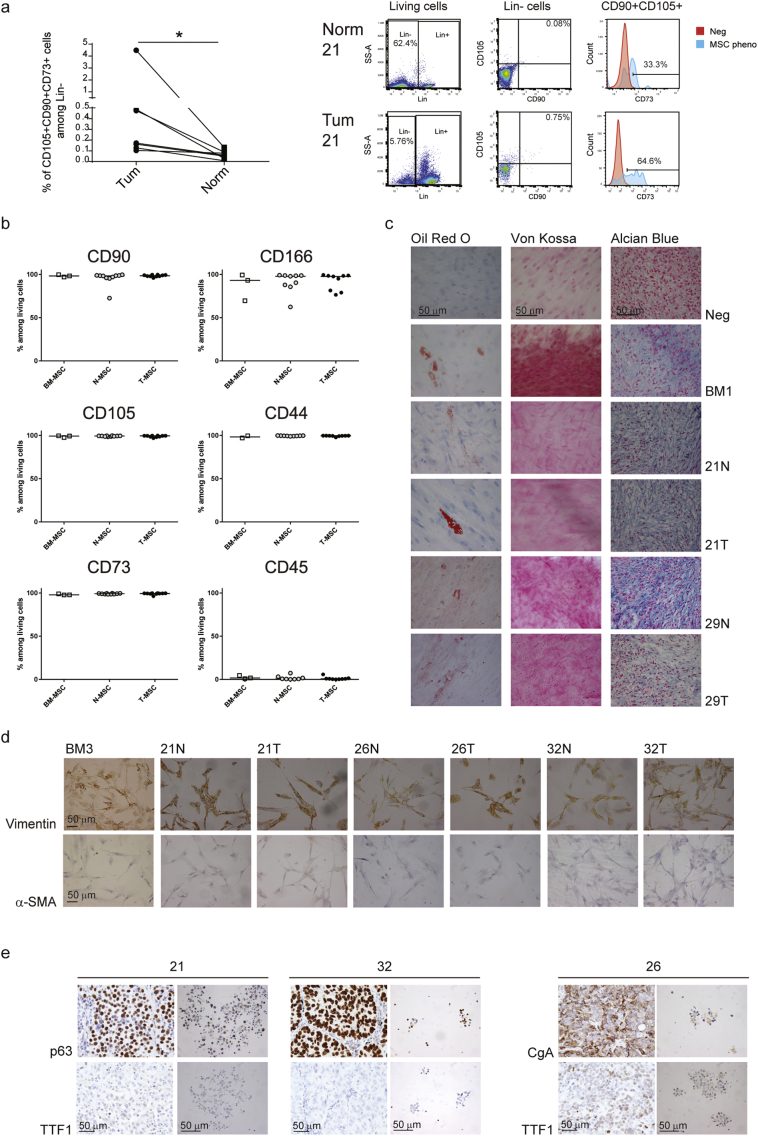
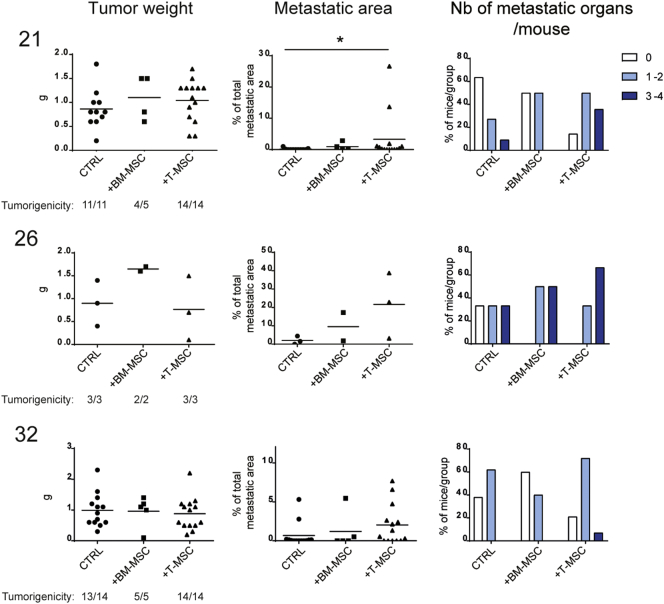
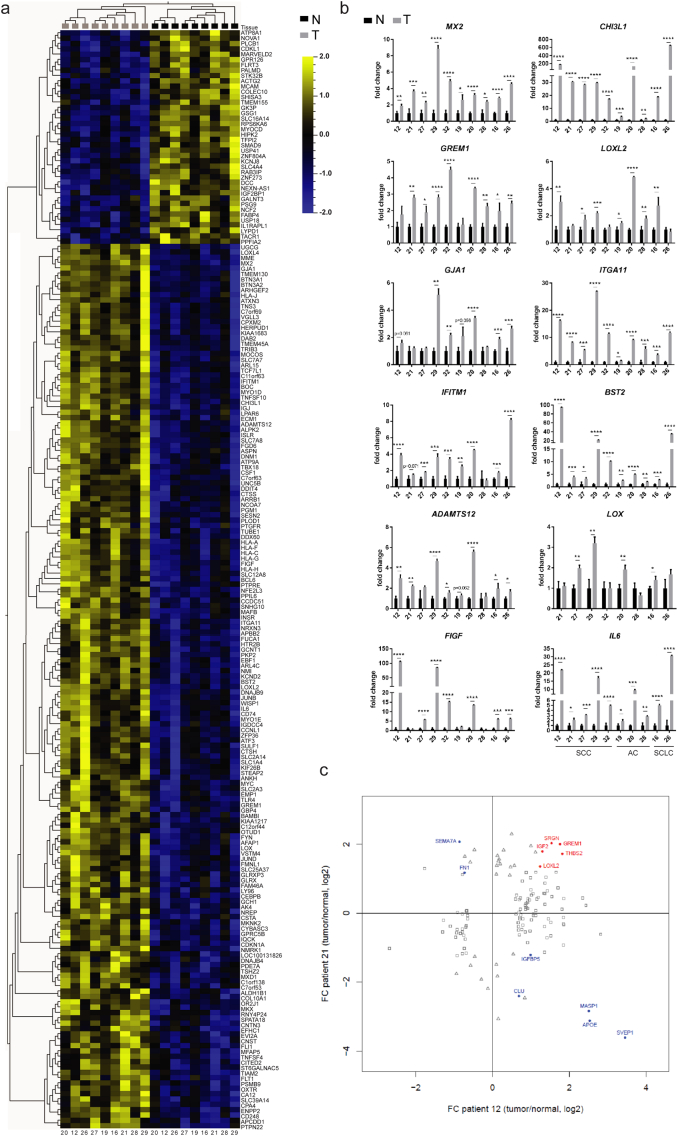
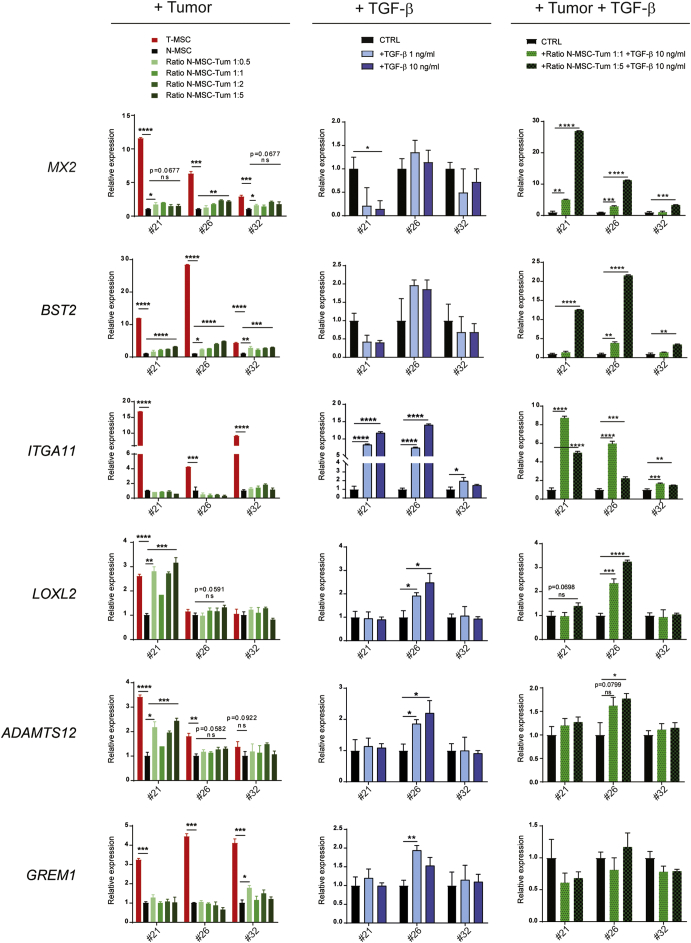
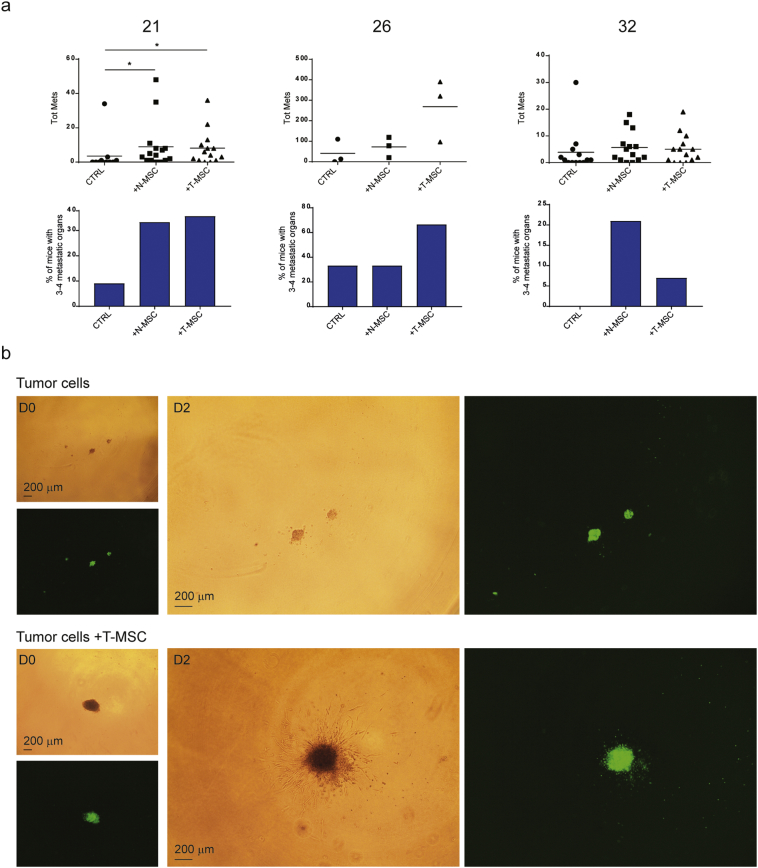
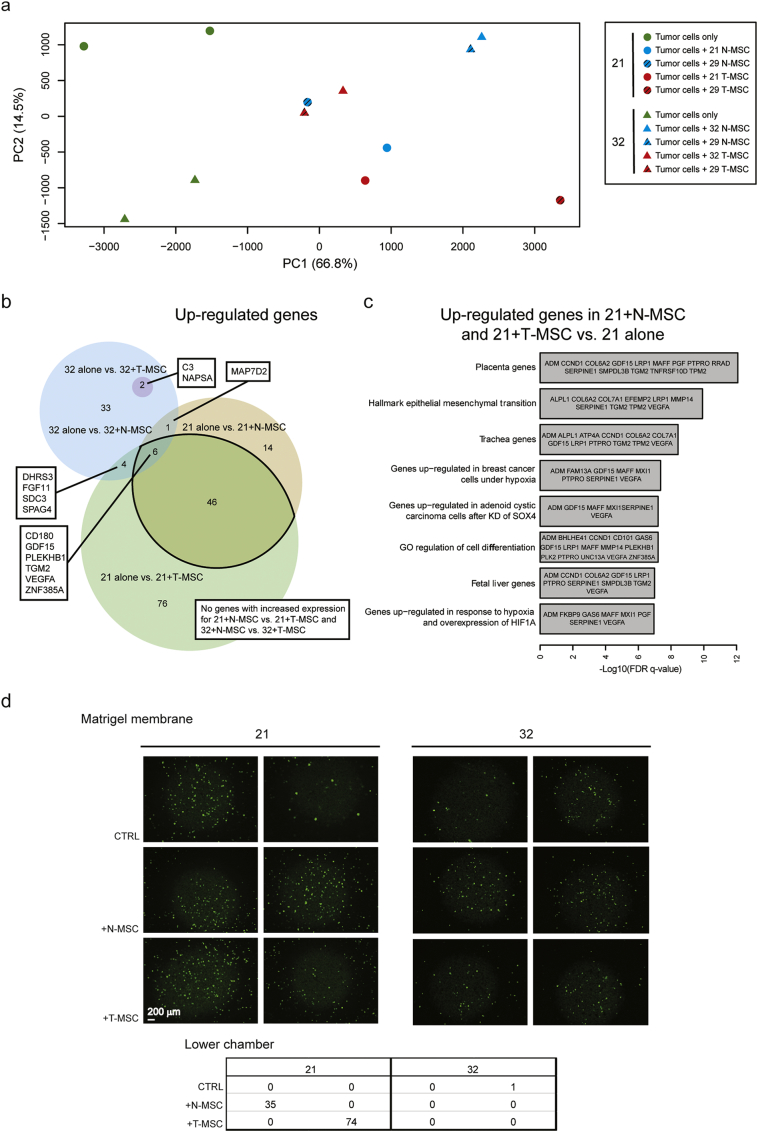
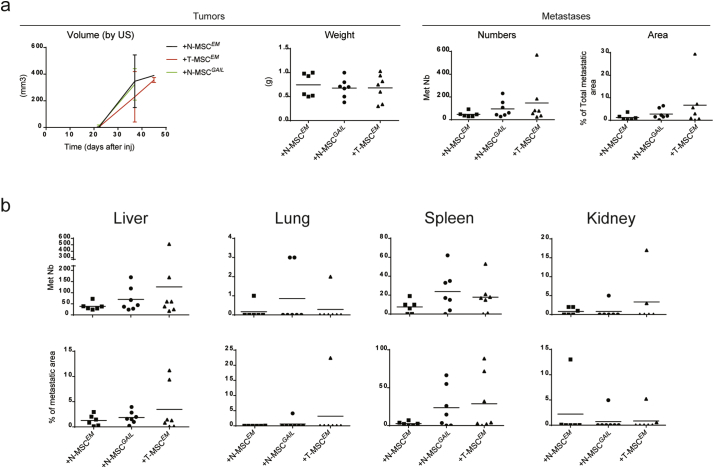
Metastasis is a multi-step process in which direct crosstalk between cancer cells and their microenvironment plays a key role. Here, we assessed the effect of paired tumor-associated and normal lung tissue mesenchymal stem cells (MSCs) on the growth and dissemination of primary human lung carcinoma cells isolated from the same patients. We show that the tumor microenvironment modulates MSC gene expression and identify a four-gene MSC signature that is functionally implicated in promoting metastasis. We also demonstrate that tumor-associated MSCs induce the expression of genes associated with an aggressive phenotype in primary lung cancer cells and selectively promote their dissemination rather than local growth. Our observations provide insight into mechanisms by which the stroma promotes lung cancer metastasis.

Keywords: ADAMTS12; GREM1; ITGA11; LOXL2; Tumor-associated MSCs; lung cancer; metastasis.


Figures

Fig. 1
Fig. 1
Primary MSC and tumor cell characterization. (A) On the left, proportions of MSC-like (CD105+CD90+CD73+) cells among Lin cells (CD45CD34CD20CD14) in paired normal and tumor lung tissues (n = 7) assessed by flow cytometry after tissue dissociation. Statistical significance was determined by Wilcoxon matched-pairs signed rank test; P-value is indicated as * according to the level of significance (P < 0.05). On the right, dot plots and histograms from one representative patient (21) depicting the sequential gating strategy on living, Lin and CD90+CD105+ cells for the assessment of MSC-like cell proportions in normal and tumor tissues. Percentages of Lin, CD90 and CD105 double positive cells, and CD73+ cells among the parental population are reported. CD73 expression by CD90+CD105+ cells (blue) was calculated using unstained living cells as negative control (red). (B–D) In vitro characterization of MSC cell cultures: N- and T-MSCs from lung carcinoma patients (n = 10) were compared with BM-MSCs from healthy donors (n = 3). (B) The expression of MSC surface markers was calculated by flow cytometry and reported as percentages among living cells. Horizontal lines represent medians. (C) Differentiation potential into adipocytes (Oil Red O), osteocytes (Von Kossa) and chondrocytes (Alcian Blue) of MSCs from one representative donor (BM1) and patients 21 and 29. (D) Vimentin and alpha-SMA expressions were assessed immunohistochemically on BM3 and N- and T-MSCs from patient 21, 26 and 32. (E) Sphere-forming tumor cells (right pictures) from 21, 32 and 26 patients were characterized for the expression of tumor markers and compared with tumors of origin (left pictures). (C–E) Scale bar = 50 μm. See also Fig. S1.
Fig. 2
Fig. 2
T-MSCs promote the metastatic potential of paired primary lung cancer cells more efficiently than BM-MSCs. Results from mouse injections with 21, 26 and 32 primary tumor cells alone (CTRL) or in the presence of BM-MSCs (from one healthy donor, BM1) or paired T-MSCs. For 21 and 32 tumors, 2 independent experiments were performed and data pooled together. Numbers of total injected mice per group are indicated as the denominator for the assessment of tumorigenicity. For each group, the tumorigenic ability is reported as the ratio between the number of mice with tumors to the total number of injected mice. Mice without tumors (n = 2) were not included in analyses or graphs. Tumor weights (grams, (g); left panels), percentages of total metastatic area per mouse (middle panels) and proportions of mice per group with 0 (white bars), 1–2 (clear blue) or 3–4 (dark blue) metastatic organs (right panels) are depicted for the three groups. Horizontal lines represent mean values. Groups were compared using the nonparametric Kruskal–Wallis (K–W) test with post-hoc Dunn's multiple comparison test. Significant differences are reported as *according to the level of significance (P < 0.5). See also Fig. S2.
Fig. 3
Fig. 3
Comparison between primary samples of paired N- and T-MSCs. (A-B) Comparison between the expression profile of N- (black) and T-MSC (grey) samples isolated from the same patients. (A) Microarray heatmap showing a distinct mRNA expression profile between paired samples from 9 patients. Log2 expression values are indicated by a color scale: up-regulated genes are depicted in yellow, down-regulated genes in blue. Each column represents a MSC sample (patient identification numbers (ID) are reported at the bottom) while rows represent genes identified by symbols on the right of the heatmap. Dendrograms are based on hierarchical clustering of samples/variables. (B) Validation by quantitative Real-Time PCR of selected genes. Samples are ordered according to tumor subtype (SCC, AC or SCLC) and patient ID are indicated below each graph. For all genes and for each patient (n = 10), expression was normalized to N-MSC levels using the PP1A housekeeping gene. Median values and SD from triplicates are shown. Paired N- and T-MSC expression levels were compared using multiple t tests. Significant differences were indicated according to the level of significance: * at P ≤ 0.05; ** at P ≤ 0.01; *** at P ≤ 0.001; **** at P ≤ 0.0001. (C) Secretome analysis of paired N- and T-MSC samples from patients 12 and 21. In red, proteins found to be significantly up-regulated in both T-MSC samples. In blue, proteins found to have significantly different abundance in the two samples but in opposite direction. Squares represent significant differentially secreted proteins from patient 12, triangles from patient 21. See also Fig. S3 and Table S1. (For interpretation of the references to color in this figure legend, the reader is referred to the web version of this article.)
Fig. 4
Fig. 4
N-MSC phenotype is modulated by different components of the tumor microenvironment. (Left column) N-MSCs from patients 21, 26 and 32 were cultured for 7 days alone (black bars) or with increasing numbers (green color scale bars) of primary tumor cells from the same patient in indirect conditions (1-μm pore size inserts); N-MSC:tumor cell ratios are indicated. The indicated gene expression was assessed by qRT-PCR and normalized to N-MSCs cultured alone using the PP1A housekeeping gene (fold change = 1). T-MSCs alone cultured under the same conditions (red bars) are shown as a reference. Data represent median values and SD from triplicate assays. For statistical analysis, N-MSCs alone were compared with T-MSCs or with N-MSCs in presence of the lowest or the highest number of tumor cells. (Middle column) N-MSCs were treated for 7 days with TGF-β1 at 1 ng/ml (light blue bars) or 10 ng/ml (dark blue bars). Gene expression levels normalized to untreated N-MSCs (black bars) using the TBP housekeeping gene (fold change = 1) are indicated. Median values and SD from triplicates are shown. (Right column) N-MSCs from patients 21, 26 and 32 were cultured for 7 days alone (black bars) or with primary tumor cells from the same patient at 1:1 (light green bars with black dots) or 1:5 (dark green bars with black dots) N-MSC:tumor cell ratios and treated with TGF-β1 at 10 ng/ml. Expression of the reported genes was assessed by qRT-PCR and normalized to untreated N-MSCs cultured alone using the TBP housekeeping gene (fold change = 1). Median values and SD from triplicate assays are shown. For all experiments, gene expression levels were compared by multiple t tests using the Holm-Sidak correction method. The adjusted P-values from the comparisons of N-MSCs alone and/or untreated with N-MSCs cultured in other conditions are indicated according to the level of significance: * at P ≤ 0.05; ** at P ≤ 0.01; *** at P ≤ 0.001; **** at P ≤ 0.0001. When almost significant (P ≤ 0.1), P-values are also reported with the symbol “ns” (not significant). See also Fig. S4A.
Fig. 5
Fig. 5
In vivo effects of N- and T-MSCs on primary lung cancer cells and MSC:tumor cell interactions in three dimensional structures. (A) Results from mouse injections with 21, 26 and 32 primary cancer cells alone (CTRL; n = 11, 3 and 13 mice respectively) or in presence of paired N- (n = 15, 3, 14 mice respectively) and T-MSCs (n = 14, 3, 14 mice respectively). For 21 and 32 tumors, 2 independent experiments were performed and data pooled together. Top panels: For each group of injection, total numbers of metastases per injected mouse are reported. Means are depicted by horizontal lines. Groups were compared using the nonparametric Kruskal-Wallis (K-W) test with post-hoc Dunn's multiple comparison test. Significant differences are reported and adjusted P-values indicated as * at P < 0.05. Lower panels: percentages of mice bearing metastases in 3–4 organs simultaneously in each group. See also Fig. S5. (B) Spheroids of CFSE-labeled tumor cells alone or mixed with T-MSCs from patient 21 at a 1:1 tumor:MSC cell ratio included in a 3-D matrix. Cell dissemination and three dimensional cell interactions were monitored by microscopy and the experiment performed in quadruplicate. One representative spheroid of tumor cells alone or mixed with T-MSCs is shown at day 0 and day 2 and images taken at 4× magnification by light and fluorescent microscopy. Scale bar = 200 μm. See also Fig. S6.
Fig. 6
Fig. 6
Effects of N- and T-MSCs on primary lung cancer cell transcriptome and invasiveness. (A–C) Analysis of RNA-Seq data from primary tumor cells cultured alone or in the presence of N- or T-MSCs from the same patient or from patient 29. Two independent experiments were performed with paired or 29 MSCs. (A) Principal component analysis (PCA) plot of RNA-Seq data from 21 (circles) and 32 (triangles) tumor cells cultured alone (in green) or with N- (in blue) or T-MSCs (in red) isolated from the same patient (filled symbols) or from patient 29 (striped) after removal of sample and batch effects. Percentages of data variation explained by the two first principal components (PC) are reported in brackets. (B) Venn diagram of genes up-regulated by tumor cells after MSC co-culture. For the analysis, results from co-cultures with MSCs (N- or T-) from different patients (paired or 29) were pooled together and indicated as “+N-MSC” or “+T-MSC”. Genes up-regulated in 32 tumor cells cultured with N-MSCs are represented by a blue circle, containing a smaller darker one that represents the 2 overlapping genes also overexpressed following T-MSC co-culture. Genes up-regulated in tumor 21 in the presence of N- or T-MSCs are respectively symbolized by a yellow and a green intersecting circles. The size of circles represents the numbers of up-regulated genes for each culture condition. The number of genes included in each region is indicated. Overlapping gene expression in the different conditions is listed (rectangles). (C) Gene ontology analysis of up-regulated genes in 21 tumor cells co-cultured with MSCs. See also Table S2. (D) Invasiveness of CFSE-labeled tumor cells (upper chamber, medium without serum) from patients 21 and 32 through a matrigel membrane was assessed in transwell co-culture conditions with N- or T-MSCs (lower chamber, medium with serum). Medium with serum in the absence of MSCs in the lower chamber was used as the control condition (CTRL). Experiments in each condition were performed in duplicate. Following overnight incubation, images of CFSE-labeled tumor cells invading the matrigel were captured at the level of the transwell membrane after removal of non-invading cells from the upper chamber by washing the gel surface multiple times with PBS. Images were taken by fluorescent microscopy (with the focus adjusted to the 8 μm insert pores by light microscopy) at 4× magnification. Scale bar = 200 μm. The table indicates the numbers of CFSE-labeled tumor cells in the lower chamber at the end of the co-culture. Cells were counted on images taken by fluorescent microscopy at 4× magnification in the lower chamber, with the focus adjusted to the MSCs by light microscopy.
Fig. 7
Fig. 7
N-MSCs overexpressing GREM1, LOXL2, ITGA11 and ADAMTS12 increase the metastatic potential of paired tumor cells. Results from 26 tumor cell co-injections with paired N- (n = 6) or T-MSCs (n = 7) expressing the Emerald reporter gene (EM) or with a bulk of N-MSCs single expressing GREM1, LOXL2, ITGA11 and ADAMTS12 (GAIL; n = 7) in addition to the EM gene. (A) Left: ultrasound (US) follow-up of tumor volume (mm3) from the day of cell injection to sacrifice is shown. Lines connect the mean values for each group of mice. Standard deviations are indicated. Right: for each group, the tumor weight (g) quantification of the total number of metastases and proportion of the total tissue area occupied my metastases per mouse are shown. Horizontal lines indicate mean values. (B) Number of metastases and the proportion of each affected organ occupied by metastatic tumor growth per mouse in the three groups of mice are shown. Mean values are indicated by the horizontal lines. Groups were compared using the nonparametric Kruskal–Wallis (K–W) test with post-hoc Dunn's multiple comparison test. See also Fig. S6.

Similar articles

Cited by

References

    1. Aggarwal S., Pittenger M.F. Human mesenchymal stem cells modulate allogeneic immune cell responses. Blood. 2005;105:1815–1822. - PubMed
    1. Agnihotri N., Kumar S., Mehta K. Tissue transglutaminase as a central mediator in inflammation-induced progression of breast cancer. Breast Cancer Res. 2013;15:202. - PMC - PubMed
    1. Alamgeer M., Ganju V., Watkins D.N. Novel therapeutic targets in non-small cell lung cancer. Curr. Opin. Pharmacol. 2013;13:394–401. - PubMed
    1. Aw Yong K.M., Zeng Y., Vindivich D., Phillip J.M., Wu P.-H., Wirtz D., Getzenberg R.H. Morphological effects on expression of growth differentiation factor 15 (GDF15), a marker of metastasis. J. Cell. Physiol. 2014;229:362–373. - PMC - PubMed
    1. Benjamini Y., Hochberg Y. Controlling the false discovery rate: a practical and powerful approach to multiple testing. J. R. Stat. Soc. Ser. B. 1995;57:289–300.

MeSH terms