. 2017 Oct-Dec;89(4):045004.
doi: 10.1103/RevModPhys.89.045004. Epub 2017 Dec 11.

Optically polarized 3He

Affiliations

Optically polarized 3He

T R Gentile et al. Rev Mod Phys. 2017 Oct-Dec.

Abstract

This article reviews the physics and technology of producing large quantities of highly spin-polarized 3He nuclei using spin-exchange (SEOP) and metastability-exchange (MEOP) optical pumping. Both technical developments and deeper understanding of the physical processes involved have led to substantial improvements in the capabilities of both methods. For SEOP, the use of spectrally narrowed lasers and K-Rb mixtures has substantially increased the achievable polarization and polarizing rate. For MEOP nearly lossless compression allows for rapid production of polarized 3He and operation in high magnetic fields has likewise significantly increased the pressure at which this method can be performed, and revealed new phenomena. Both methods have benefitted from development of storage methods that allow for spin-relaxation times of hundreds of hours, and specialized precision methods for polarimetry. SEOP and MEOP are now widely applied for spin-polarized targets, neutron spin filters, magnetic resonance imaging, and precision measurements.


Figures

FIG. 1
FIG. 1
An example of an apparatus for spin-exchange optical pumping (SEOP). This apparatus has been employed for photon scattering experiments. Whereas SEOP is typically performed in single cells for neutron spin-filter and magnetic resonance imaging applications, both electron and photon scattering applications employ a double cell configuration in which a target cell (TC) is linked to an optical pumping cell (OPC) through a connecting tube. Electron paramagnetic resonance and nuclear magnetic resonance are employed to measure the 3He polarization in the OPC and TC, respectively. Adapted from Ye et al. (2010)
FIG. 2
FIG. 2
An example of an apparatus for metastability exchange optical pumping, adapted from Andersen et al. (2005). This apparatus has been employed for compressing gas into neutron spin filter cells. Nine 2 m diameter coils provide the uniform magnetic field for the 2.3 m long optical pumping cells (OPC). 3He gas is purified, polarized in the OPCs, compressed in two stages with an intermediate buffer cell, and dispensed into detachable neutron spin filter cells. The capillary serves to control the flow rate and restrict diffusion for the typical 1 mbar pressure in the OPCs.
FIG. 3
FIG. 3
Development of neutron spin filters (NSFs) and spin-polarized 3He targets, illustrated by representative devices and experiments. In each case, key parameters are listed to show how advances for each method improved performance, e.g. spectrally narrowed lasers and K-Rb mixtures for spin-exchange optical pumping (SEOP), and filling of cells with piston compressors and high power laser sources for metastability exchange optical pumping (MEOP). See Secs. VI and VII for definitions of identifiers in this plot. The FOM is defined to be PHe2N/τ for SEOP NSFs and targets, and MEOP cryogenic targets, where PHe is the 3He polarization, N is the total number of atoms in the cell in units of amg-L, and τ is the time constant for polarizing the cell. (Reminder: to reach 90% of the maximum polarization requires 2.3 time constants.) For compression-based MEOP NSFs and targets, τ is replaced by T, where T is the time to refresh the gas for continuous flow or the time between cell exchange for remotely operated compression. (a) SEOP NSFs: First NSF (Coulter et al., 1990)), SANS (Gentile et al., 2000; Jones et al., 2000), PNR (Chen et al., 2004), TAS (Chen et al., 2007a), wide-angle (Ye et al., 2013), and VHG-narrowed (Chen et al., 2014a). (b) SEOP targets for electron-scattering experiments. Here the FOM is equivalent to the potential effective luminosity of Singh et al. (2015). Data provided by J. Singh. E142 (Anthony et al., 1993), GDH (Amarian et al., 2002), GEN (Riordan et al., 2010), Duality (Solvignon et al., 2008), Transversity (Qian et al., 2011) (c) MEOP NSFs and targets. GEn (Bates, cryogenic, Nd:YAP) (Jones et al., 1993), GMn (Bates, cryogenic, Nd:LMA) (Gao et al., 1994), GEn (Toepler pump) (Meyerhoff et al., 1994), GEn, GDH (piston) (Krimmer et al., 2011, 2009; Schlimme et al., 2013), (Toepler pump) (Eckert et al., 1992), piston fill-up mode (Batz et al., 2005).
FIG. 4
FIG. 4
Calculated spin-independent (V0(ξ)) (Partridge et al., 2001) and Fermi-contact (α(ξ)) (Tscherbul et al., 2011) potentials for K-3He molecules, as a function of interatomic separation ξ in atomic units.
FIG. 5
FIG. 5
Spin-exchange efficiency (ηSE) measurement for K and Rb, from Ben-Amar Baranga et al. (1998).
FIG. 6
FIG. 6
Key elements of the optical pumping cycle for light tuned to the alkali metal S1/2—P1/2 resonance in the presence of high pressure He gas. Collisions with the He atoms mix the P1/2 and P3/2 levels, altering the selection rules for light absorption. Atoms in the ms = ±1/2 Zeeman ground-state sublevels absorb photons with relative probabilities 1ŦP. Once excited, rapid collisional spin-relaxation occurs. Quenching collisions with N2 molecules randomly repopulates the ground-state sublevels. The atoms accumulate in the mS = 1/2 sublevel, acquiring a steady-state spin-polarization of P in the absence of ground-state spin-relaxation.
FIG. 7
FIG. 7
Energy levels of RbHe molecules in the presence of optical pumping light (Lancor et al., 2010a; Pascale, 1983). The green curve, the ground state potential energy plus 1 photon, crosses 2 excited-state potentials at two different interatomic separations. The 5p[M = 3/2] curve is of purely P3/2 nature while the 5p[1/2] is of mixed P1/2-P3/2 character. The projection of the electronic angular momentum along the interatomic axis is M. For both crossings the colliding atom pair can absorb the circularly polarized optical pumping light even when each is fully spin-polarized. From Lancor et al. (2010a).
FIG. 8
FIG. 8
Circular dichroism of Rb atoms in the presence of He gas. Near the D1 line, the dichroism approaches 1, reaching 1/2 for the D2 line. The solid line shows the dichroism neglecting He collisions. The very significant reduction near the D1 line is responsible for excess photon absorption under SEOP conditions. Adapted from Lancor et al. (2010a).
FIG. 9
FIG. 9
Measured efficiencies at 190°C as a function of density ratio 𝒟 = [K]/[Rb]. The spin-exchange efficiency, ηSE, which is the maximum possible efficiency with which the angular momentum of the pumping light can be transferred to the nuclei, shows the clear increases predicted by Eq. (15), solid line, as the vapor approaches pure K. Measured and modeled photon efficiencies, ηγ, are much smaller, thanks to dichroism effects, see Sec II.B.3. From Babcock et al. (2003).
FIG. 10
FIG. 10
Alkali polarization as a function of K-Rb density ratio. The solid line shows the density limit for a narrowband pumping laser, using the measured K absorption cross section at 795 nm. The dots are experimental measurements using a broad pumping laser whose maximum polarization is limited by the dichroism effect to 0.92. The dashed line shows expected polarization limits predicted from a naive line-broadening model. From Lancor and Walker (2011).
FIG. 11
FIG. 11
NIST measurements of the X-factor, deduced from 3He polarization limits at high temperature, for both blown (filled, red) and flat-windowed (open, blue) neutron spin filter cells with a range of surface to volume ratios S/V. Adapted from Babcock et al. (2006).
FIG. 12
FIG. 12
Fine- and hyperfine-structures of the atomic states of He involved in the metastability-exchange optical pumping process, for the 3He (left) and 4He (right) isotopes, in low magnetic field (for negligible magnetic Zeeman energies, i.e. below a few mT). The values of the total angular momenta (J for 4He, F for 3He) are indicated. Details and names of the magnetic sublevels of the 23S and 23P0 states are given in blown-up boxes (with notations of Courtade et al. 2002.) The shifts and splittings are not displayed to scale.
FIG. 13
FIG. 13
Temperature dependence of calculated and experimentally assessed collision rate coefficients in He. Ab-initio calculated rates are plotted for excitation transfer (dashed lines) and total (solid lines) rates of collisions for the 23S state (red curves, labeled ‘S’) and the 23P state (black curves, ‘P’). Experimental kME data (symbols, see legend) are derived from published values of linewidths or ME cross sections in 3He (see text). Three calculated rate coefficients slowly decrease with decreasing temperature and thermal velocities, but the rate coefficients kME for ME collisions (the dashed red line and symbols) abruptly decrease below room temperature. This is attributed to a weak repulsive barrier at large distance in the He*-He interaction potential. Adapted from Vrinceanu and Sadeghpour (2010, Fig. 3) for the calculated curves.
FIG. 14
FIG. 14
Low-field metastability-exchange optical pumping transitions: (a) computed absorption spectra for the 23S-23P transition for a low-pressure, optically thin gas at room temperature. The linewidths essentially arise from Doppler broadening. (b) Fine- and hyperfine-sublevels involved in the transition (see Fig. 12). The three transitions to the 23P0 levels are schematically represented, and the names and positions of the corresponding line components in the spectra are highlighted. (c) The inset displays the optical transitions involved for C8, σ+ pumping (straight arrows, see text). The curved arrow represents population transfer between Zeeman sublevels of the 23P state. Note that no direct transfer, corresponding to a nuclear spin flip, is expected to occur between these two sublevels.
FIG. 15
FIG. 15
Results of the MEOP rate equations obtained using the same computer code as in (Batz et al., 2011) for typical operating conditions: 0.5 mbar 3He gas, T = 293 K, B = 1 mT, nm = 1.2 × 1010 cm−3, γrS=103s-1,γrP=0.16×10⁷s-1. Atoms of all velocity classes are pumped with the same rates γij (see text). (a) Distributions of the 23S populations ai for C8, σ+ optical pumping and γij = γ/10, γ, and 10γ (bars from left to right and from light grey to black in each group) Surrounding red boxes are the spin-temperature populations. (b) Computed absorption coefficients are plotted as functions of reduced pumping rates for C8 and C9 optical pumping and different nuclear polarizations (see legend). For C9 the two pumping rates for the two pumped sublevels jointly scale with the pumping light intensity, with a fixed ratio T1,18/T2,17 = 3. Introducing Tij in the horizontal scales makes the reduced pumping rates identically proportional to the pump intensity. (c) Differences between nuclear polarizations in the 23S and ground states are plotted as a functions of PHe for C8 and C9 pumping and different reduced pumping rates (see legend)
FIG. 16
FIG. 16
High-field metastability-exchange optical pumping transitions: (a) Computed absorption spectra at B = 1.5 T for the 23S-23P transition (low-pressure, optically thin gas at room temperature) for both circular polarizations. The strong unresolved components in the spectra are labeled fn±, where n=2 or 4 refers to the number of involved transitions and ± to the sign of the circular polarization. Doublets of resolved weaker transitions of interest for optical detection purpose are highlighted. (b) and (c) Energies of the 3He sublevels at 1.5 T for the 23S and 23P states. The transitions induced by the σ-polarized pumps (thick lines) and the suitable probes (thin lines) are displayed ( f2-pump, σ+ probe in (b); f4- pump, σ probe in (c)).
FIG. 17
FIG. 17
Optical-pumping-induced additional loss rates are plotted vs absorbed pumping power per unit volume for various gas pressures and fields (see legends) and cell diameters: wide (w: ≥ 5 cm) and narrow (n: 1.5 cm). Each of the two logarithmic scales spans 6 decades. The lines are guides for the eye corresponding to linear variations with linear coefficients 200 cm3/J (dashed line, low B) and 9 cm3/J (dotted line, 1.5 T). The ordinates of the horizontal lines in the box next to the left axis are the values of the pumping-free decay rates ΓD for the different sets of data. They range from 0.67 × 10⁻³ s−1 (filled stars) to 14.5 × 10⁻³ s−1 (large open squares). The figure is adapted from (Batz, 2011, Fig. 6.62); it compiles data from Mainz ( formula image
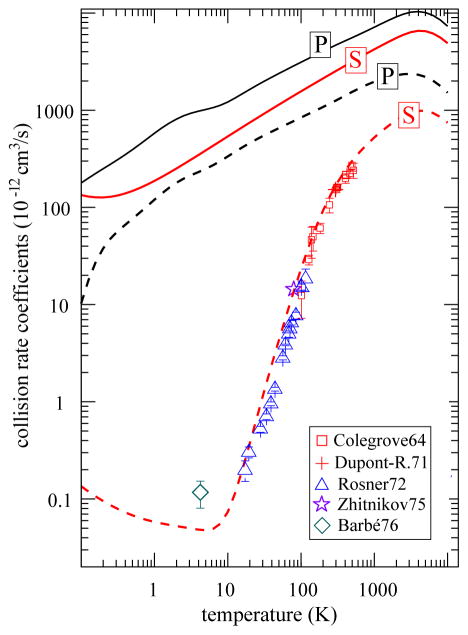
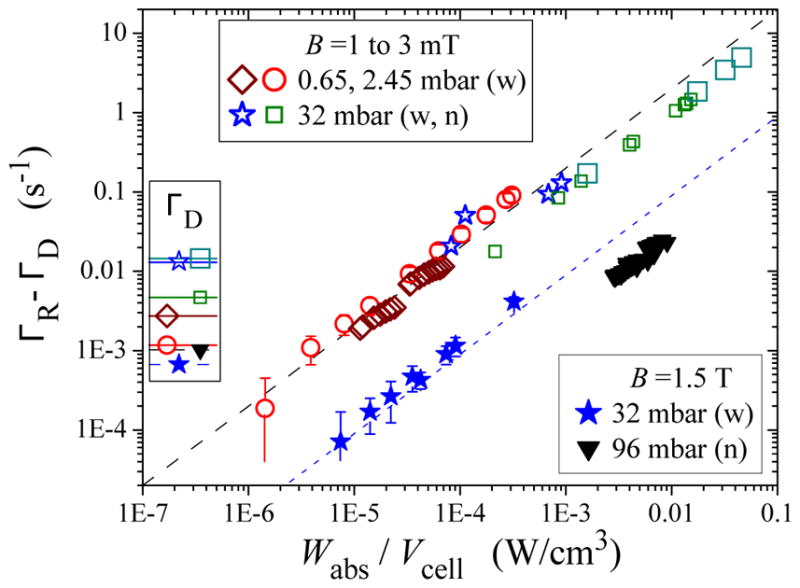
), Cracow (▼), and Paris (all other symbols; the small and large squares stand for weak and strong discharges in the same cell).
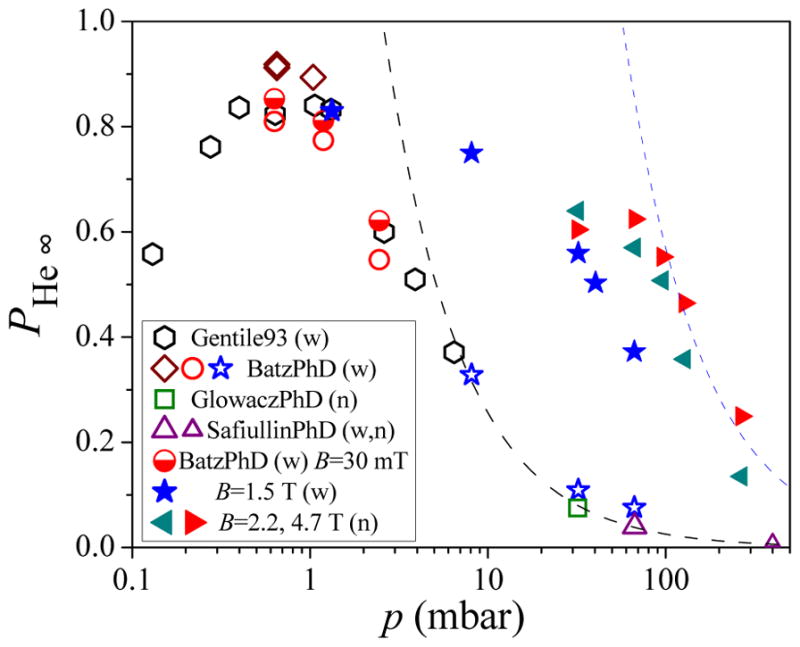
FIG. 18
FIG. 18
Variation with pressure of highest steady-state polarizations achieved by various groups at low fields (open symbols, 1 to 3 mT) and high fields (filled symbols, see legend). The two lines (PHe = 2.56/p and PHe = 57/p) are upper bounds derived from the lines in Fig. 17 (see text). The figure is adapted from (Batz, 2011, Fig. 6.48), with additional data from (Glowacz, 2011) and (Safiullin, 2011); it compiles data from Caltech ( formula image), Mainz ( formula image), Cracow ( formula image, formula image), and Paris (all other symbols). Wide and narrow cells (w, n): see Fig. 17.
FIG. 19
FIG. 19
Diagrams of current electron beam target designs. Top: JLAB, from Dolph et al. (2011). Bottom: Mainz, from Krimmer et al. (2009). Dimensions are in mm.
FIG. 20
FIG. 20
The variation of the neutron polarization Pn and transmission Tn with the opacity factor, where the opacity factor is given by the pressure-length-wavelength product in bar cm nm, for 3He polarizations (PHe) of 0.5, 0.75 and 1. The neutron transmissions shown do not include the transmission of 0.88 due to neutron scattering from a typical glass NSF cell.
FIG. 21
FIG. 21
Neutron spin filter (NSF) cells. Clockwise from top left: MEOP silicon-windowed cells (largest cell is 14 cm diameter by 10 cm long, Lelievre-Berna (2007)), MEOP wide-angle cell (6 cm inner diameter, 20 cm outer diameter, 12 cm tall, Andersen et al. (2009)), cells for neutron interferometry (larger cell is 4 cm diameter by 6 cm long, Huber et al. (2014)), horseshoe SEOP cell (9 cm inner diameter, 23 cm outer diameter, 7.5 cm tall, Chen (2016)), SEOP wide-angle cell (14 cm inner diameter, 30 cm outer diameter, 8 cm tall, Ye et al. (2013)), typical SEOP NSF cell (12 cm diameter by 7 cm long, Chen et al. (2011)).
FIG. 22
FIG. 22
Coronal (view from the front of the body) 3He magnetic resonance images from a healthy subject (left) and three patients with cystic fibrosis (CF). The number of ventilation defects increases with worsening results of a standard global ventilation test, FEV1 (forced expiratory volume in one second). FEV1 is shown as a percentage of the predicted value for a healthy subject. From Mentore et al. (2005).
FIG. 23
FIG. 23
Axial (perpendicular to the spine) 3He magnetic resonance images of a cross section of the ventilated lung in two emphysema patients, top and bottom. Images on the right are spin-density weighted while those on the left are maps of apparent diffusion coefficient (ADC), where red represents the most restricted air spaces regions and blue the least restricted. The blue regions correspond to the most diseased tissue, where the alveolar walls have been destroyed. These regions do not necessarily correlate with the poorly ventilated regions seen in the spin-density weighted images, which demonstrates the potential for greater specificity with ADC mapping. From Conradi et al. (2006).
FIG. 24
FIG. 24
Dual species maser, from Stoner et al. (1996)
FIG. 25
FIG. 25
Design of a convection cell for decreased transfer time between the two volumes of a double cell, from Dolph et al. (2011). The flow of gas was monitored using an NMR tagging technique, in which the zapper coil was used to depolarize a slug of gas and NMR signals were then detected at each of four locations along the target chamber (labelled 1,2,3 and 4).

Similar articles

Cited by

References

    1. Abboud M, Sinatra A, Tastevin G, Nacher PJ, Maitre X. Metastability exchange optical pumping of helium-3 at high pressures and 1.5 T: Comparison of two optical pumping transitions. Laser Physics. 2005;15(4):475–479.
    1. Abboud Marie. Pompage optique de l’hélium-3 à forte pression dans un champ magnétique de 1.5 Tesla. PhD Thesis. 2005 http://tel.archives-ouvertes.fr/tel-00011099 (UPMC - Paris 6)
    1. Abboud Marie, Sinatra Alice, Maître Xavier, Tastevin Genevieve, Nacher P-J. High nuclear polarization of 3He at low and high pressure by metastability exchange optical pumping at 1.5 Tesla. Europhys Lett. 2004;68(4):480.
    1. Abe K, Akagi T, Anderson BD, Anthony PL, Arnold RG, Averett T, Band HR, Berisso CM, Bogorad P, Borel H, et al. Measurement of the neutron spin structure function gn2 and asymmetry An2. Phys Lett B. 1997a;404(3):377–382.
    1. Abe K, Akagi T, Anderson BD, Anthony PL, Arnold RG, Averett T, Band HR, Berisso CM, Bogorad P, Borel H, et al. Precision Determination of the Neutron Spin Structure Function g1n. Phys Rev Lett. 1997b;79(1):26.

LinkOut - more resources