

Laminar Distribution of Subsets of GABAergic Axon Terminals in Human Prefrontal Cortex
- PMID: 29503610
- PMCID: PMC5820353
- DOI: 10.3389/fnana.2018.00009
Laminar Distribution of Subsets of GABAergic Axon Terminals in Human Prefrontal Cortex
Abstract
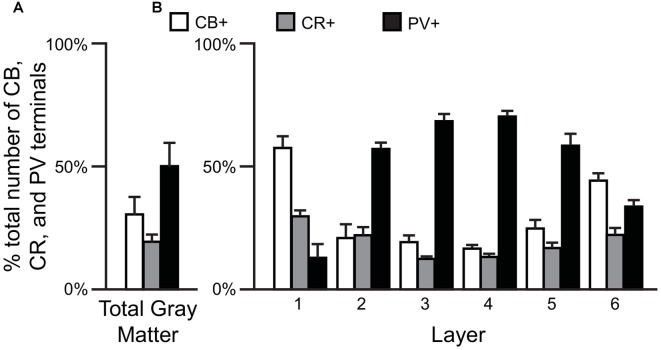
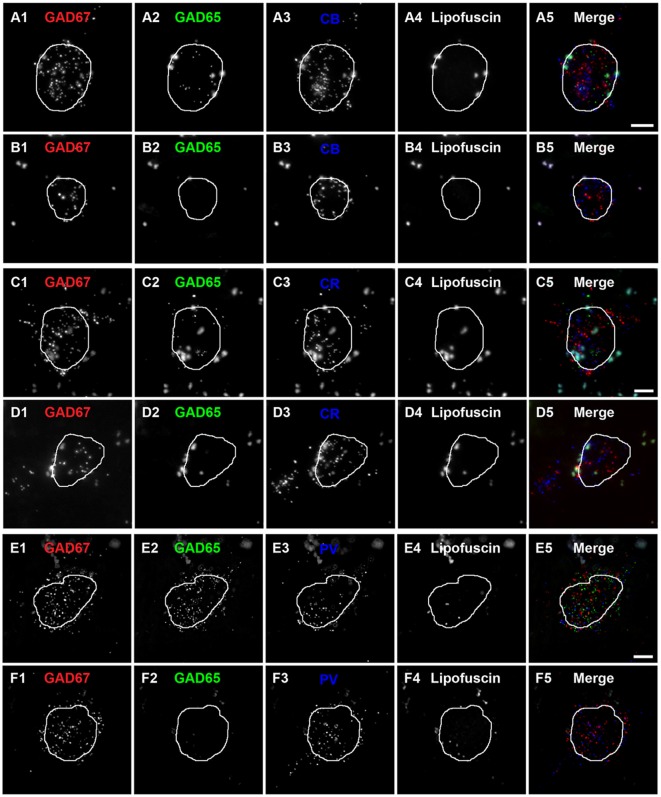
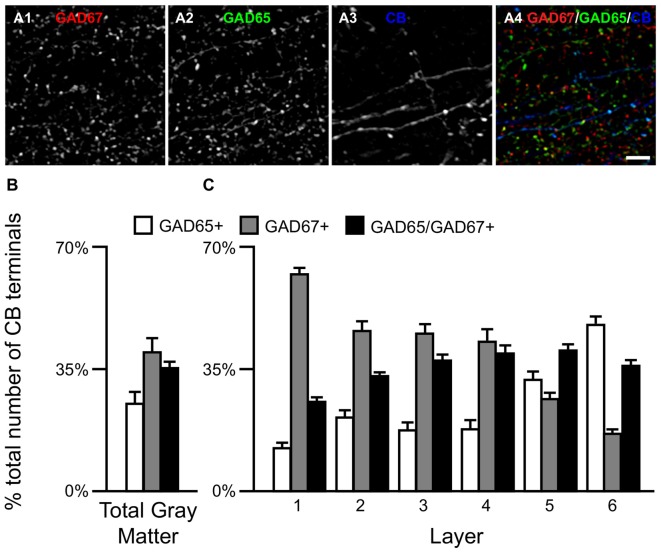
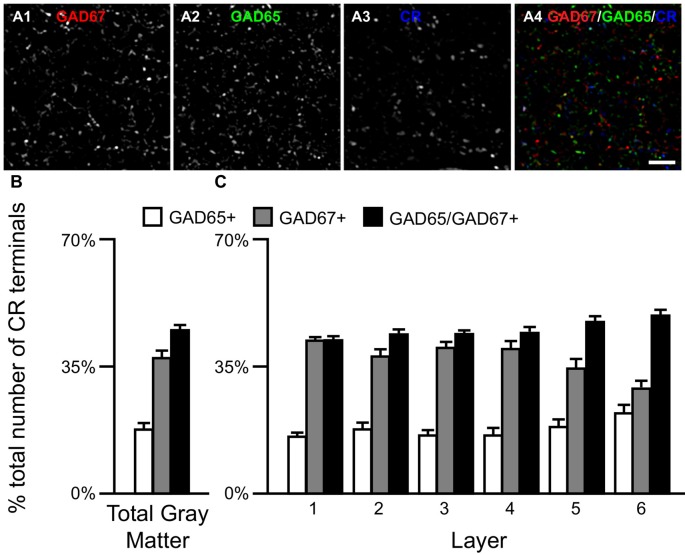
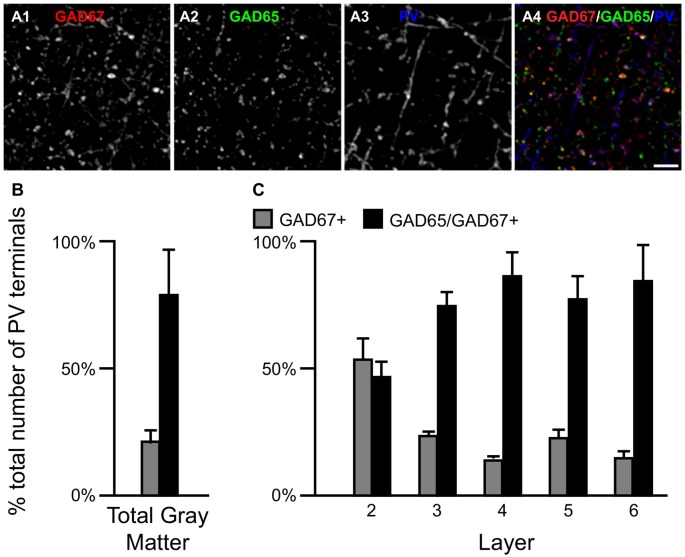
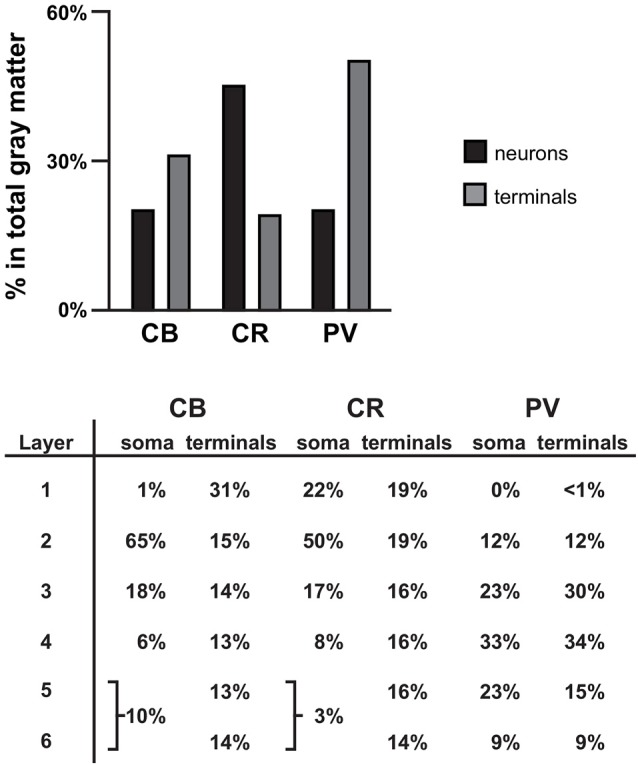
In human prefrontal cortex (PFC), ~85% of γ-aminobutyric acid (GABA)-expressing neurons can be subdivided into non-overlapping groups by the presence of calbindin (CB), calretinin (CR) or parvalbumin (PV). Substantial research has focused on the differences in the laminar locations of the cells bodies of these neurons, with limited attention to the distribution of their axon terminals, their sites of action. We previously reported that in non-human primates subtypes of these cells are distinguishable by differences in terminal protein levels of the GABA synthesizing enzymes glutamic acid decarboxylase 65 (GAD65) and GAD67. Here we used multi-label fluorescence microscopy in human PFC to assess: (1) the laminar distributions of axon terminals containing CB, CR, or PV; and (2) the relative protein levels of GAD65, GAD67 and vesicular GABA transporter (vGAT) in CB, CR and PV terminals. The densities of the different CB, CR and PV terminal subpopulations differed across layers of the PFC. PV terminals comprised two subsets based on the presence of only GAD67 (GAD67+) or both GADs (GAD65/GAD67+), whereas CB and CR terminals comprised three subsets (GAD65+, GAD67+, or GAD65/GAD67+). The densities of the different CB, CR and PV GAD terminal subpopulations also differed across layers. Finally, within each of the three calcium-binding protein subpopulations intra-terminal protein levels of GAD and vGAT differed by GAD subpopulation. These findings are discussed in the context of the laminar distributions of CB, CR and PV cell bodies and the synaptic targets of their axons.
Keywords: GAD65; GAD67; glutamic acid decarboxylase; human PFC; vGAT.
Figures
Similar articles
-
GABA-Synthesizing Enzymes in Calbindin and Calretinin Neurons in Monkey Prefrontal Cortex.Cereb Cortex. 2016 May;26(5):2191-2204. doi: 10.1093/cercor/bhv051. Epub 2015 Mar 30. Cereb Cortex. 2016. PMID: 25824535 Free PMC article.
-
Laminar-Specific Alterations in Calbindin-Positive Boutons in the Prefrontal Cortex of Subjects With Schizophrenia.Biol Psychiatry. 2023 Jul 15;94(2):142-152. doi: 10.1016/j.biopsych.2022.12.004. Epub 2022 Dec 8. Biol Psychiatry. 2023. PMID: 36868891 Free PMC article.
-
Immunofluorescently labeling glutamic acid decarboxylase 65 coupled with confocal imaging for identifying GABAergic somata in the rat dentate gyrus-A comparison with labeling glutamic acid decarboxylase 67.J Chem Neuroanat. 2014 Nov;61-62:51-63. doi: 10.1016/j.jchemneu.2014.07.002. Epub 2014 Jul 21. J Chem Neuroanat. 2014. PMID: 25058170
-
[Schizophrenia and cortical GABA neurotransmission].Seishin Shinkeigaku Zasshi. 2010;112(5):439-52. Seishin Shinkeigaku Zasshi. 2010. PMID: 20560363 Review. Japanese.
-
Uniqueness and redundancy in GABA production.Perspect Dev Neurobiol. 1998;5(2-3):109-18. Perspect Dev Neurobiol. 1998. PMID: 9777629 Review.
Cited by
-
Loss of putative GABAergic neurons in the ventrolateral medulla in multiple system atrophy.Sleep. 2021 Sep 13;44(9):zsab074. doi: 10.1093/sleep/zsab074. Sleep. 2021. PMID: 33755181 Free PMC article.
-
Prefrontal parvalbumin interneurons deficits mediate early emotional dysfunction in Alzheimer's disease.Neuropsychopharmacology. 2023 Jan;48(2):391-401. doi: 10.1038/s41386-022-01435-w. Epub 2022 Oct 13. Neuropsychopharmacology. 2023. PMID: 36229597 Free PMC article.
-
GABAergic dysfunction in postmortem dorsolateral prefrontal cortex: implications for cognitive deficits in schizophrenia and affective disorders.Front Cell Neurosci. 2024 Sep 24;18:1440834. doi: 10.3389/fncel.2024.1440834. eCollection 2024. Front Cell Neurosci. 2024. PMID: 39381500 Free PMC article. Review.
-
Shedding Light on Chandelier Cell Development, Connectivity, and Contribution to Neural Disorders.Trends Neurosci. 2020 Aug;43(8):565-580. doi: 10.1016/j.tins.2020.05.003. Epub 2020 Jun 18. Trends Neurosci. 2020. PMID: 32564887 Free PMC article. Review.
-
Plasticity of Persistent Activity and Its Constraints.Front Neural Circuits. 2020 May 7;14:15. doi: 10.3389/fncir.2020.00015. eCollection 2020. Front Neural Circuits. 2020. PMID: 32528254 Free PMC article. Review.
References
-
- Airaksinen M. S., Thoenen H., Meyer M. (1997). Vulnerability of midbrain dopaminergic neurons in calbindin-D28k-deficient mice: lack of evidence for a neuroprotective role of endogenous calbindin in MPTP-treated and weaver mice. Eur. J. Neurosci. 9, 120–127. 10.1111/j.1460-9568.1997.tb01360.x - DOI - PubMed
-
- Barinka F., Druga R. (2010). Calretinin expression in the mammalian neocortex: a review. Physiol. Res. 59, 665–677. - PubMed
Grants and funding
LinkOut - more resources
Full Text Sources
Other Literature Sources
Miscellaneous