

Increased Degradation Rates in the Components of the Mitochondrial Oxidative Phosphorylation Chain in the Cerebellum of Old Mice
- PMID: 29503614
- PMCID: PMC5820363
- DOI: 10.3389/fnagi.2018.00032
Increased Degradation Rates in the Components of the Mitochondrial Oxidative Phosphorylation Chain in the Cerebellum of Old Mice
Abstract
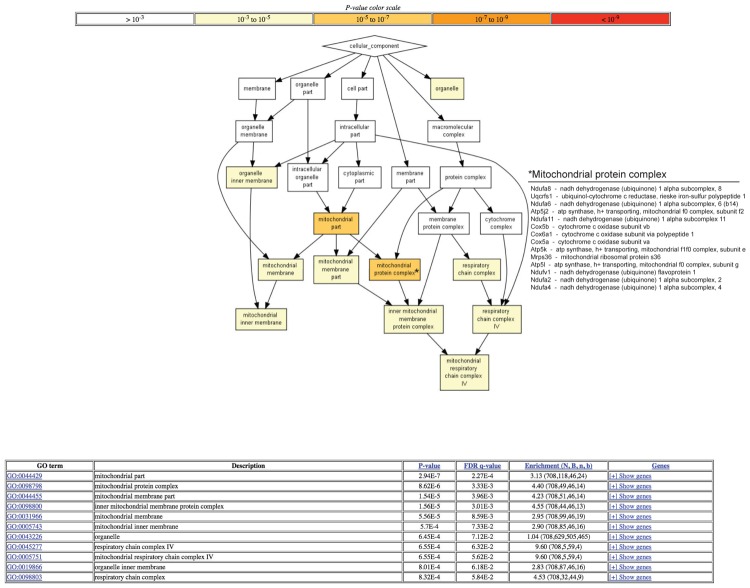
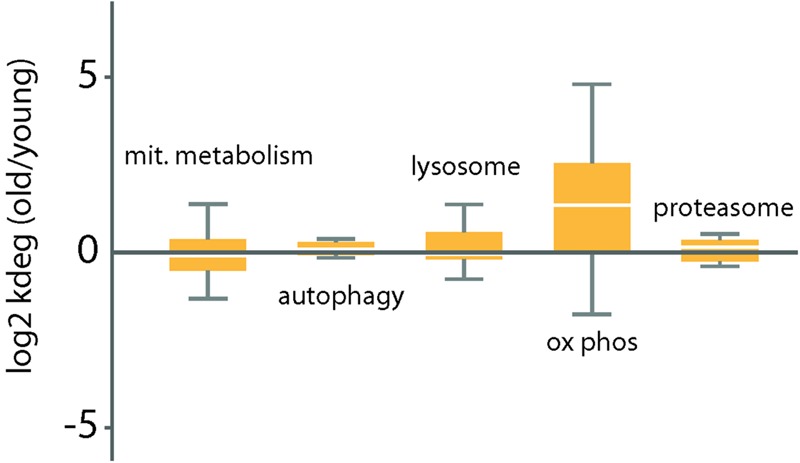
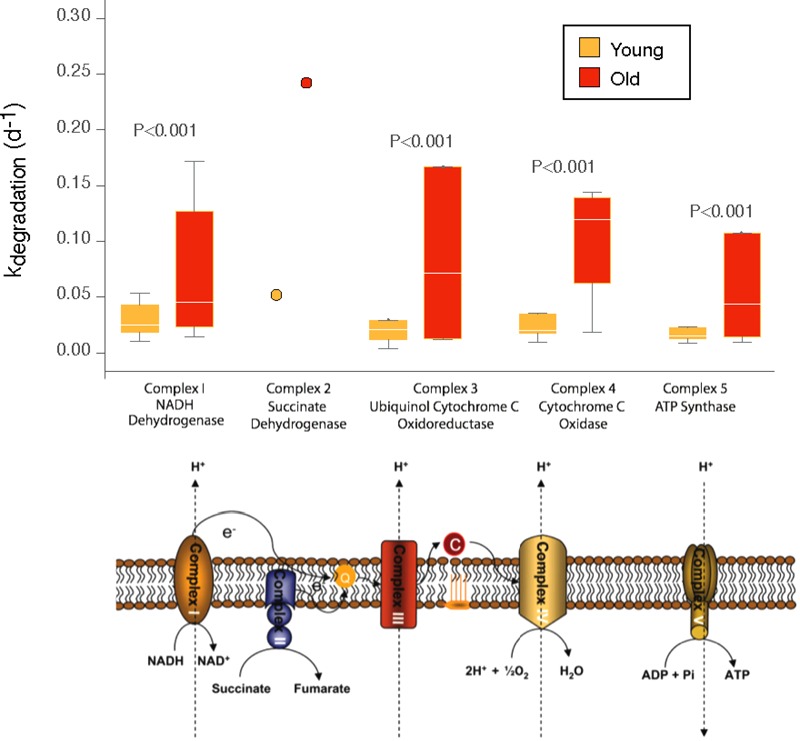
Brain structures differ in the magnitude of age-related neuron loss with the cerebellum being more affected. An underlying cause could be an age-related decline in mitochondrial bioenergetics. Successful aging of mitochondria reflects a balanced turnover of proteins involved in mitochondrial biogenesis and mitophagy. Thus, an imbalance in mitochondrial turnover can contribute to the diminution of cellular function seen during aging. Mitochondrial biogenesis and mitophagy are mediated by a set of proteins including MFN1, MFN2, OPA1, DRP1, FIS1 as well as DMN1l and DNM1, all of which are required for mitochondrial fission. Using N15 labeling, we report that the turnover rates for DMN1l and FIS1 go in opposite directions in the cerebellum of 22-month-old C57BL6j mice as compared to 3-month-old mice. Previous studies have reported decreased turnover rates for the mitochondrial respiratory complexes of aged rodents. In contrast, we found increased turnover rates for mitochondrial proteins of the oxidative phosphorylation chain in the aged mice as compared to young mice. Furthermore, the turnover rate of the components that are most affected by aging -complex III components (ubiquinol cytochrome C oxidoreductase) and complex IV components (cytochrome C oxidase)- was significantly increased in the senescent cerebellum. However, the turnover rates of proteins involved in mitophagy (i.e., the proteasomal and lysosomal degradation of damaged mitochondria) were not significantly altered with age. Overall, our results suggest that an age-related imbalance in the turnover rates of proteins involved in mitochondrial biogenesis and mitophagy (DMN1l, FIS1) in conjunction with an age-related imbalance in the turnover rates of proteins of the complexes III and IV of the electron transfer chain, might impair cerebellar mitochondrial bioenergetics in old mice.
Keywords: aging; cerebellum; mice; mitochondria; proteins; turnover.
Figures
Similar articles
-
Mitochondrial division inhibitor 1 reduces dynamin-related protein 1 and mitochondrial fission activity.Hum Mol Genet. 2019 Jan 15;28(2):177-199. doi: 10.1093/hmg/ddy335. Hum Mol Genet. 2019. PMID: 30239719 Free PMC article.
-
Loss of MIEF1/MiD51 confers susceptibility to BAX-mediated cell death and PINK1-PRKN-dependent mitophagy.Autophagy. 2019 Dec;15(12):2107-2125. doi: 10.1080/15548627.2019.1596494. Epub 2019 Mar 28. Autophagy. 2019. PMID: 30894073 Free PMC article.
-
Time-course of mitochondrial gene expressions in mice brains: implications for mitochondrial dysfunction, oxidative damage, and cytochrome c in aging.J Neurochem. 2005 Feb;92(3):494-504. doi: 10.1111/j.1471-4159.2004.02884.x. J Neurochem. 2005. PMID: 15659220
-
Mitochondrial Dynamics and Mitochondrial Dysfunction in Diabetes.Acta Med Okayama. 2016 Jun;70(3):151-8. doi: 10.18926/AMO/54413. Acta Med Okayama. 2016. PMID: 27339203 Review.
-
Amyloid Beta and Phosphorylated Tau-Induced Defective Autophagy and Mitophagy in Alzheimer's Disease.Cells. 2019 May 22;8(5):488. doi: 10.3390/cells8050488. Cells. 2019. PMID: 31121890 Free PMC article. Review.
Cited by
-
Impact of aging on mitochondrial respiration in various organs.Physiol Res. 2022 Dec 31;71(S2):S227-S236. doi: 10.33549/physiolres.934995. Physiol Res. 2022. PMID: 36647911 Free PMC article.
-
Organelle-Specific Autophagy in Cellular Aging and Rejuvenation.Adv Geriatr Med Res. 2021;3(2):e210010. doi: 10.20900/agmr20210010. Epub 2021 Apr 9. Adv Geriatr Med Res. 2021. PMID: 33954300 Free PMC article.
-
Interspecies Differences in Proteome Turnover Kinetics Are Correlated With Life Spans and Energetic Demands.Mol Cell Proteomics. 2021;20:100041. doi: 10.1074/mcp.RA120.002301. Epub 2021 Jan 7. Mol Cell Proteomics. 2021. PMID: 33639418 Free PMC article. Review.
-
Aging, Neurodegenerative Disorders, and Cerebellum.Int J Mol Sci. 2024 Jan 13;25(2):1018. doi: 10.3390/ijms25021018. Int J Mol Sci. 2024. PMID: 38256091 Free PMC article. Review.
-
Slowed Protein Turnover in Aging Drosophila Reflects a Shift in Cellular Priorities.J Gerontol A Biol Sci Med Sci. 2021 Sep 13;76(10):1734-1739. doi: 10.1093/gerona/glab015. J Gerontol A Biol Sci Med Sci. 2021. PMID: 33453098 Free PMC article.
References
-
- Chan D. C. (2006). Mitochondria: dynamic organelles in disease, aging, and development. Cell 125 1241–1252. - PubMed
Grants and funding
LinkOut - more resources
Full Text Sources
Other Literature Sources
Miscellaneous