. 2018;6(2):119-127.
doi: 10.1080/21681163.2016.1184589. Epub 2016 Oct 12.

Patient-Specific Flow Descriptors and Normalized wall index in Peripheral Artery Disease: a Preliminary Study

Affiliations

Patient-Specific Flow Descriptors and Normalized wall index in Peripheral Artery Disease: a Preliminary Study

Jaykrishna Singh et al. Comput Methods Biomech Biomed Eng Imaging Vis. 2018.

Abstract

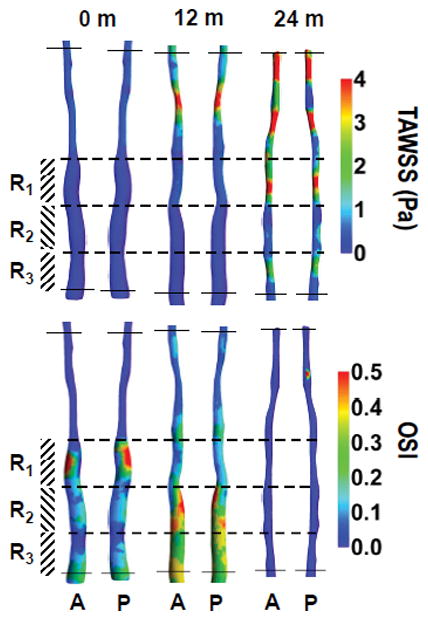
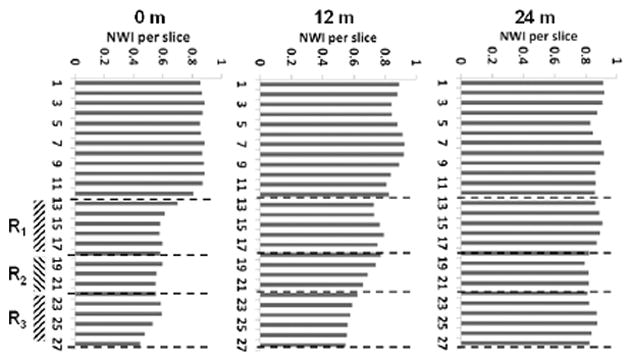
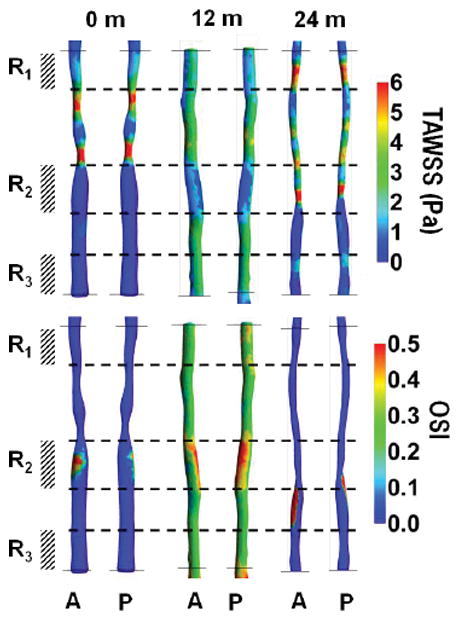
Background and aims: MRI-based hemodynamics have been applied to study the relationship between time-averaged wall shear stresses (TAWSS), oscillatory shear index (OSI) and atherosclerotic lesions in the coronary arteries, carotid artery, and human aorta. However, the role of TAWSS and OSI are poorly understood in lower extremity arteries. The aim of this work was to investigate the feasibility of hemodynamic assessment of the superficial femoral artery (SFA) in patients with peripheral artery disease (PAD) and we hypothesized that there is an association between TAWSS and OSI, respectively, and atherosclerotic burden expressed as the normalized wall index (NWI).

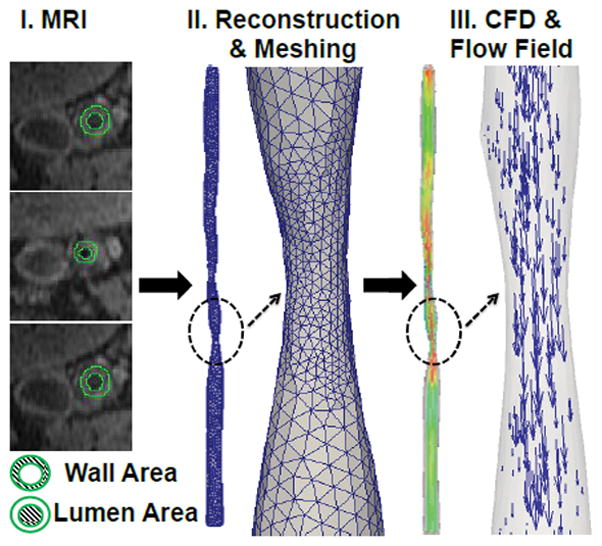
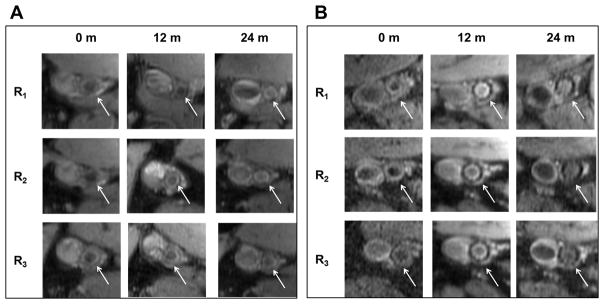
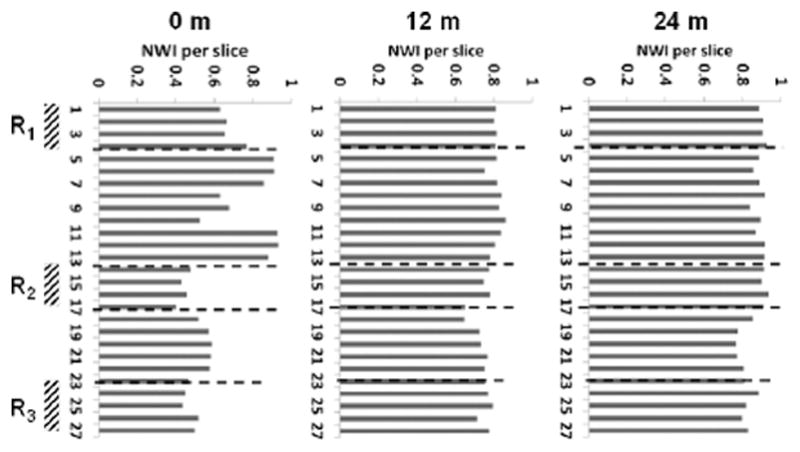
Methods: Six cases of 3D vascular geometries of the SFA and related inlet/outlet flow conditions were extracted from patient-specific MRI data including baseline, 12 and 24 months. Blood flow simulations were performed to compute flow descriptors, including TAWSS and OSI, and NWI.

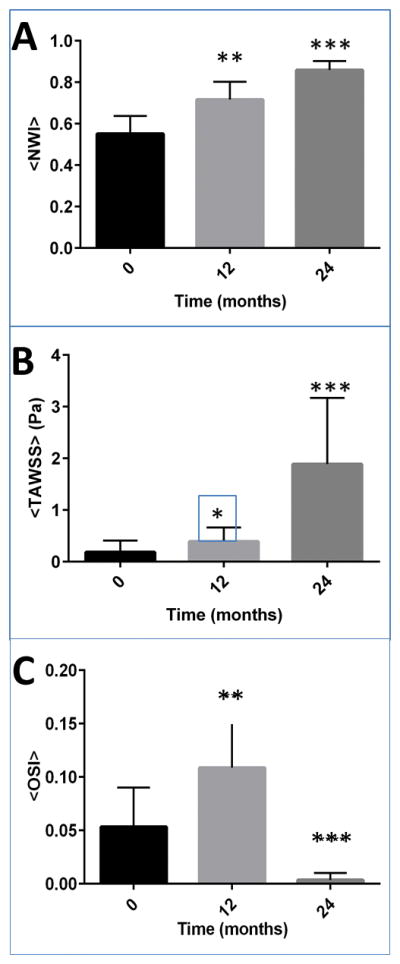
Results: NWI was correlated positively with TAWSS (correlation coefficient: r = 0.592; p < 0.05). NWI was correlated negatively with OSI (correlation coefficient: r = -0.310, p < 0.01). Spatially averaged TAWSS and average NWI increased significantly between baseline and 24-months, whereas OSI decreased over 2-years.

Conclusions: In this pilot study with a limited sample size, TAWSS was positively associated with NWI, a measure of plaque burden, whereas OSI showed an inverse relationship. However, our findings need to be verified in a larger prospective study. MRI-based study of hemodynamics is feasible in the superficial femoral artery.


Conflict of interest statement

Conflict of interest: None (JS), None (GB), None (JM), None (CB), None (AL), None (DS), None (PD).

Figures

Figure 1
Figure 1
I) MR image at the arbitrary location of the superficial femoral artery (SFA) II) Vascular geometry reconstruction and meshing; III) simulated blood flow and corresponding flow field.
Figure 2
Figure 2
(case-1, 2 and 3) show the plot of time-averaged wall shear stress (TAWSS in Pa) and oscillatory shear index (OSI, dimensionless) over a full cardiac cycle, respectively in a superficial femoral artery (SFA). Letters A and P represent the anterior and posterior view of the artery with co-registered regions at baseline (case-1: pre-intervention) and post-intervention 12 & 24-months (case-2 and 3 respectively). Color bars in the right panel represent a range of TAWSS and OSI values, respectively.
Figure 3
Figure 3
(case-4, 5 and 6) show the plot of time-averaged wall shear stress (TAWSS in Pa) and oscillatory shear index (OSI, dimensionless) over a full cardiac cycle, respectively in a superficial femoral artery (SFA). Letters A and P represent the anterior and posterior view of the artery with co-registered regions at baseline (case-4: pre-intervention) and post-intervention 12 & 24-months (case-5 and 6 respectively). Color bars in the right panel represent a range of TAWSS and OSI values, respectively.
Figure 4
Figure 4
(A: case-1, 2 and 3) Attached MR images represent one of the locations of the region of interest R1, R2, R3 at baseline (pre-intervention) and post-intervention 12 & 24-months. The White arrow indicates the location of the superficial femoral artery. Similarly, (B: case-4, 5 and 6) attached MR images represent one of the slices of a region of interest R1, R2, R3 at 0, 12 & 24-months.
Figure 5
Figure 5
(case-1, 2 and 3) shows the plot of normalized wall index (NWI) for co-registered MRI slices in the artery at 0, 12 and 24-months. R1, R2, and R3 are a region of interest.
Figure 6
Figure 6
(case-4, 5 and 6) shows the plot of normalized wall index (NWI) for co-registered MRI slices in the artery at baseline, 12-months, and 24-months. R1, R2, and R3 denote a region of interests.
Figure 7
Figure 7
Shows the plot of (A) the plot of average normalized wall index (NWI), (B) the spatial average of TAWSS [Pa]; (C) the spatial average of OSI for all six cases specifically at the region of interest R1, R2, and R3. Shown error bars are standard error, and ** indicates significance from baseline (P-value < 0.01) and *** indicates significance from baseline (P-value < 0.001). For this plot, a sample size of MRI slices was 90. Non-parametric Kruskal-Wallis test and Dunn’s multiple comparison tests were performed to assess significance.

Similar articles

Cited by

References

    1. Walker CM, et al. Multidisciplinary approach to the diagnosis and management of patients with the peripheral arterial disease. Clinical Interventions in Aging. 2015;10:1147–1153. - PMC - PubMed
    1. Heinen Y, et al. Local Association Between Endothelial Dysfunction and Intimal Hyperplasia: Relevance in Peripheral Artery Disease. Journal of the American Heart Association. 2015;4(2) - PMC - PubMed
    1. de Beer D, et al. Longitudinal Telomere Erosion in Lymphocyte Subsets of Patients with Atherosclerotic Peripheral Arterial Disease (PAD) Journal of Clinical and Diagnostic Research : JCDR. 2015;9(3):OM01–OM03. - PMC - PubMed
    1. Bentzon JF, et al. Mechanisms of Plaque Formation and Rupture. Circulation Research. 2014;114(12):1852–1866. - PubMed
    1. Lim GB. Vascular disease: Peripheral artery disease pandemic. Nat Rev Cardiol. 2013;10(10):552–553. - PubMed