. 2018 Feb 28;4(2):eaao4350.
doi: 10.1126/sciadv.aao4350. eCollection 2018 Feb.

Coral reef structural complexity provides important coastal protection from waves under rising sea levels

Affiliations

Coral reef structural complexity provides important coastal protection from waves under rising sea levels

Daniel L Harris et al. Sci Adv. .

Abstract

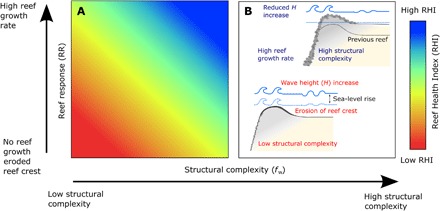
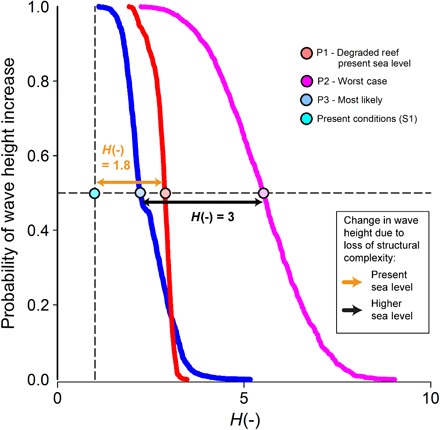
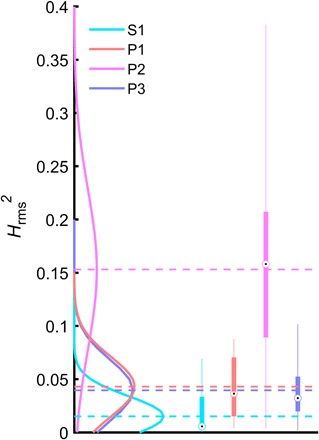
Coral reefs are diverse ecosystems that support millions of people worldwide by providing coastal protection from waves. Climate change and human impacts are leading to degraded coral reefs and to rising sea levels, posing concerns for the protection of tropical coastal regions in the near future. We use a wave dissipation model calibrated with empirical wave data to calculate the future increase of back-reef wave height. We show that, in the near future, the structural complexity of coral reefs is more important than sea-level rise in determining the coastal protection provided by coral reefs from average waves. We also show that a significant increase in average wave heights could occur at present sea level if there is sustained degradation of benthic structural complexity. Our results highlight that maintaining the structural complexity of coral reefs is key to ensure coastal protection on tropical coastlines in the future.


Figures

Fig. 1
Fig. 1. Conceptual diagram showing the future scenarios of coral reef structural complexity and vertical reef accretion.
The RHI measures the capacity of a coral reef to accrete vertically and maintain structurally complex coral communities, with red indicating a low RHI and blue indicating a high RHI.
Fig. 2
Fig. 2. Changes in back-reef wave height for three scenarios.
P1, coral reef degradation at present sea level; P2, the worst-case scenario by 2100; and P3, the most likely scenario by 2100. The circle markers show the mean result for each scenario. The mean of the present wave conditions (scenario S1 in the Supplementary Materials) is also shown as the cyan marker. The wave dissipation [in terms of H(-)] provided by coral reef structural complexity (fw) is shown by the orange arrowed line (present sea level) and black arrowed line (higher sea levels). The vertical dashed line represents present wave conditions where H(-) = 1, and the horizontal dashed line is the 50% probability line (P = 0.5).
Fig. 3
Fig. 3. Box plots and distribution of Hrms2 for the three scenarios.
P1, coral reef degradation at present sea level; P2, the worst-case scenario by 2100; P3, the most likely scenario by 2100; and S1, the coral reef under present conditions. Boxes show the interquartile range (IQR, 25th and 75th percentiles) of the Hrms2 values. Whiskers represent the distance of 1.5 IQR from the 25th and 75th percentiles, and circle markers show the median values. Dashed lines show the mean Hrms2 values of which correspond with the peak of the wave height distributions shown as solid lines. Wave height distributions were calculated probability density functions in MATLAB.
Fig. 4
Fig. 4. Controls on future back-reef wave heights in coral reefs for scenario P3.
The influence of sea-level rise (SLR), RR, structural complexity (fw), and RHI on wave height is shown for 40,000 model runs. (A) Scatterplot showing the influence of sea-level rise on normalized back-reef wave height (Hn, subscript n indicating normalized values between 0 and 1), with marker colors indicating the normalized values of structural complexity (fwn) for the model run, with blue indicating high fwn and red indicating low fwn. The dashed trend line is the linear regression result where Hn = 0.81SLR − 0.06 (R2 = 0.09). (B) Strong relationship between RHI and back-reef wave height with the dashed black line showing the fitted curve Hn = −0.66RHIn + 0.66 (R2 = 0.53). The dashed red line is the 1:−1 ratio shown for comparison. (C) Distribution of Hn due to changes in fw and RR.

References

    1. Hearn C. J., Wave-breaking hydrodynamics within coral reef systems and the effect of changing relative sea level. J. Geophys. Res. Oceans 104, 30007–30019 (1999).
    1. Monismith S. G., Rogers J. S., Koweek D., Dunbar R. B., Frictional wave dissipation on a remarkably rough reef. Geophys. Res. Lett. 42, 4063–4071 (2015).
    1. Ferrario F., Beck M. W., Storlazzi C. D., Micheli F., Shepard C. C., Airoldi L., The effectiveness of coral reefs for coastal hazard risk reduction and adaptation. Nat. Commun. 5, 3794 (2014). - PMC - PubMed
    1. Dickinson W. R., Pacific atoll living: How long already and until when. GSA Today 19, 4–10 (2009).
    1. Storlazzi C. D., Elias E. P. L., Berkowitz P., Many atolls may be uninhabitable within decades due to climate change. Sci. Rep. 5, 14546 (2015). - PMC - PubMed

Publication types

LinkOut - more resources