. 2018 May;256(5):935-949.
doi: 10.1007/s00417-018-3905-0. Epub 2018 Mar 5.

Gene expression in retinal ischemic post-conditioning

Affiliations

Gene expression in retinal ischemic post-conditioning

Konrad Kadzielawa et al. Graefes Arch Clin Exp Ophthalmol. 2018 May.

Abstract

Purpose: The pathophysiology of retinal ischemia involves mechanisms including inflammation and apoptosis. Ischemic post-conditioning (Post-C), a brief non-lethal ischemia, induces a long-term ischemic tolerance, but the mechanisms of ischemic post-conditioning in the retina have only been described on a limited basis. Accordingly, we conducted this study to determine the molecular events in retinal ischemic post-conditioning and to identify targets for therapeutic strategies for retinal ischemia.

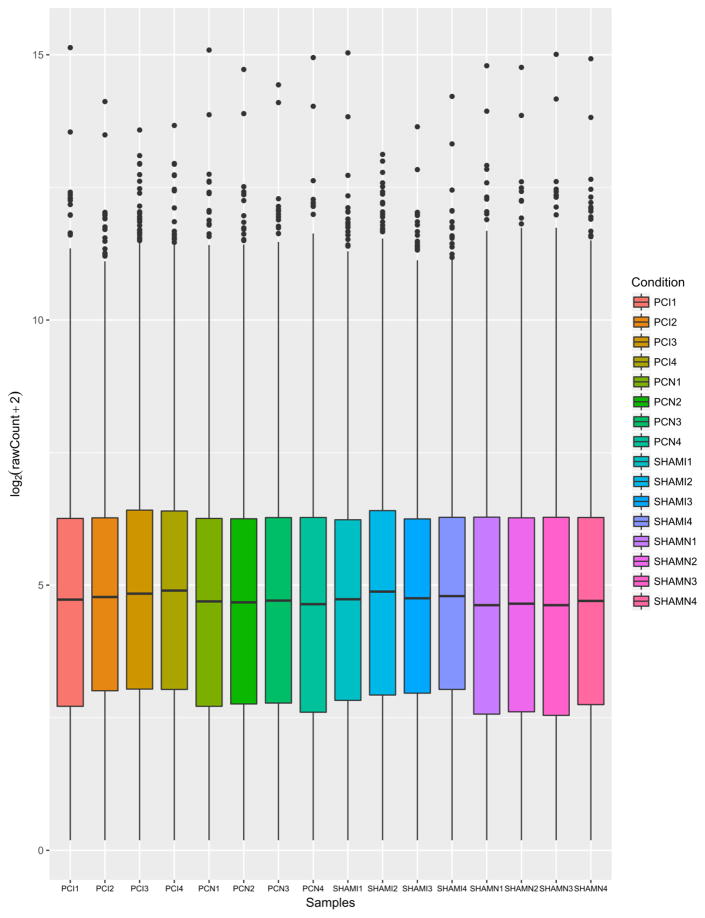
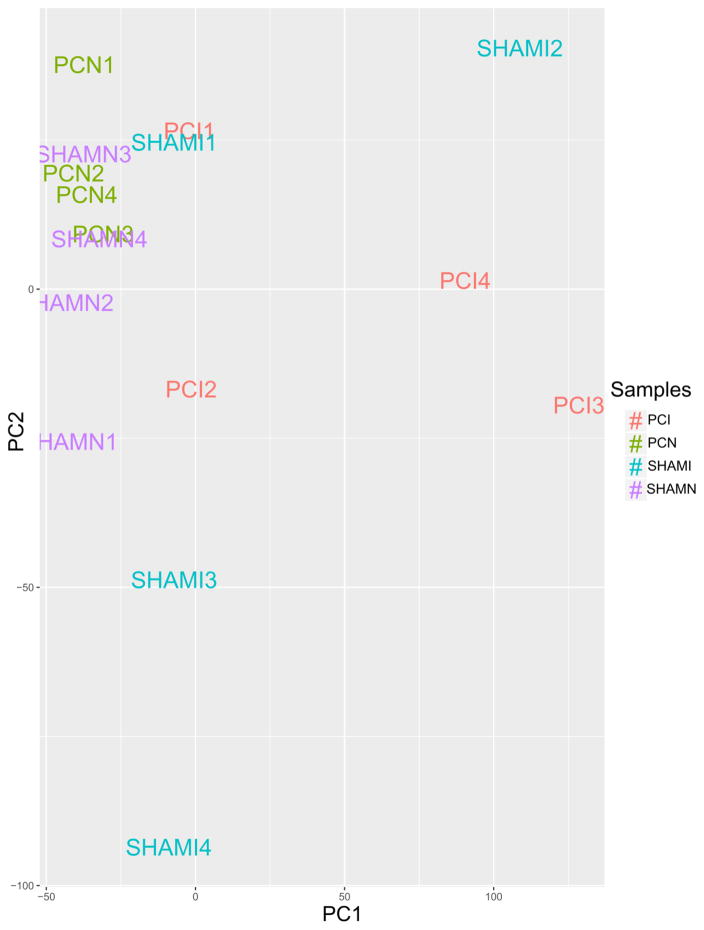
Methods: To determine global molecular events in ischemic post-conditioning, a comprehensive study of the transcriptome of whole retina was performed. We utilized RNA sequencing (RNA-Seq), a recently developed, deep sequencing technique enabling quantitative gene expression, with low background noise, dynamic detection range, and discovery of novel genes. Rat retina was subjected to ischemia in vivo by elevation of intraocular pressure above systolic blood pressure. At 24 h after ischemia, Post-C or sham Post-C was performed by another, briefer period of ischemia, and 24 h later, retinas were collected and RNA processed.

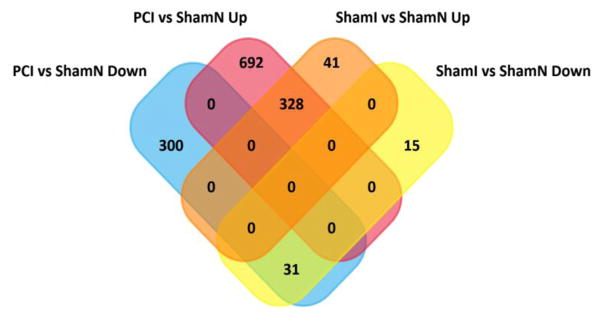
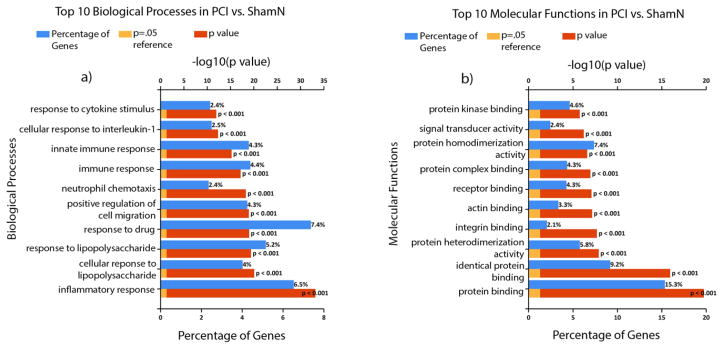
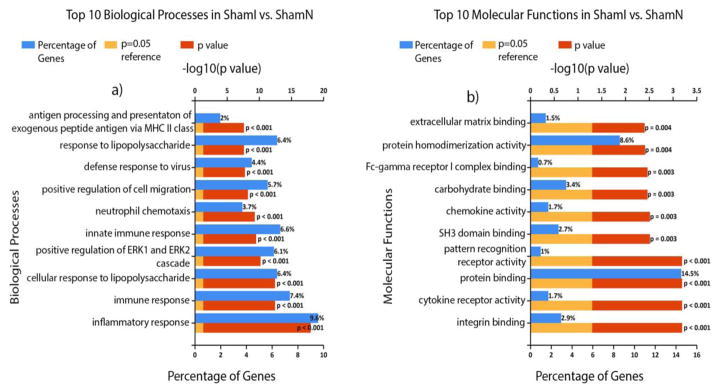
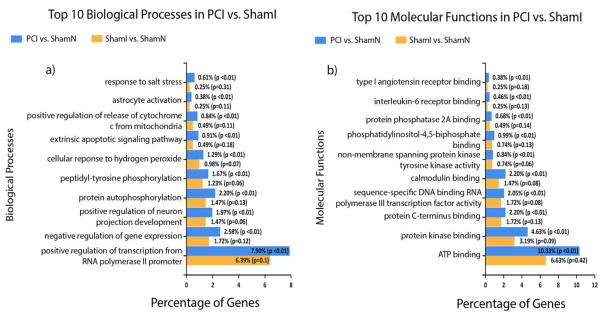
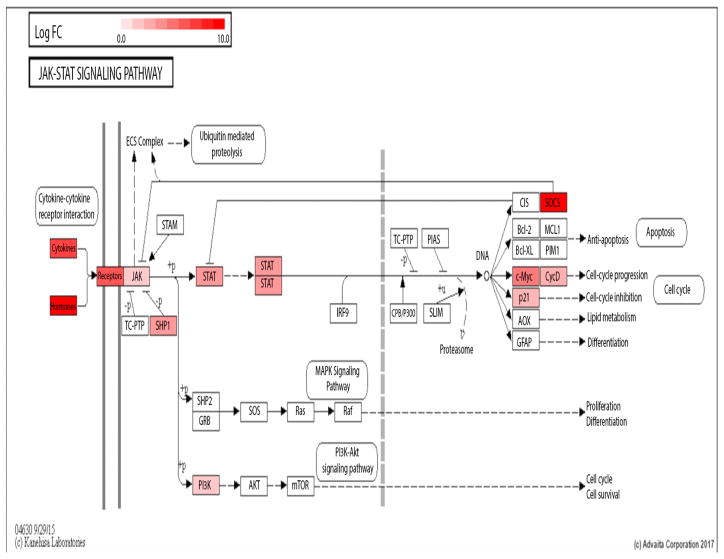
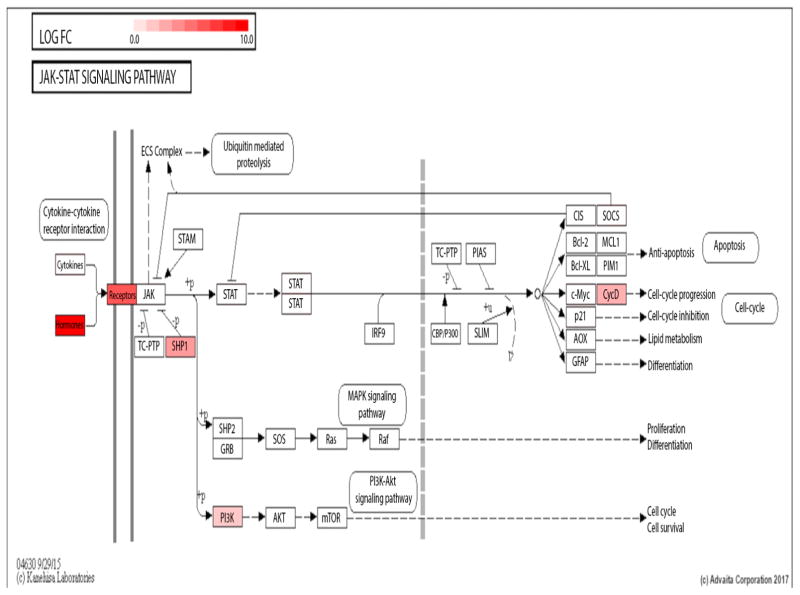
Results: There were 71 significantly affected pathways in post-conditioned/ischemic vs. normals and 43 in sham post conditioned/ischemic vs. normals. Of these, 28 were unique to Post-C and ischemia. Seven biological pathways relevant to ischemic injury, in Post-C as opposed to sham Post-C, were examined in detail. Apoptosis, p53, cell cycle, JAK-STAT, HIF-1, MAPK and PI3K-Akt pathways significantly differed in the number as well as degree of fold change in genes between conditions.

Conclusion: Post-C is a complex molecular signaling process with a multitude of altered molecular pathways. We identified potential gene candidates in Post-C. Studying the impact of altering expression of these factors may yield insight into new methods for treating or preventing damage from retinal ischemic disorders.

Keywords: Ischemia; Post-conditioning; RNA-Seq; Retina.


Figures

Fig. 1
Fig. 1
Gene expression in each sample, contrasting their respective distributions; generated using R v. 3.2.2 and ggplot2_2.2.1. Individual samples (x-axis) and their log2-transformed expression count (y-axis) are shown. Prior count of 2 was added in order to avoid log evaluation errors. Results confirm that the distribution of expression of individual genes is quite similar across the samples after normalization was performed, as well as that treatment did not have a profound effect at the genome-wide expression level.
Fig. 2
Fig. 2
Principal Component Analysis (PCA) plot of the filtered, normalized and log2-transformed count matrix, assessing the overall effect of experimental covariates and batch effects - generated with R v. 3.2.2, ggplot2_2.2.1 andggfortify_0.4.1. The first two components (x-and y-axis) were used and next order components are available in the Data Supplement. We noticed a higher variation in PCI3 and PCI4 and ShamI2, most likely due to natural variation in biological samples.
Fig. 3
Fig. 3
Four-way quantitative summary of the differential expression analysis results generated with FunRich 3.0. Overall, of 1352 DEGs present in PCI vs ShamN and 416 DEGs present in ShamI vs ShamN, 328 were up-regulated and 31 were down-regulated in both groups, while 692 genes were uniquely up-regulated in PCI vs ShamN in contrast to 41 in ShamI vs ShamN. The vast majority of up-regulated genes in ShamI vs ShamN, were also up-regulated in PCI vs ShamN (328 genes). Similarly, 300 genes were found to be significantly down-regulated in PCI vs ShamN to 15 in ShamI vs ShamN. See Supplemental Tables 8–11 for the complete data set used to construct Fig 3. https://uofi.box.com/s/7cpuceq42fz0tk6jpgp8e9cvl9fiv2in
Fig. 4
Fig. 4
Functional analysis figures were generated with FunRich 3.0 [16] and Gene Ontology (GO) Norway rat (Taxon ID: 10116) database [17, 18]. Shown are the top 10 biological processes (a) and molecular functions (b) for PCI vs ShamN arranged according to increasing P (or decreasing log10(P value)). Percentage of differentially expressed genes belonging to each process is shown as blue bars. log10(P =0.05) is shown as a reference.
Fig. 5
Fig. 5
Functional analysis figures were generated with FunRich 3.0 [16] and Gene Ontology (GO) Norway rat (Taxon ID: 10116) database [17, 18]. Shown are the top 10 biological processes (a) and molecular functions (b) for ShamI vs ShamN, arranged according to increasing P (or decreasing −log10(P value)). Percentage of differentially expressed genes belonging to each process is shown as blue bars.−log10(P =0.05) is shown as a reference.
Fig. 6
Fig. 6
Top 10 biological processes (a) and molecular functions (b) “uniquely” affecting PCI vs ShamN, i.e. biological processes and functions with P ≤ 0.05 in PCI vs ShamN and P > 0.05 in ShamI vs ShamN. Figures were generated with FunRich 3.0[16] and Gene Ontology (GO) Norway rat (Taxon ID: 10116) database [17, 18].Percentage of DEGs belonging to a particular process/function is shown in blue bars (PCI) and yellow bars (ShamI).
Fig. 7
Fig. 7
Jak-STAT KEGG pathway diagram for PCI vs ShamN and ShamI vs ShamN respectively. Diagrams were downloaded from iPathwayGuide’s pathways feature [19]. Significantly affected genes between conditions are colored and the intensity of the color reveals the magnitude of the fold change of a given gene (genes in red indicate up-regulation; genes in blue indicate down-regulation). Only the genes with an absolute value of log2(fold change) ≥ 2 and Q ≤ 0.05 were considered significant.
Fig. 8
Fig. 8
Jak-STAT KEGG pathway diagram for PCI vs ShamN and ShamI vs ShamN respectively. Diagrams were downloaded from iPathwayGuide’s pathways feature [19]. Significantly affected genes between conditions are colored and the intensity of the color reveals the magnitude of the fold change of a given gene (genes in red indicate up-regulation; genes in blue indicate down-regulation). Only the genes with an absolute value of log2(fold change) ≥ 2 and Q ≤ 0.05 were considered significant.

References

    1. Zheng L, Gong B, Hatala DA, Kern TS. Retinal ischemia and reperfusion causes capillary degeneration: similarities to diabetes. Invest Ophthalmol Vis Sci. 2007;48:361–367. - PubMed
    1. Dreixler JC, Poston JN, Shaikh AR, Alexander M, Tupper KY, Marcet MM, Bernaudin M, Roth S. Delayed post-ischemic conditioning significantly improves the outcome after retinal ischemia. ExpEye Res. 2011;92:521–527. doi: 10.1016/j.exer.2011.03.015. - DOI - PMC - PubMed
    1. Fernandez DC, Bordone MP, Chianelli MS, Rosenstein RE. Retinal neuroprotection against ischemia-reperfusion damage induced by postconditioning. Invest Ophthalmol Vis Sci. 2009;50:3922–3930. - PubMed
    1. Osborne NN, Ugarte M, Chao M, Chidlow G, Bae JH, Wood JP, Nash MS. Neuroprotection in relation to retinal ischemia and relevance to glaucoma. Surv Ophthalmol. 1999;43(Suppl 1):S102–128. - PubMed
    1. Limalanathan S, Andersen GO, Hoffmann P, Klow N-E, Abdelnoor M, Eritsland J. Rationale and design of the POSTEMI (postconditioning in ST-elevation myocardial infarction) study. Cardiology. 2010;116:103–109. - PubMed