. 2018 Jun;39(6):2391-2404.
doi: 10.1002/hbm.24009. Epub 2018 Mar 5.

Brain dynamics in ASD during movie-watching show idiosyncratic functional integration and segregation

Affiliations

Brain dynamics in ASD during movie-watching show idiosyncratic functional integration and segregation

Thomas A W Bolton et al. Hum Brain Mapp. 2018 Jun.

Abstract

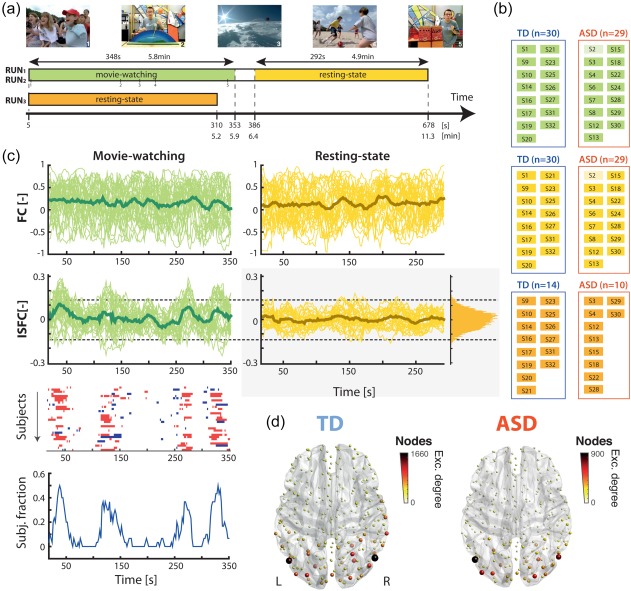
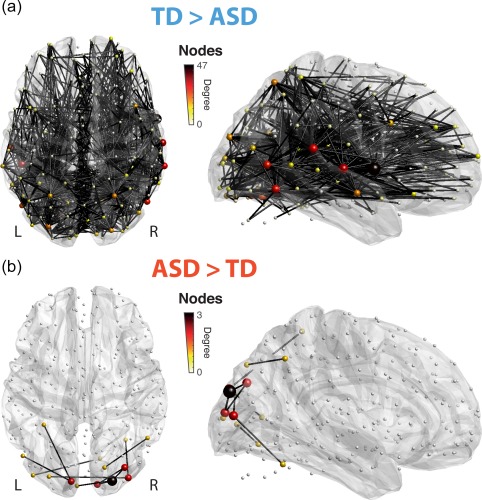
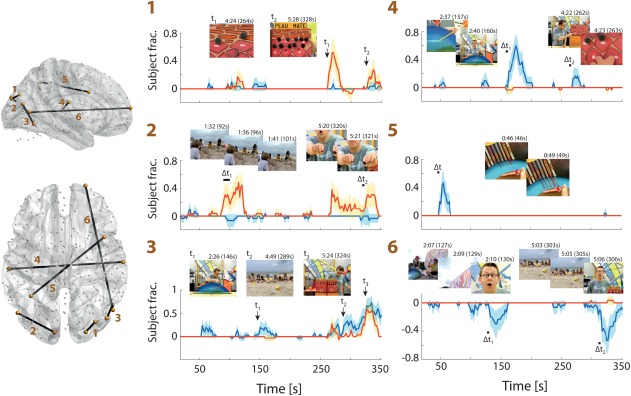
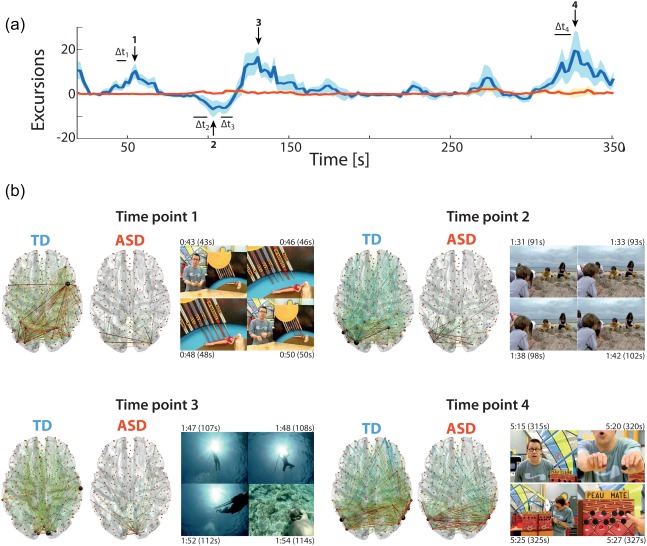
To refine our understanding of autism spectrum disorders (ASD), studies of the brain in dynamic, multimodal and ecological experimental settings are required. One way to achieve this is to compare the neural responses of ASD and typically developing (TD) individuals when viewing a naturalistic movie, but the temporal complexity of the stimulus hampers this task, and the presence of intrinsic functional connectivity (FC) may overshadow movie-driven fluctuations. Here, we detected inter-subject functional correlation (ISFC) transients to disentangle movie-induced functional changes from underlying resting-state activity while probing FC dynamically. When considering the number of significant ISFC excursions triggered by the movie across the brain, connections between remote functional modules were more heterogeneously engaged in the ASD population. Dynamically tracking the temporal profiles of those ISFC changes and tying them to specific movie subparts, this idiosyncrasy in ASD responses was then shown to involve functional integration and segregation mechanisms such as response inhibition, background suppression, or multisensory integration, while low-level visual processing was spared. Through the application of a new framework for the study of dynamic experimental paradigms, our results reveal a temporally localized idiosyncrasy in ASD responses, specific to short-lived episodes of long-range functional interplays.

Keywords: autism spectrum disorders; dynamic functional connectivity; idiosyncrasy; inter-subject functional correlation; naturalistic movie; sliding window; underconnectivity theory of autism.


Figures

Figure 1
Figure 1
Recording paradigm and ISFC analysis. (a) Each subject underwent three separate acquisition runs: in the first two (RUN1, RUN2), 5.8 min of movie‐watching were followed by 4.9 min of eyes closed resting‐state. In the third one (RUN3), there was only a 310s‐long resting‐state acquisition. The movie watched by the subjects incorporated various types of stimuli, such as emotional scenes (example frame 1), scientific explanations (example frames 2 and 5), landscape depictions (example frame 3), or interactions between children and one of the presenters (example frame 4). (b) Separate ISFC computations were performed on the TD and ASD populations, for three settings: the movie‐watching sections (first half of RUN1 and RUN2, green), the resting‐state subparts following movie‐watching (second half of RUN1 and RUN2, yellow), and the purely resting‐state runs (RUN3, orange). The indices and amount of retained subjects for each setting are written down, and a more transparent box highlights cases where only one run (RUN1) was used. Blue and red rectangular contours mark the sets of runs selected for a given ISFC computation. (c) Example connectivity time courses for TD subjects (thin lines) and their average (thick line), computed with a standard sliding window methodology (top row) or with ISFC (bottom row), on the movie‐watching sections (left, green curves) or the subsequent resting‐state sections (right, yellow curves). To threshold a movie‐watching ISFC time course, a null distribution of values gathered from RS ISFC measurements (right‐hand side, light gray box) is used (dashed lines highlight example thresholds). This results, for each subject, in an ISFC time course with highlighted positive/negative excursions (+1/−1) that can be used either to count the number of excursions that occurred, or to track the fraction of subjects exhibiting significant ISFC changes at a given time point. (d) For the TD (left) and ASD (right) populations, average nodal degree for excursion number [Color figure can be viewed at http://wileyonlinelibrary.com]
Figure 2
Figure 2
Responsiveness to the movie. Connections showing significantly more ISFC excursions in the TD group (a) or the ASD group (b) displayed on a horizontal (left) or sagittal (right) brain view. The size and color of the nodes are proportional to the number of incoming significant connections. The right side is facing towards the reader in sagittal depictions [Color figure can be viewed at http://wileyonlinelibrary.com]
Figure 3
Figure 3
ISFC excursion time courses for selected connections. (Left) Sagittal and horizontal brain slices depicting the connections (from 1 to 6) chosen for display. (Right) For TD (blue) or ASD (red) subjects, ISFC excursion time courses for the selected connections are displayed with two‐tailed 95% confidence intervals. In each case, for the most salient ISFC transients, the movie time points that triggered the changes are highlighted by an arrow (for one frame) or a horizontal bar (for a subset of frames). Illustrations of the related frames are also displayed at the top of each plot, along with their time of occurrence. Note that an ISFC estimate is drawn at the last movie time point that was included to compute it [Color figure can be viewed at http://wileyonlinelibrary.com]
Figure 4
Figure 4
Whole‐brain ISFC transient patterns. (a) ISFC excursion time courses for TD (blue) or ASD (red) subjects, summed across all connections retained as group‐specific. Peak time points (from 1 to 4) are labeled by vertical arrows, and the movie frames that triggered the ISFC changes are labeled by horizontal bars. Note that an ISFC estimate is drawn at the last movie time point that was included to compute it. (b) For the selected time points, whole‐brain horizontal depiction of the connections that were undergoing significant ISFC excursions in TD (left slice) and ASD (right slice) subjects, and example frames from the movie time span that triggered the appearance of the pattern (right panel), with annotated times at which the frames occurred. Stroke thickness in the brain plots is proportional to the fraction of subjects that showed a significant ISFC increase (in red) or decrease (in blue). The size and color of the spheres are proportional to nodal degree. TD and ASD brain plots from the same time point are at the same scale, and can thus directly be compared for edge thickness and node size [Color figure can be viewed at http://wileyonlinelibrary.com]

References

    1. Allen, E. A. , Damaraju, E. , Plis, S. M. , Erhardt, E. B. , Eichele, T. , & Calhoun, V. D. (2014). Tracking whole‐brain connectivity dynamics in the resting state. Cerebral Cortex (New York, N.Y. : 1991), 24(3), 663–676. - PMC - PubMed
    1. American Psychiatric Association . (2013). Diagnostic and statistical manual of mental disorders (DSM‐5®) (p. 991). Arlington (VA): American Psychiatric Publishing.
    1. Anderson, J. S. , Nielsen, J. A. , Froehlich, A. L. , DuBray, M. B. , Druzgal, T. J. , Cariello, A. N. , … Lainhart, J. E. (2011). Functional connectivity magnetic resonance imaging classification of autism. Brain, 134(12), 3742–3754. - PMC - PubMed
    1. Baron‐Cohen, S. , Wheelwright, S. , Skinner, R. , Martin, J. , & Clubley, E. (2001). The autism‐spectrum quotient (AQ): Evidence from asperger syndrome/high‐functioning autism, malesand females, scientists and mathematicians. Journal of Autism and Developmental Disorders, 31(1), 5–17. - PubMed
    1. Betzel, R. F. , Fukushima, M. , He, Y. , Zuo, X. N. , & Sporns, O. (2016). Dynamic fluctuations coincide with periods of high and low modularity in resting‐state functional brain networks. NeuroImage, 127, 287–297. - PMC - PubMed

Publication types