

Induction of Amyloid-β42 Production by Fipronil and Other Pyrazole Insecticides
- PMID: 29504531
- PMCID: PMC7065497
- DOI: 10.3233/JAD-170875
Induction of Amyloid-β42 Production by Fipronil and Other Pyrazole Insecticides
Abstract
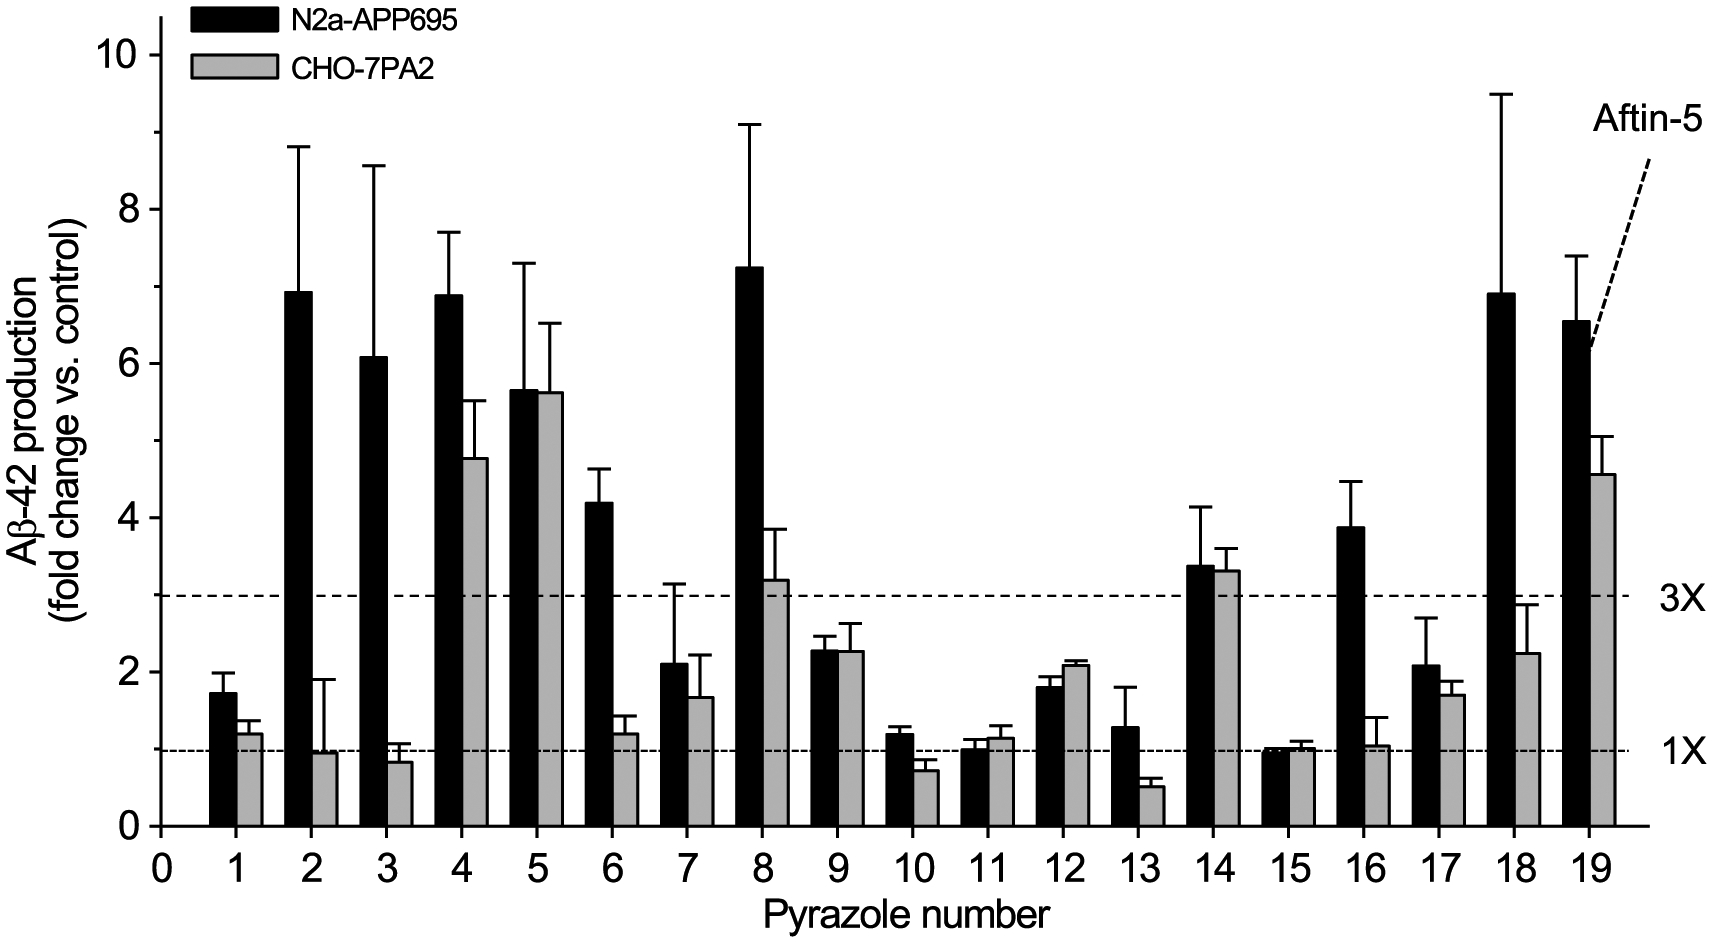
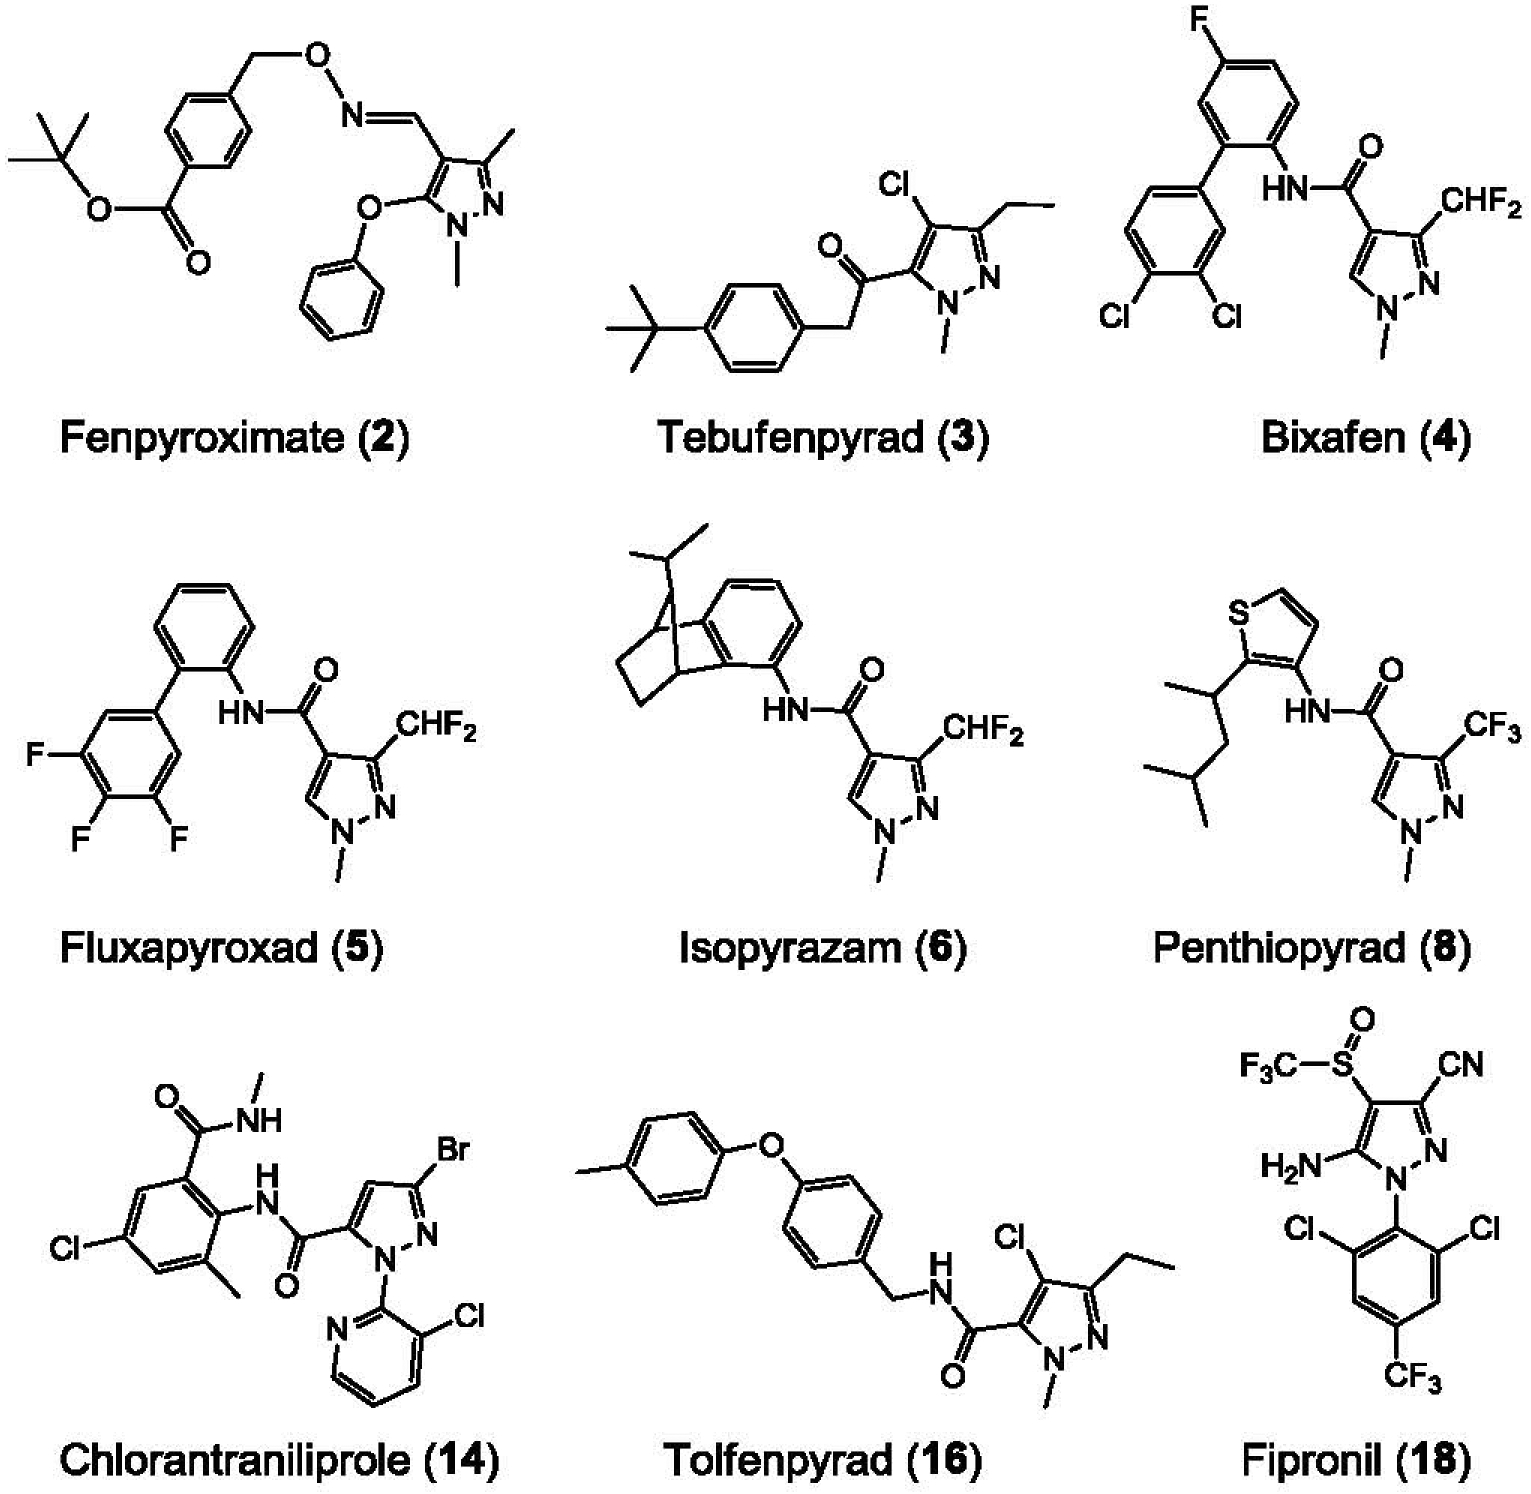
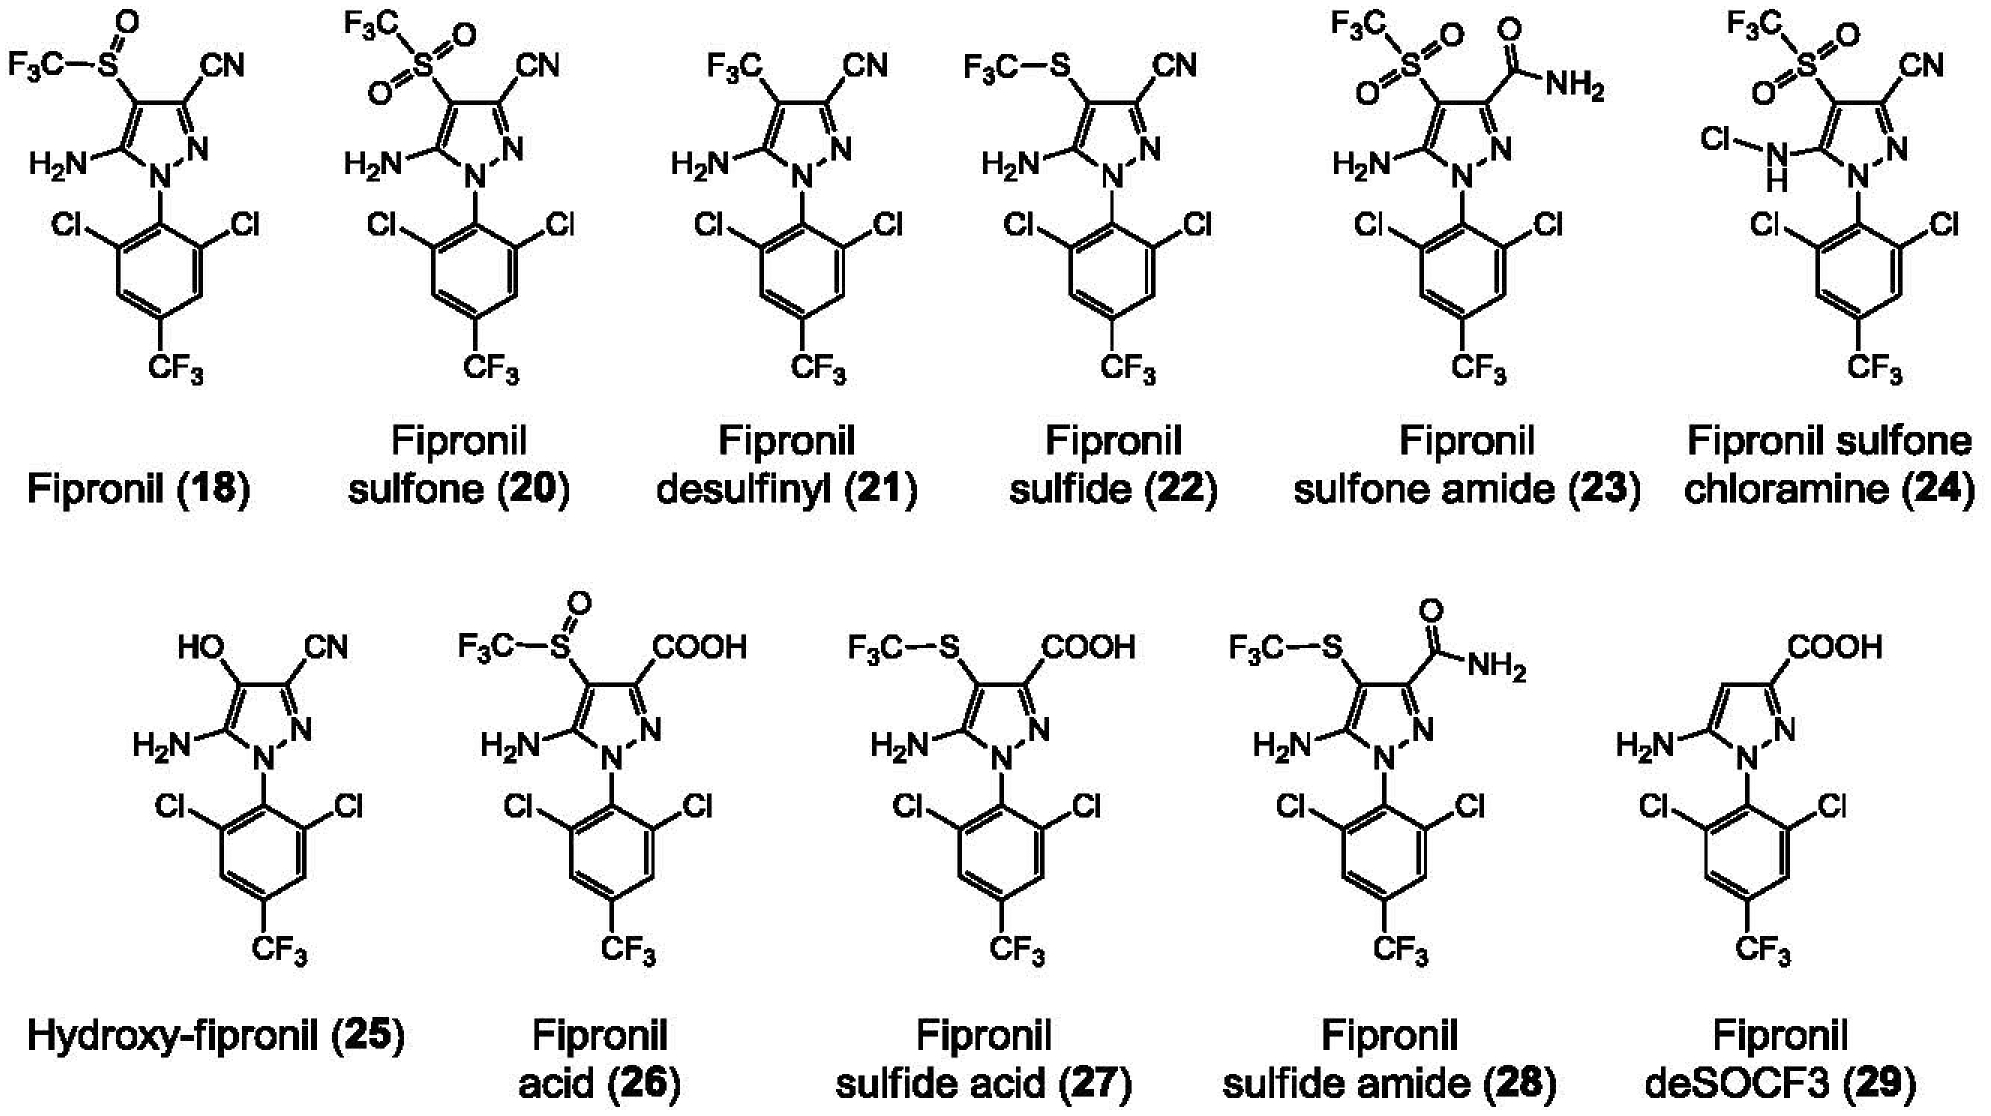
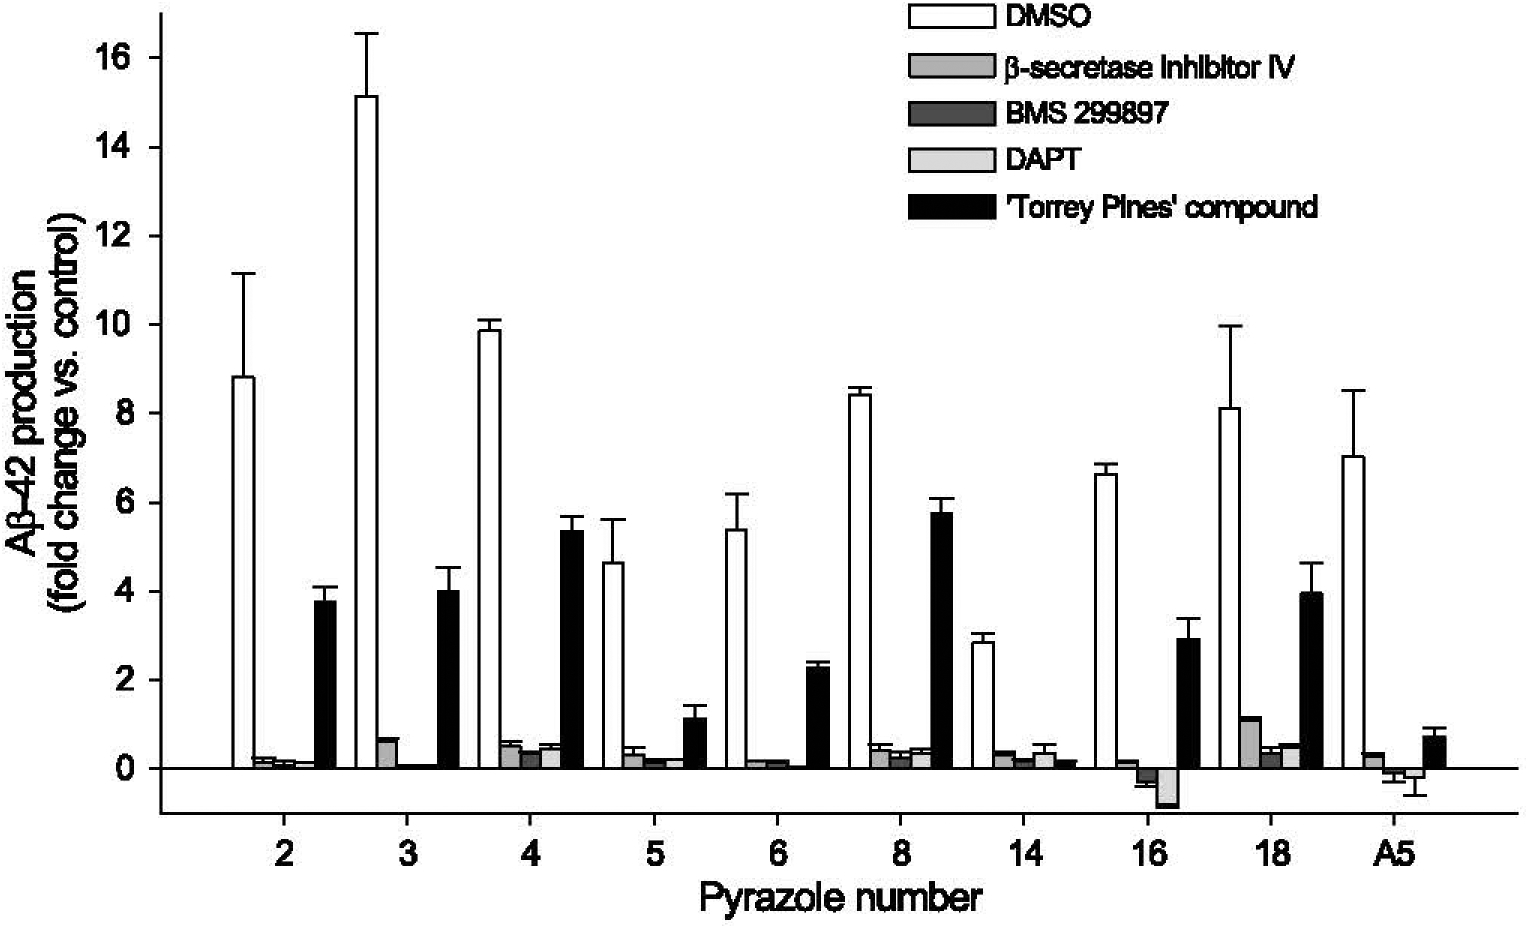
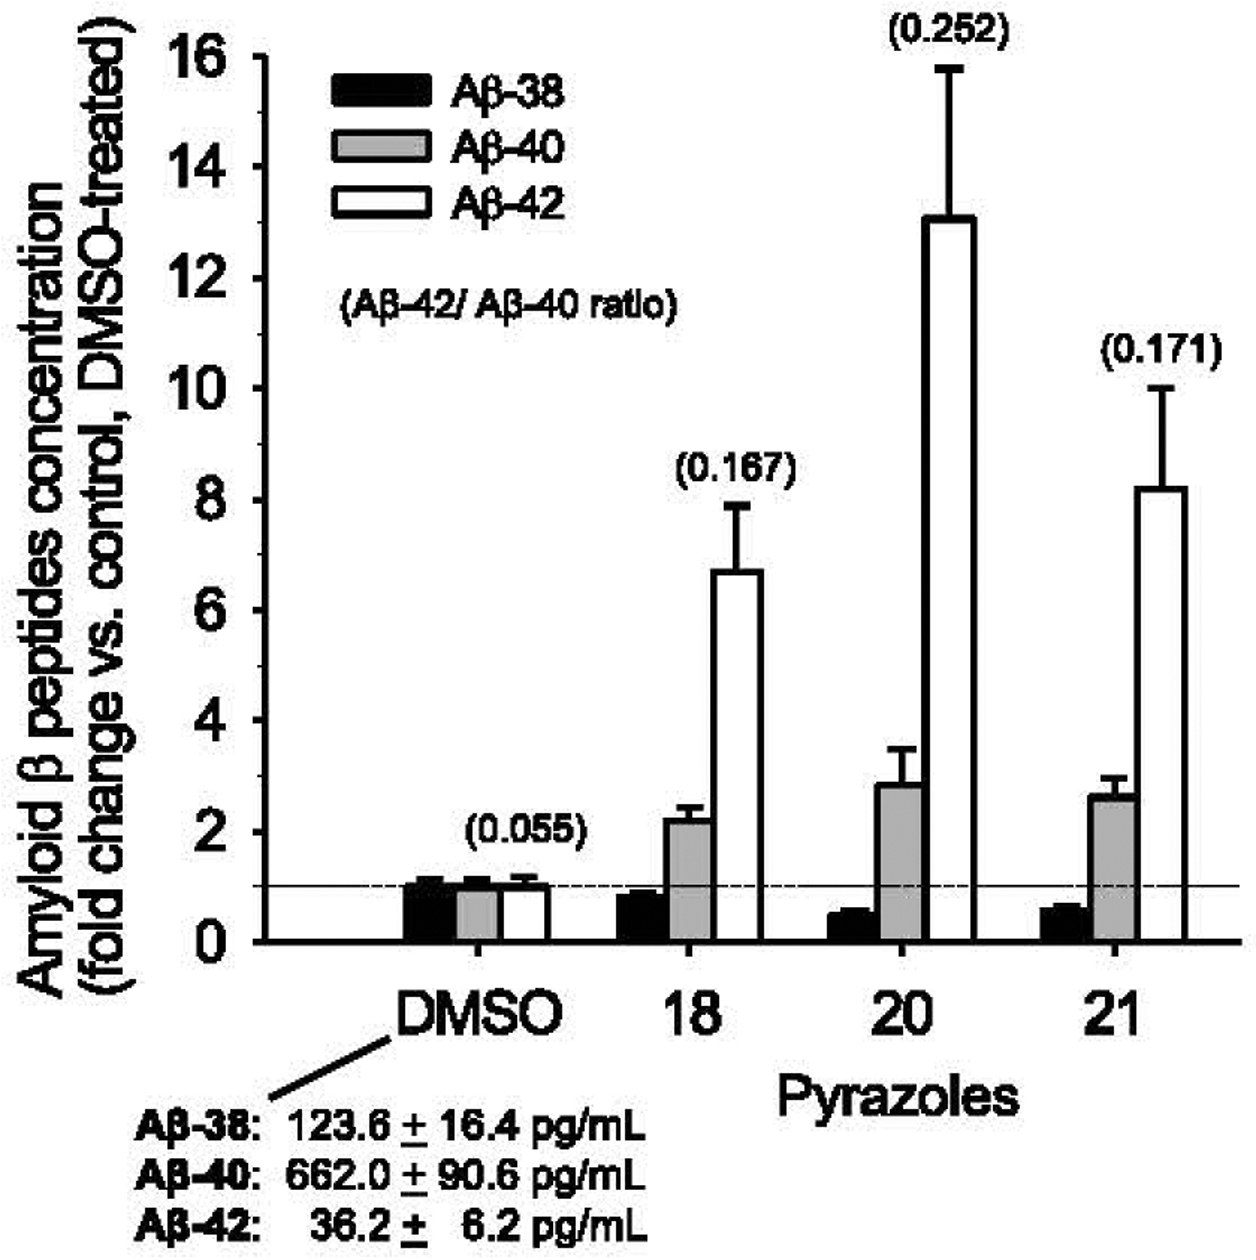
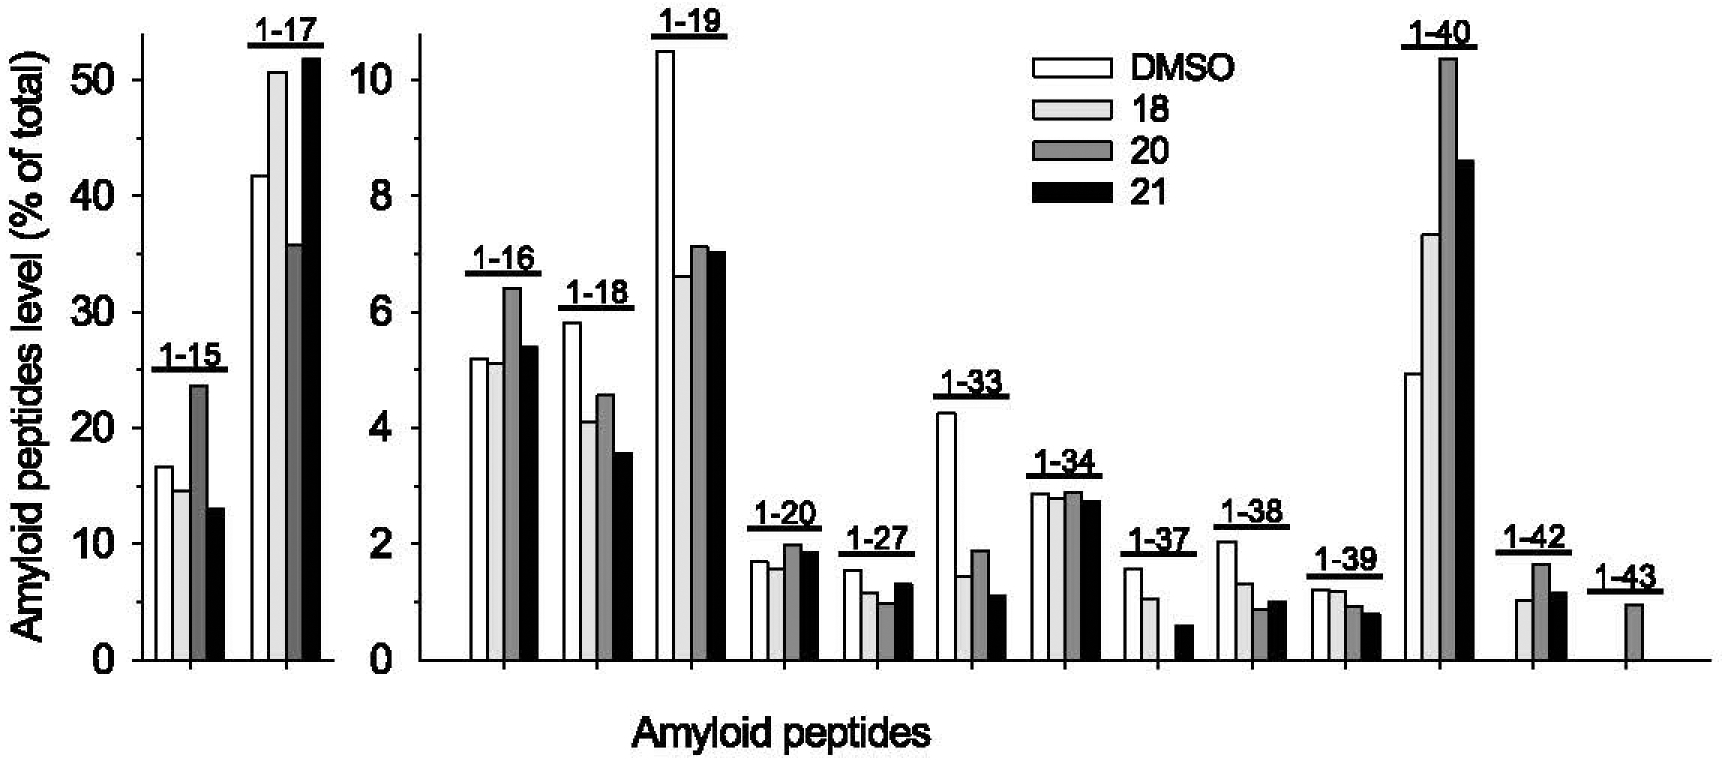
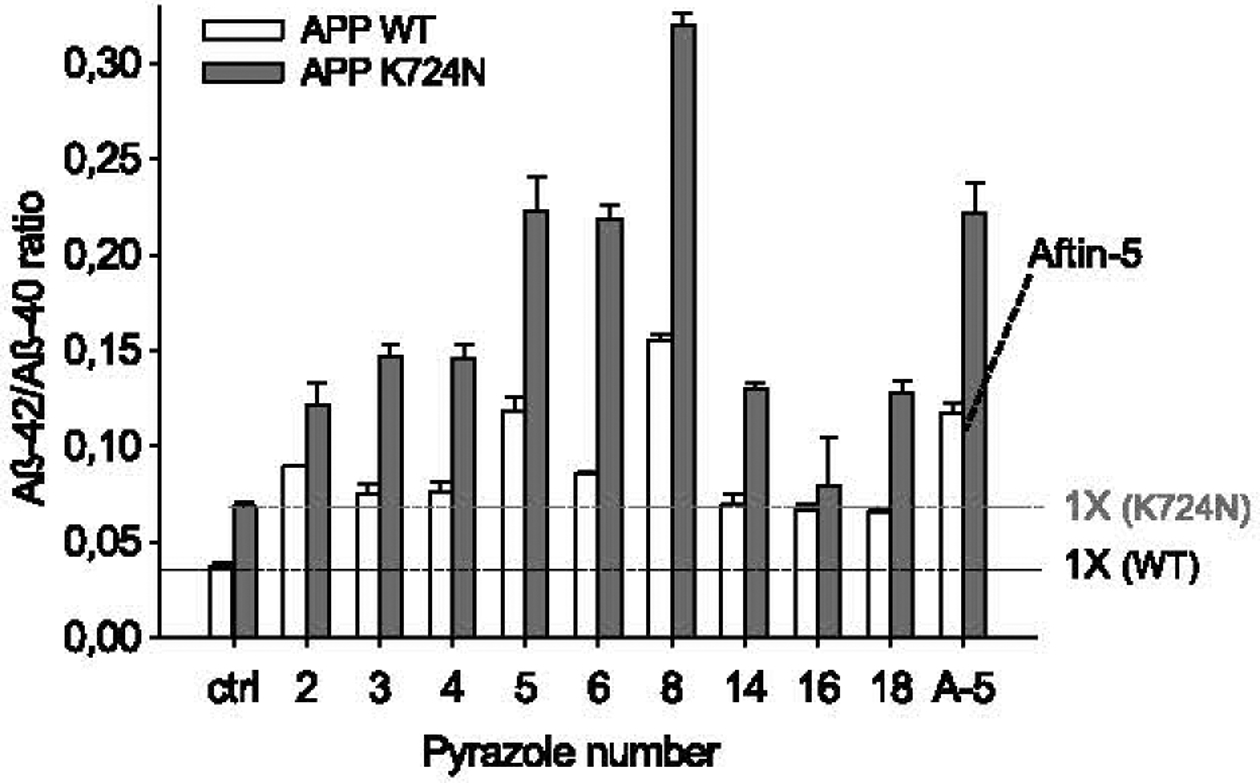
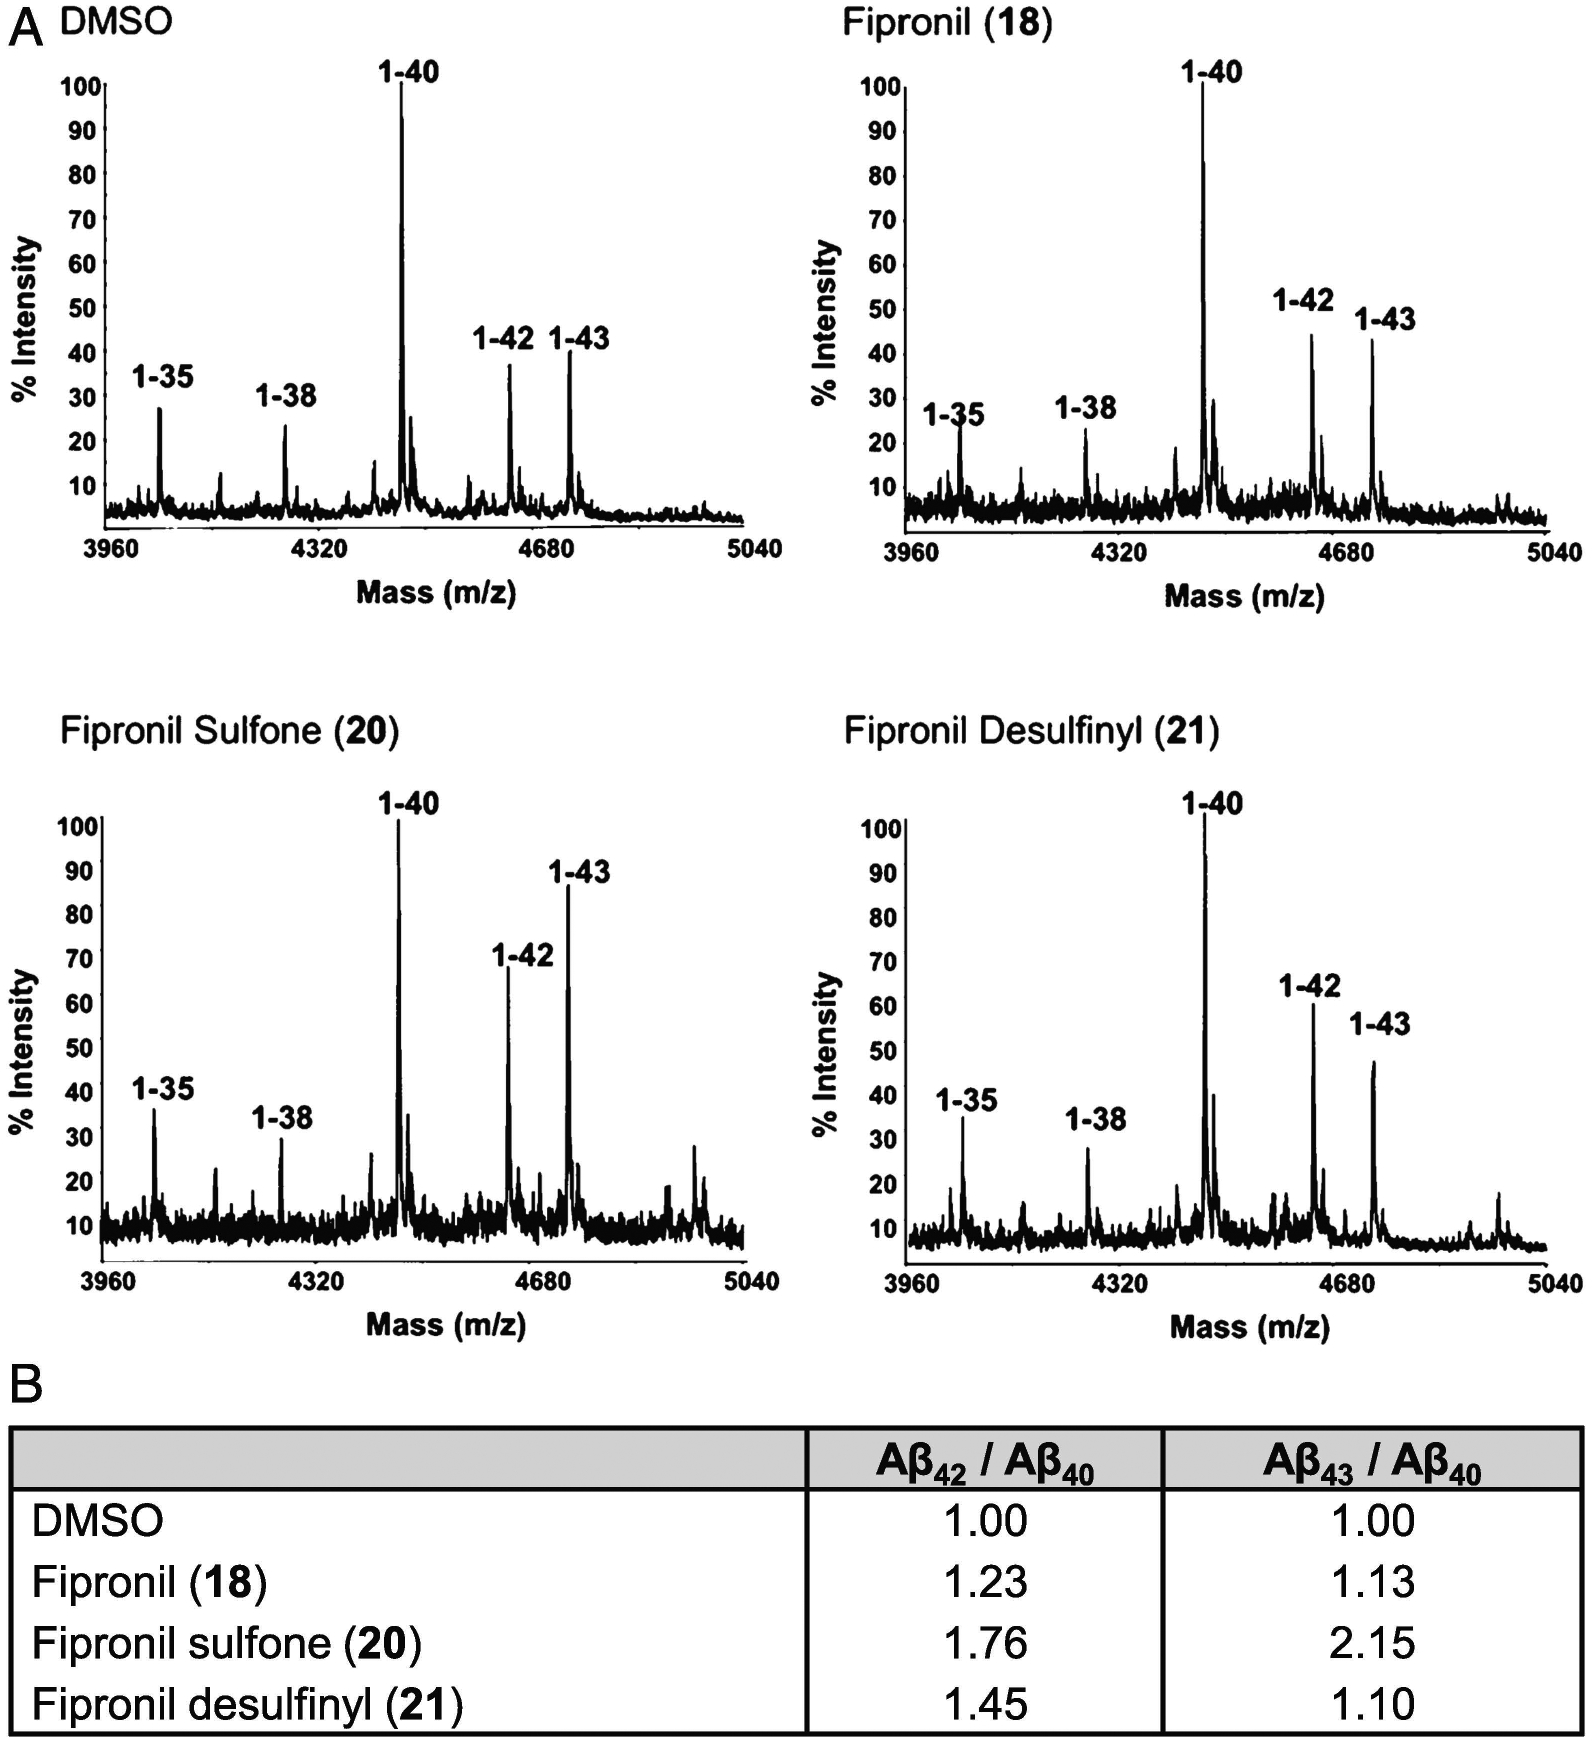
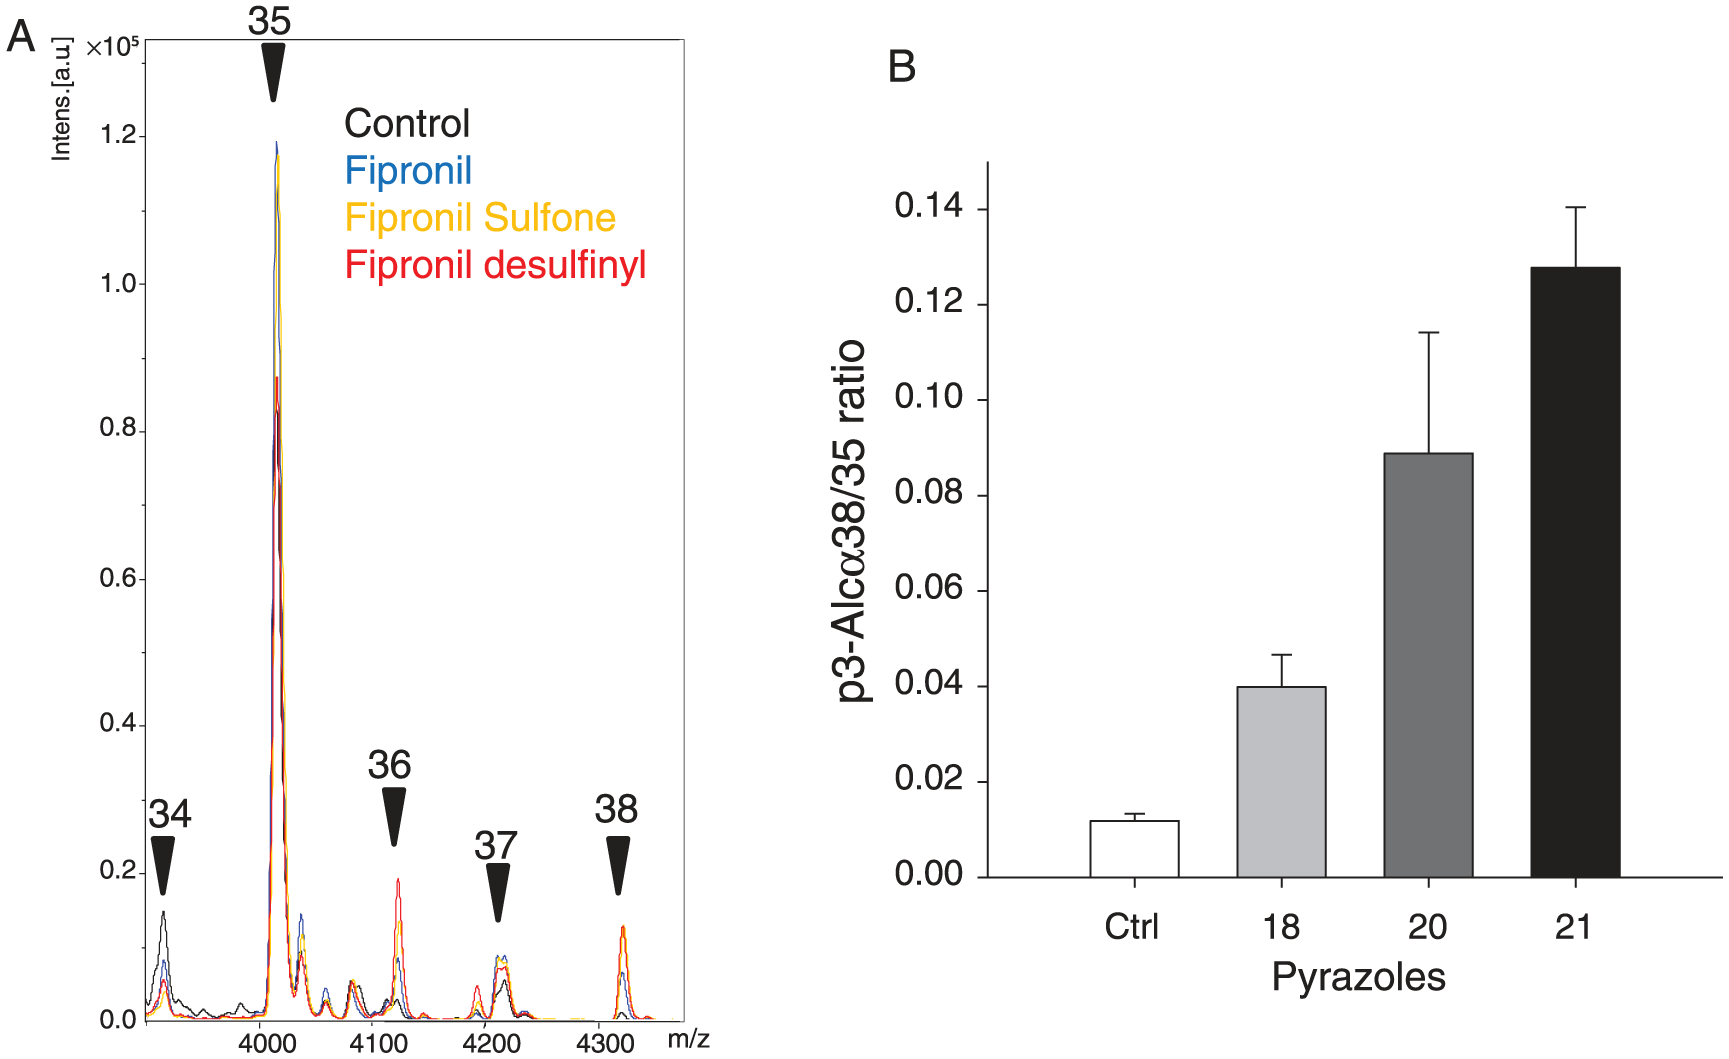
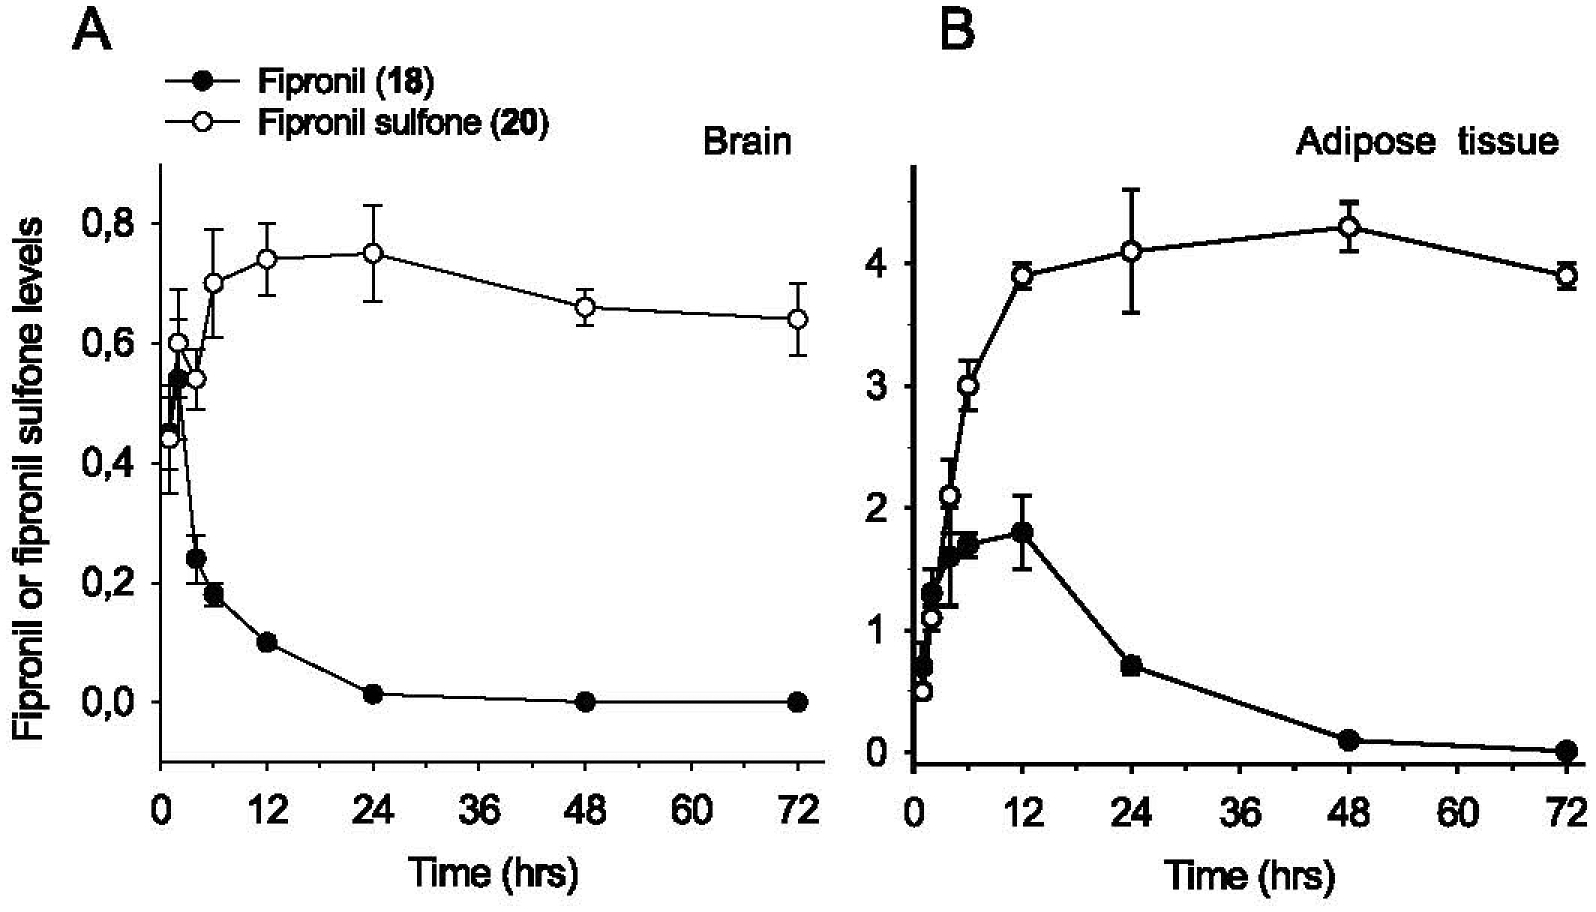
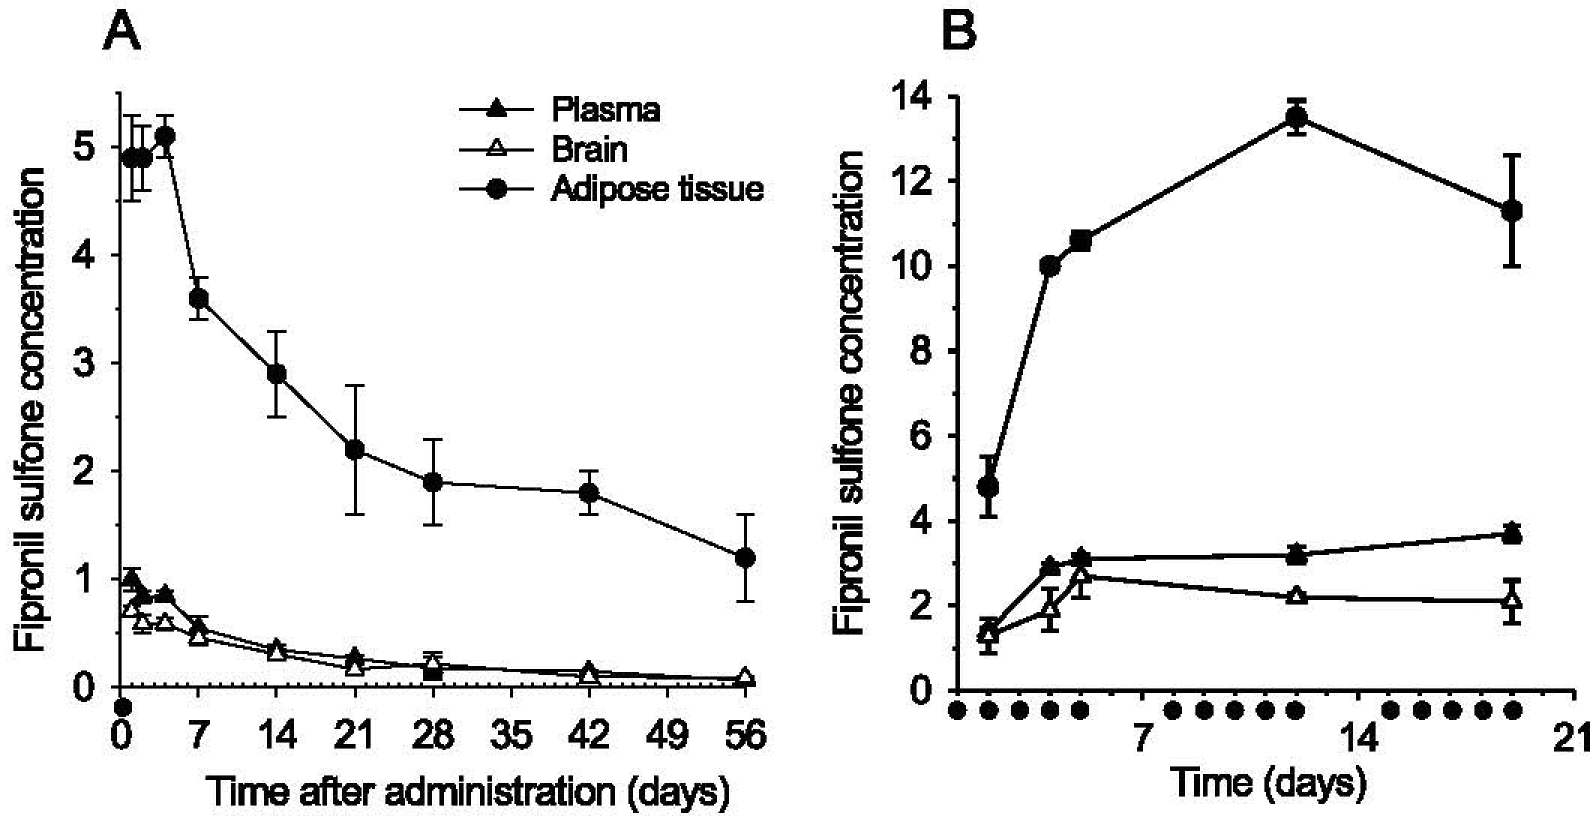
Generation of amyloid-β peptides (Aβs) by proteolytic cleavage of the amyloid-β protein precursor (AβPP), especially increased production of Aβ42/Aβ43 over Aβ40, and their aggregation as oligomers and plaques, represent a characteristic feature of Alzheimer's disease (AD). In familial AD (FAD), altered Aβ production originates from specific mutations of AβPP or presenilins 1/2 (PS1/PS2), the catalytic subunits of γ-secretase. In sporadic AD, the origin of altered production of Aβs remains unknown. We hypothesize that the 'human chemical exposome' contains products able to favor the production of Aβ42/Aβ43 over Aβ40 and shorter Aβs. To detect such products, we screened a library of 3500 + compounds in a cell-based assay for enhanced Aβ42/Aβ43 production. Nine pyrazole insecticides were found to induce a β- and γ-secretase-dependent, 3-10-fold increase in the production of extracellular Aβ42 in various cell lines and neurons differentiated from induced pluripotent stem cells derived from healthy and FAD patients. Immunoprecipitation/mass spectrometry analyses showed increased production of Aβs cleaved at positions 42/43, and reduced production of peptides cleaved at positions 38 and shorter. Strongly supporting a direct effect on γ-secretase activity, pyrazoles shifted the cleavage pattern of another γ-secretase substrate, alcadeinα, and shifted the cleavage of AβPP by highly purified γ-secretase toward Aβ42/Aβ43. Focusing on fipronil, we showed that some of its metabolites, in particular the persistent fipronil sulfone, also favor the production of Aβ42/Aβ43 in both cell-based and cell-free systems. Fipronil administered orally to mice and rats is known to be metabolized rapidly, mostly to fipronil sulfone, which stably accumulates in adipose tissue and brain. In conclusion, several widely used pyrazole insecticides enhance the production of toxic, aggregation prone Aβ42/Aβ43 peptides, suggesting the possible existence of environmental "Alzheimerogens" which may contribute to the initiation and propagation of the amyloidogenic process in sporadic AD.
Keywords: Alzheimer’s disease; Aβ38; Aβ40; Aβ42; Aβ42/Aβ40 ratio; Aβ43; aftins; alzheimerogen; amyloid-β; amyloid-β protein precursor; fipronil; human chemical exposome; pesticides; phenylpyrazoles; prevention; pyrazoles; triazines; γ-secretase.
Figures
Similar articles
-
Specific Triazine Herbicides Induce Amyloid-β42 Production.J Alzheimers Dis. 2016 Oct 18;54(4):1593-1605. doi: 10.3233/JAD-160310. J Alzheimers Dis. 2016. PMID: 27589520
-
Analysis of Non-Amyloidogenic Mutations in APP Supports Loss of Function Hypothesis of Alzheimer's Disease.Int J Mol Sci. 2023 Jan 20;24(3):2092. doi: 10.3390/ijms24032092. Int J Mol Sci. 2023. PMID: 36768421 Free PMC article.
-
Auraptene increases the production of amyloid-β via c-Jun N-terminal kinase-dependent activation of γ-secretase.J Alzheimers Dis. 2015;43(4):1215-28. doi: 10.3233/JAD-141692. J Alzheimers Dis. 2015. PMID: 25147119
-
Genes and mechanisms involved in beta-amyloid generation and Alzheimer's disease.Eur Arch Psychiatry Clin Neurosci. 1999;249(6):266-70. doi: 10.1007/s004060050098. Eur Arch Psychiatry Clin Neurosci. 1999. PMID: 10653281 Review.
-
Presenilin, γ-Secretase, and the Search for Pathogenic Triggers of Alzheimer's Disease.Biochemistry. 2025 Apr 15;64(8):1662-1672. doi: 10.1021/acs.biochem.4c00830. Epub 2025 Feb 25. Biochemistry. 2025. PMID: 39996369 Review.
Cited by
-
Fipronil disturbs the antigen-specific immune responses and GABAergic gene expression in the ovalbumin-immunized BALB/c mice.BMC Vet Res. 2024 Jan 22;20(1):30. doi: 10.1186/s12917-024-03878-3. BMC Vet Res. 2024. PMID: 38254069 Free PMC article.
-
Long-Term Fipronil Treatment Induces Hyperactivity in Female Mice.Int J Environ Res Public Health. 2020 Feb 29;17(5):1579. doi: 10.3390/ijerph17051579. Int J Environ Res Public Health. 2020. PMID: 32121376 Free PMC article.
-
Chronic Administration of Fipronil Heterogeneously Alters the Neurochemistry of Monoaminergic Systems in the Rat Brain.Int J Mol Sci. 2020 Aug 9;21(16):5711. doi: 10.3390/ijms21165711. Int J Mol Sci. 2020. PMID: 32784929 Free PMC article.
-
Amyloidogenic processing of amyloid β protein precursor (APP) is enhanced in the brains of alcadein α-deficient mice.J Biol Chem. 2020 Jul 10;295(28):9650-9662. doi: 10.1074/jbc.RA119.012386. Epub 2020 May 27. J Biol Chem. 2020. PMID: 32467230 Free PMC article.
-
Epigenetic and Neurological Impairments Associated with Early Life Exposure to Persistent Organic Pollutants.Int J Genomics. 2019 Jan 14;2019:2085496. doi: 10.1155/2019/2085496. eCollection 2019. Int J Genomics. 2019. PMID: 30733955 Free PMC article. Review.
References
-
- Alzheimer’s Association (2017) 2017 Alzheimer’s disease facts and figures. Alzheimers Dement 13, 325–373.
-
- Vinters HV (2015) Emerging concepts in Alzheimer’s disease. Annu Rev Pathol 10, 291–319. - PubMed
-
- Canter RG, Penney J, Tsai LH (2016) The road to restoring neural circuits for the treatment of Alzheimer’s disease. Nature 539,187–196. - PubMed
-
- Kuperstein I, Broersen K, Benilova I, Rozenski J, Jonckheere W, Debulpaep M, Vandersteen A, Segers-Nolten I, Van Der Werf K, Subramaniam V, Braeken D, Callewaert G, Bartic C, D’Hooge R, Martins IC, Rousseau F, Schymkowitz J, De Strooper B (2010) Neurotoxicity of Alzheimer’s disease Aβ peptides is induced by small changes in the Aβ42 to Aβ40 ratio. EMBO J 29, 3408–3420. - PMC - PubMed
Publication types
MeSH terms
Substances
Grants and funding
LinkOut - more resources
Full Text Sources
Other Literature Sources
