. 2018 Mar 29;122(12):3113-3123.
doi: 10.1021/acs.jpcb.8b00747. Epub 2018 Mar 20.

Composition Dependence of Water Permeation Across Multicomponent Gel-Phase Bilayers

Affiliations

Composition Dependence of Water Permeation Across Multicomponent Gel-Phase Bilayers

Remco Hartkamp et al. J Phys Chem B. .

Abstract

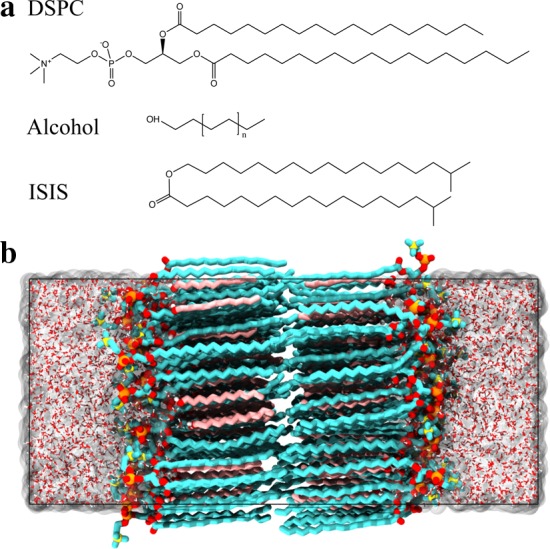
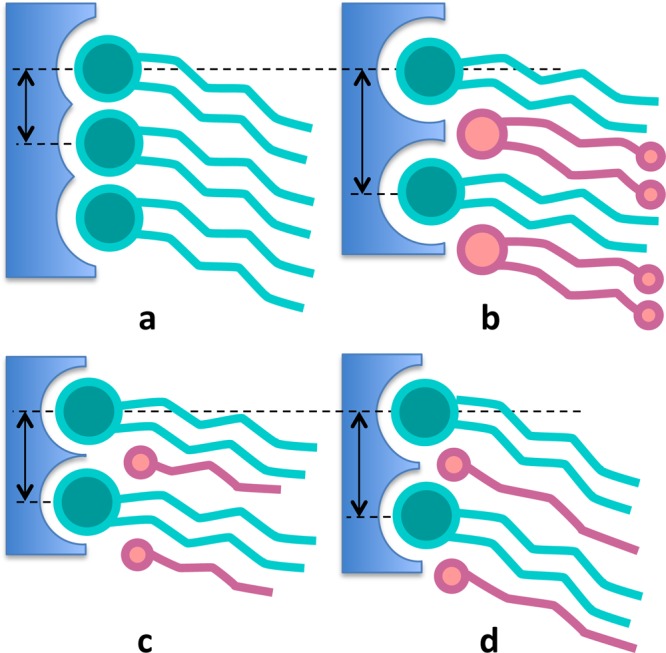
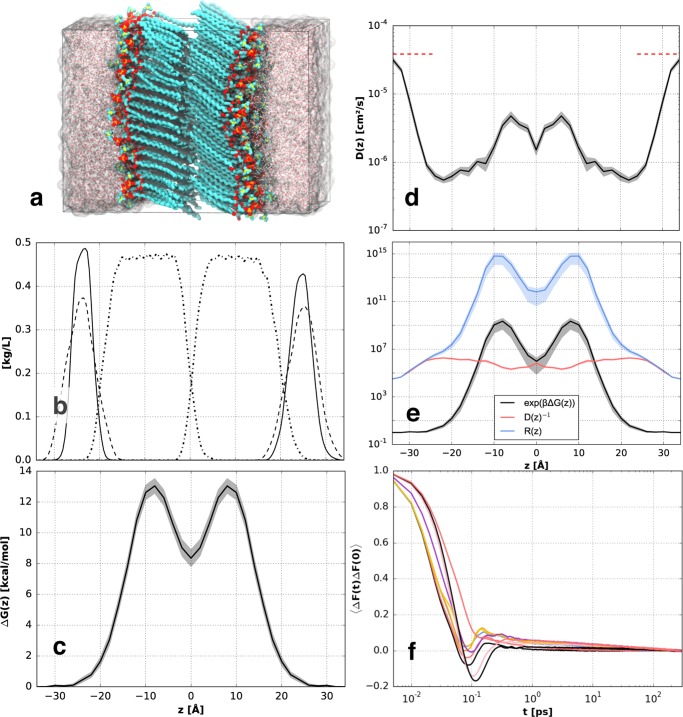
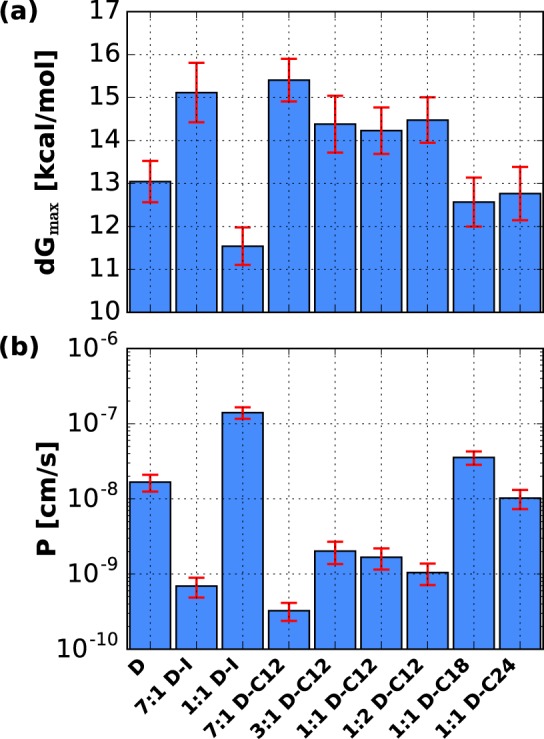
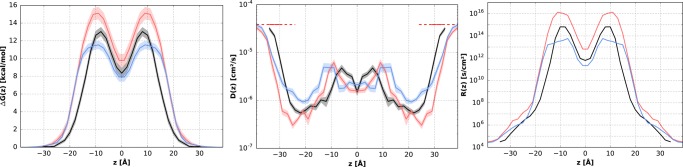
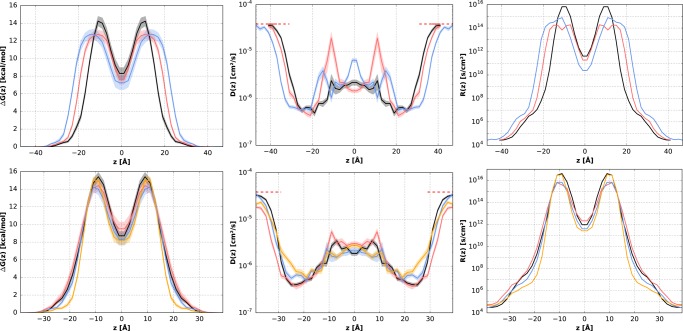
The permeability of multicomponent phospholipid bilayers in the gel phase is investigated via molecular dynamics simulation. The physical role of the different molecules is probed by comparing multiple mixed-component bilayers containing distearylphosphatidylcholine (DSPC) with varying amounts of either the emollient isostearyl isostearate or long-chain alcohol (dodecanol, octadecanol, or tetracosanol) molecules. Permeability is found to depend on both the tail packing density and hydrogen bonding between lipid headgroups and water. Whereas the addition of emollient or alcohol molecules to a gel-phase DSPC bilayer can increase the tail packing density, it also disturbed the hydrogen-bonding network, which in turn can increase interfacial water dynamics. These phenomena have opposing effects on bilayer permeability, which is found to depend on the balance between enhanced tail packing and decreased hydrogen bonding.


Conflict of interest statement

The authors declare no competing financial interest.

Figures

Figure 1
Figure 1
(a) Structure of the DSPC, alcohol, and ISIS molecules. (b) Snapshot of a typical bilayer configuration of an equimolar mixture of DSPC and C12 alcohol immersed in water. Hydrocarbons are shown in cyan (DSPC) and pink (alcohol), oxygen is shown in red, phosphorus is shown in orange, nitrogen is shown in yellow, and hydrogen is shown in white.
Figure 2
Figure 2
Schematic to illustrate how the amount of headgroup hydration (depicted in blue) and the space for water to move around the headgroups depends on the size and concentration of molecular species. Little space is available around headgroups in a pure DSPC bilayer (a), whereas space around the headgroups becomes accessible to water when ISIS molecules are present (b) or to a lesser extent when short (c) or long (d) alcohol molecules are added.
Figure 3
Figure 3
(a) Simulation snapshot of a DSPC bilayer, (b) mass density profile of choline (dashed lines), phosphate/glycerol (solid lines), and the lipid tails (dash-dotted lines), (c) the excess free energy profile, and (d) diffusion profile corresponding to water permeating a gel-phase DSPC bilayer, with the reference bulk SPC water diffusion at 298 K indicated by the red dashed lines, (e) resistance profile with the contributions due to free energy and diffusion, (f) z-force autocorrelation function for different windows ranging from the aqueous phase to the bilayer center. The shaded areas in (c)–(e) indicate the statistical uncertainty calculated from multiple sweeps.
Figure 4
Figure 4
(a) Maximum free energy barriers and (b) permeability coefficient of the bilayers considered here. The uncertainty estimates are shown in red, with the uncertainty of the energy barrier calculated from the standard error of the sweeps and the permeability coefficients showing a propagated uncertainty.
Figure 5
Figure 5
Nonmonotonic influence of the ISIS composition in a DSPC bilayer on the excess free energy profiles (left), diffusion profiles (center), and resistance profiles (right). The profiles correspond to DSPC (black), 7:1 DSPC–ISIS (red), and 1:1 DSPC–ISIS (blue). The shaded area indicates the statistical uncertainty, calculated from the multiple sweeps.
Figure 6
Figure 6
Excess free energy profiles (left), diffusion profile (center), and resistance profile (right) of various bilayers. Top: The influence of the alcohol tail length. The profiles correspond to 1:1 DSPC–C12 (black), 1:1 DSPC–C18 (red), and 1:1 DSPC–C24 (blue). Bottom: The influence of the C12 alcohol concentration, with profiles corresponding to 7:1 (black), 3:1 (red), 1:1 (blue), and 1:2 (yellow) DSPC–C12 bilayers. The shaded area denotes the statistical uncertainty as calculated from multiple sweeps.

References

    1. Bemporad D.; Luttmann C.; Essex J. W. Behaviour of Small Solutes and Large Drugs in a Lipid Bilayer from Computer Simulations. Biochim. Biophys. Acta, Biomembr. 2005, 1718, 1–21. 10.1016/j.bbamem.2005.07.009. - DOI - PubMed
    1. Carpenter T. S.; Kirshner D. A.; Lau E. Y.; Wong S. E.; Nilmeier J. P.; Lightstone F. C. A Method to Predict Blood-Brain Barrier Permeability of Drug-Like Compounds Using Molecular Dynamics Simulations. Biophys. J. 2014, 107, 630–641. 10.1016/j.bpj.2014.06.024. - DOI - PMC - PubMed
    1. Madison K. C. Barrier Function of the Skin: “‘La Raison d’Etre”’ of the Epidermis. J. Invest. Dermatol. 2003, 121, 231–241. 10.1046/j.1523-1747.2003.12359.x. - DOI - PubMed
    1. Hua S. Lipid-Based Nano-Delivery Systems for Skin Delivery of Drugs and Bioactives. Front. Pharmacol. 2015, 6, 219.10.3389/fphar.2015.00219. - DOI - PMC - PubMed
    1. Katz Y.; Diamond J. M. A Method for Measuring Nonelectrolyte Partition Coefficients between Liposomes and Water. J. Membr. Biol. 1974, 17, 69–86. 10.1007/BF01870173. - DOI - PubMed

Publication types