Comparative Study
. 2018 Feb 9;19(Suppl 3):114.
doi: 10.1186/s12864-018-4473-8.

Comparing miRNA structure of mirtrons and non-mirtrons

Affiliations
Comparative Study

Comparing miRNA structure of mirtrons and non-mirtrons

Igor I Titov et al. BMC Genomics. .

Abstract

Background: MicroRNAs proceeds through the different canonical and non-canonical pathways; the most frequent of the non-canonical ones is the splicing-dependent biogenesis of mirtrons. We compare the mirtrons and non-mirtrons of human and mouse to explore how their maturation appears in the precursor structure around the miRNA.

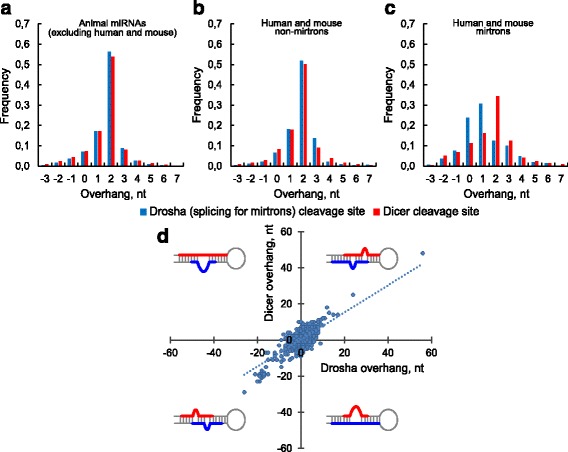
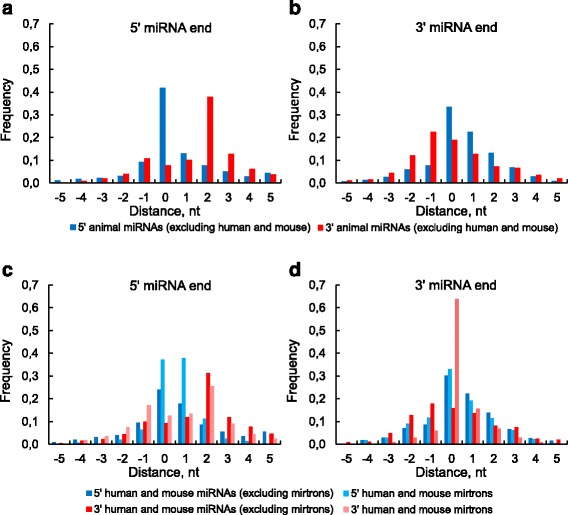
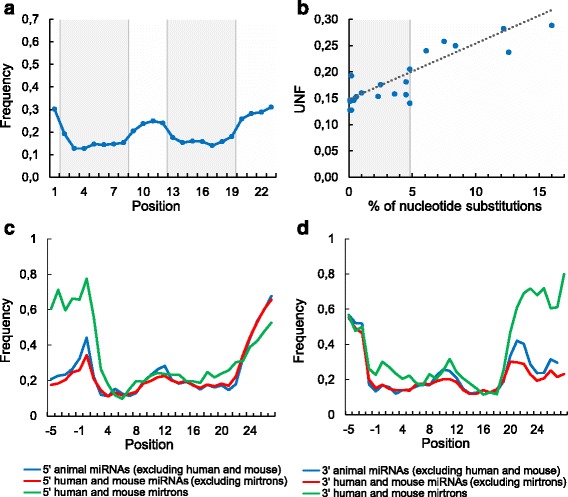
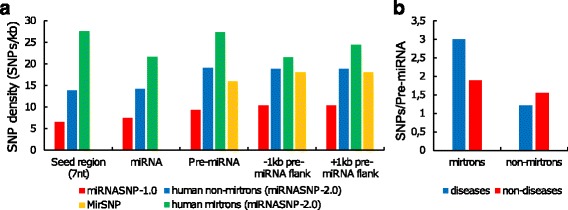
Results: We found the coherence of the overhang lengths what indicates the dependence between the cleavage sites. To explain this dependence we suggest the 2-lever model of the Dicer structure that couples the imprecisions in Drosha and Dicer. Considering the secondary structure of all animal pre-miRNAs we confirmed that single-stranded nucleotides tend to be located near the miRNA boundaries and in its center and are characterized by a higher mutation rate. The 5' end of the canonical 5' miRNA approaches the nearest single-stranded nucleotides what suggests the extension of the loop-counting rule from the Dicer to the Drosha cleavage site. A typical structure of the annotated mirtron pre-miRNAs differs from the canonical pre-miRNA structure and possesses the 1- and 2 nt hanging ends at the hairpin base. Together with the excessive variability of the mirtron Dicer cleavage site (that could be partially explained by guanine at its ends inherited from splicing) this is one more evidence for the 2-lever model. In contrast with the canonical miRNAs the mirtrons have higher snp densities and their pre-miRNAs are inversely associated with diseases. Therefore we supported the view that mirtrons are under positive selection while canonical miRNAs are under negative one and we suggested that mirtrons are an intrinsic source of silencing variability which produces the disease-promoting variants. Finally, we considered the interference of the pre-miRNA structure and the U2snRNA:pre-mRNA basepairing. We analyzed the location of the branchpoints and found that mirtron structure tends to expose the branchpoint site what suggests that the mirtrons can readily evolve from occasional hairpins in the immediate neighbourhood of the 3' splice site.

Conclusion: The miRNA biogenesis manifests itself in the footprints of the secondary structure. Close inspection of these structural properties can help to uncover new pathways of miRNA biogenesis and to refine the known miRNA data, in particular, new non-canonical miRNAs may be predicted or the known miRNAs can be re-classified.

Keywords: Biogenesis; Branchpoint; Dicer structure; Mirtron; Overhangs; Secondary structure; Splicing; miRNA; microRNA.


Conflict of interest statement

Ethics approval and consent to participate

Not applicable.

Consent for publication

Not applicable.

Competing interests

The authors declare that they have no competing interests.

Publisher’s Note

Springer Nature remains neutral with regard to jurisdictional claims in published maps and institutional affiliations.

Figures

Fig. 1
Fig. 1
The overhang lengths of miRNA duplexes. The frequency of the overhang lengths of miRNA duplexes: animal miRNAs without human/mouse ones (a), human and mouse non-mirtrons (b) and mirtrons(c). The overhang lengths occurrence of both cleavage sites for animal miRNA duplexes; in each quarter-square the miRBase pre-miRNA structure which leads to the corresponding overhang types is schematically shown (d). Negative values correspond to an atypical 5′ overhangs. The long overhangs on the panel D correspond to structure prediction errors and are described further in the text. These overhangs are not shown on the panels A and C. In mirtron case the splicing overhangs are considered instead of the Drosha ones
Fig. 2
Fig. 2
Distance between miRNA end and its nearest single-stranded nucleotide in the same miRNA strand. Considered are only those miRNA ends in which their terminal nucleotide is double-stranded. The frequencies of the 5′ miRNA ends are shown on panels (a) and (c). The frequencies of the 3′ miRNA ends are shown on panels (b) and (d). The data are presented for 5′ and 3′ miRNA sequences separately: for animal miRNAs excluding human and mouse ones (a and b) and for the human and mouse mirtrons and non-mirtrons (c and d). The positive values correspond to the distances to the nearest single-stranded nucleotide outside the miRNA. The negative values are the numbers of nucleotides that must be cut off from the miRNA to reach the nearest loop in the miRNA. The distance 0 is observed for those miRNA ends that are exactly at the boundary of the single-stranded region. The distance frequencies for all animal miRNAs (not shown) are the sum of results for all datasets and are only slightly different from the observations (a) and (b)
Fig. 3
Fig. 3
The unpaired nucleotide frequency (UNF) across the miRNA sequence. 5′ end of the miRNA starts from position one. Negative positions correspond to the miRNA flank. The UNF is not shown at the very ends of several long miRNAs. a Animal miRNAs. b The UNF dependence on the relative rate of nucleotide substitutions in animal miRNAs [62]. The seed points concentrate near the very UNF-axis. Spearman’s rank correlation test was used to estimate the significance of the correlation between the UNF and the rate of nucleotide substitutions (ρ = 0.81, P = 2.76 × 10− 6). c-d The UNF profile of 5′ miRNAs and of 3′ miRNAs of human and mouse (mirtrons and non-mirtrons) and of animal excluding human and mouse
Fig. 4
Fig. 4
SNP in pre-miRNA and its link with diseases. a SNP density in human pre-miRNAs and their flanking regions. Blue (green) bars correspond to human non-mirtrons (mirtrons). The results are based on miRNASNP-2.0 (miRBase 19.0 and dbSNP137) [58]. Red bars were calculated by [73] using miRBase-16.0 and dbSNP132 (miRNASNP-1.0 database). Yellow bars were calculated by [74] using miRBase 18.0 and dbSNP135 (MirSNP database). SNP density is shown separately for seed region, miRNA (without seed region), pre-miRNA (without miRNA) and upstream and downstream pre-miRNA flanks. Note, that the MirSNP data (yellow bars) provide the densities of slightly different regions, namely, the entire pre-miRNA sequence and both 200 bp pre-miRNA flanks. b SNP occurrence per pre-miRNA for disease or non-disease mirtrons and non-mirtrons. The disease pre-miRNAs are associated with at least one disease and were taken from [59, 60], SNPs were extracted from miRNASNP-2.0 [58]
Fig. 5
Fig. 5
Distance from terminal loop to branchpoint (a) and to 3′ pre-miRNA end (b). Distance between branchpoint and Dicer cleavage site of 3′ miRNA (c). Note that the 3′ miRNAs are mainly located near the 3′ splice site. The two separate points on the left figure show the branchpoint frequencies of the 5′ pre-miRNA strand (green) and of the terminal loop (red) as a whole. The blue curve displays the branchpoint distribution along the 3′ pre-miRNA strand. On the center figure shown are the distances of two mirtron groups: with branchpoint within the 3′ pre-miRNA strand (blue) and with branchpoint within the terminal loop (red). On the right figure considered are the distances between the 5′ end of the 3′ miRNA and the branchpoint within the 3′ pre-miRNA strand. Negative values correspond to the branchpoints into miRNA sequence

References

    1. Lee Y, Kim M, Han J, Yeom KH, Lee S, Baek SH, Kim VN. MicroRNA genes are transcribed by RNA polymerase II. EMBO J. 2004;23:4051–4060. doi: 10.1038/sj.emboj.7600385. - DOI - PMC - PubMed
    1. Borchert GM, Lanier W, Davidson BL. RNA polymerase III transcribes human microRNAs. Nat Struct Mol Biol. 2006;13:1097–1101. doi: 10.1038/nsmb1167. - DOI - PubMed
    1. Lee Y, Jeon K, Lee JT, Kim S, Kim VN. MicroRNA maturation: stepwise processing and subcellular localization. EMBO J. 2002;21:4663–4670. doi: 10.1093/emboj/cdf476. - DOI - PMC - PubMed
    1. Ozsolak F, Poling LL, Wang Z, Liu H, Liu XS, Roeder RG, Fisher DE. Chromatin structure analyses identify miRNA promoters. Genes Dev. 2008;22:3172–3183. doi: 10.1101/gad.1706508. - DOI - PMC - PubMed
    1. Monteys AM, Spengler RM, Wan J, Tecedor L, Lennox KA, Xing Y, Davidson BL. Structure and activity of putative intronic miRNA promoters. RNA. 2010;16:495–505. doi: 10.1261/rna.1731910. - DOI - PMC - PubMed

Publication types

LinkOut - more resources