

Novel read density distribution score shows possible aligner artefacts, when mapping a single chromosome
- PMID: 29504893
- PMCID: PMC5836841
- DOI: 10.1186/s12864-018-4475-6
Novel read density distribution score shows possible aligner artefacts, when mapping a single chromosome
Abstract
Background: The use of artificial data to evaluate the performance of aligners and peak callers not only improves its accuracy and reliability, but also makes it possible to reduce the computational time. One of the natural ways to achieve such time reduction is by mapping a single chromosome.
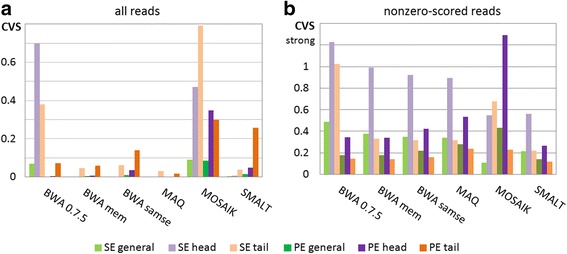
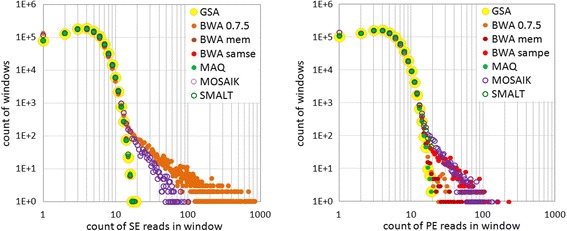
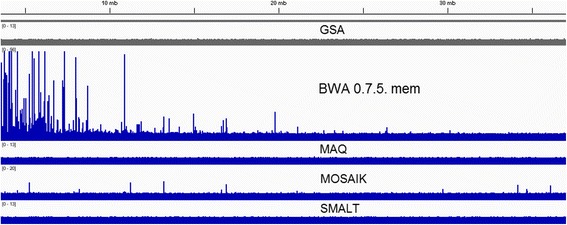
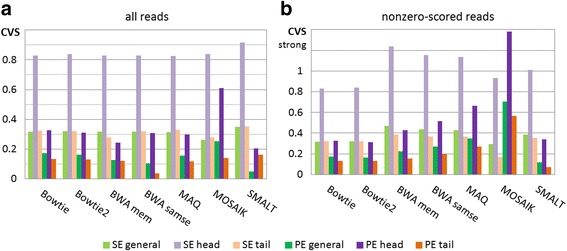
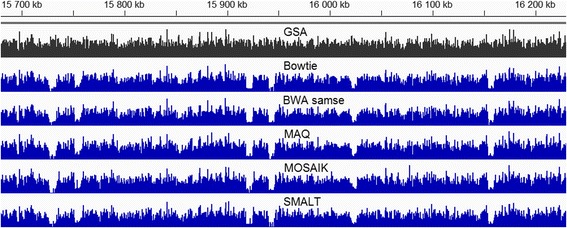
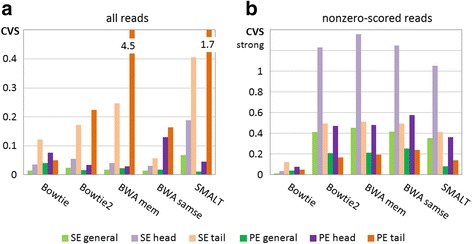
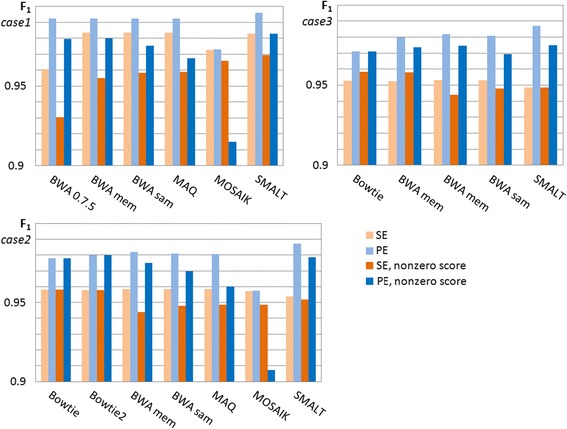
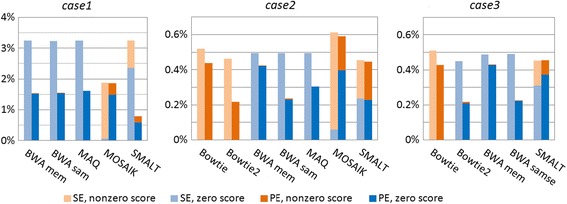
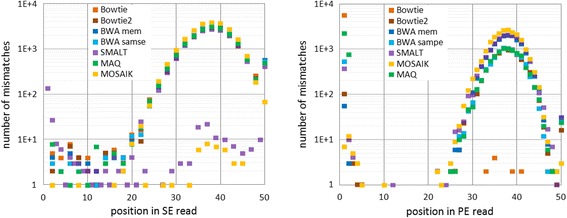
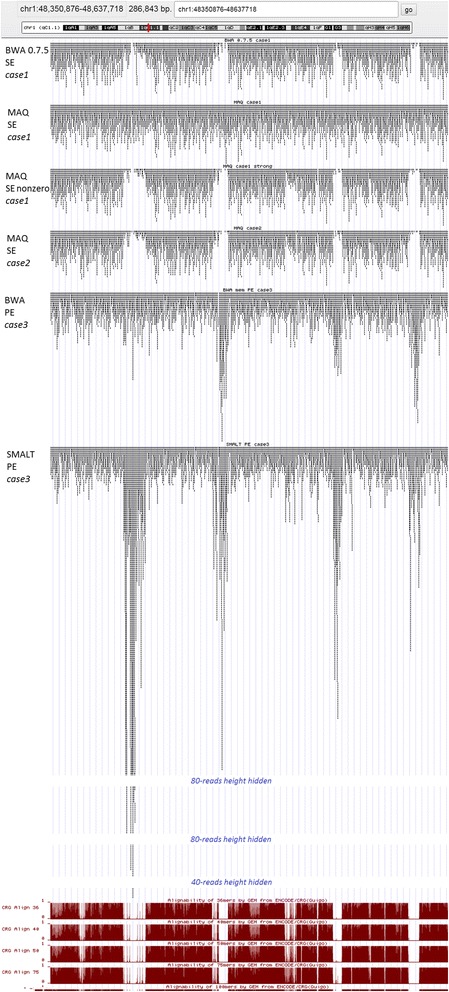
Results: We investigated whether a single chromosome mapping causes any artefacts in the alignments' performances. In this paper, we compared the accuracy of the performance of seven aligners on well-controlled simulated benchmark data which was sampled from a single chromosome and also from a whole genome. We found that commonly used statistical methods are insufficient to evaluate an aligner performance, and applied a novel measure of a read density distribution similarity, which allowed to reveal artefacts in aligners' performances. We also calculated some interesting mismatch statistics, and constructed mismatch frequency distributions along the read.
Conclusions: The generation of artificial data by mapping of reads generated from a single chromosome to a reference chromosome is justified from the point of view of reducing the benchmarking time. The proposed quality assessment method allows to identify the inherent shortcoming of aligners that are not detected by conventional statistical methods, and can affect the quality of alignment of real data.
Keywords: DNA alignment; Next-generation sequencing; Read density distribution.
Conflict of interest statement
Authors’ information
FN is an independent software developer, employed by Novosibirsk State University. IA is a Daphne Jackson Fellow sponsored by the Babraham Institute and BBSRC. NB is researcher at University of Hertfordshire. MG is a Postdoc at ICG SB RAS. YO is a senior scientist at ICG SB RAS, IMBR RAS, and professor at Novosibirsk State University.
Ethics approval and consent to participate
Not applicable.
Consent for publication
Not applicable.
Competing interests
The authors declare that they have no competing interests.
Publisher’s Note
Springer Nature remains neutral with regard to jurisdictional claims in published maps and institutional affiliations.
Figures
References
Publication types
MeSH terms
LinkOut - more resources
Full Text Sources
Other Literature Sources
