. 2018 Apr 2;128(4):1413-1428.
doi: 10.1172/JCI98047. Epub 2018 Mar 5.

PD-L1 in tumor microenvironment mediates resistance to oncolytic immunotherapy

Affiliations

PD-L1 in tumor microenvironment mediates resistance to oncolytic immunotherapy

Dmitriy Zamarin et al. J Clin Invest. .

Erratum in

Abstract

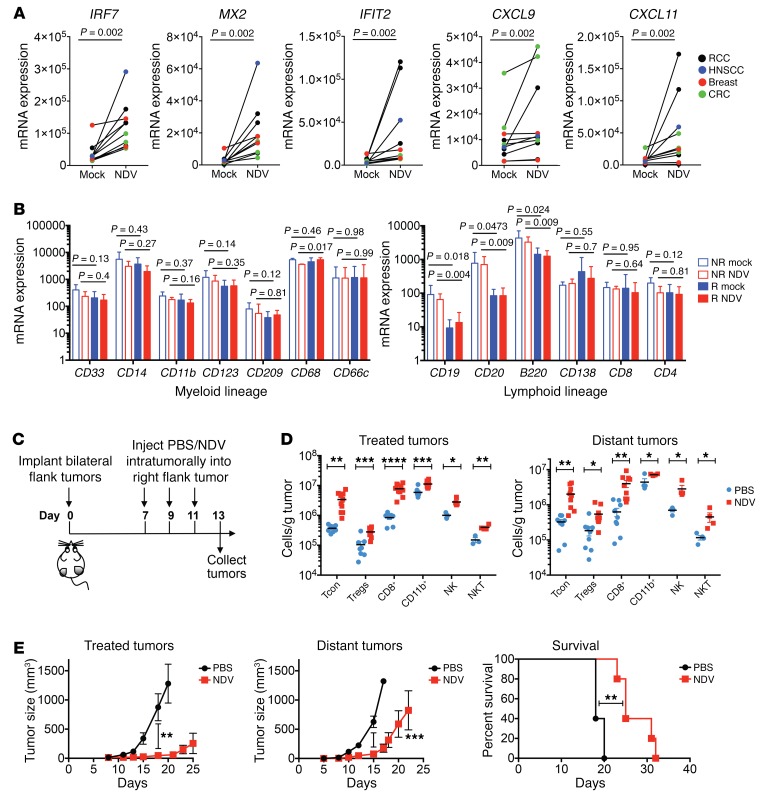
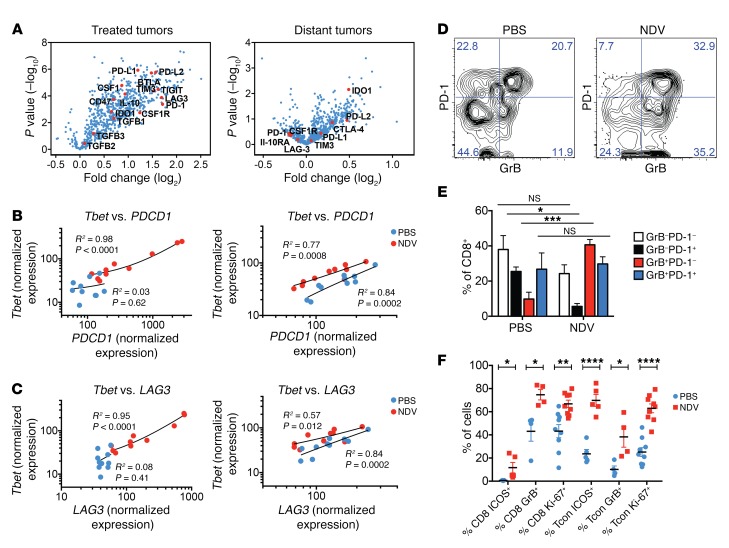
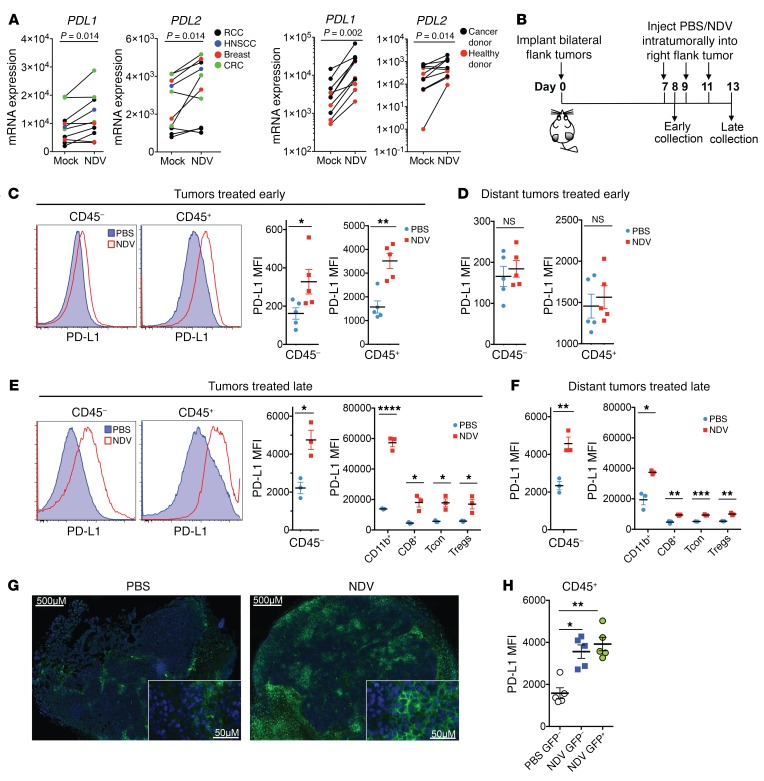
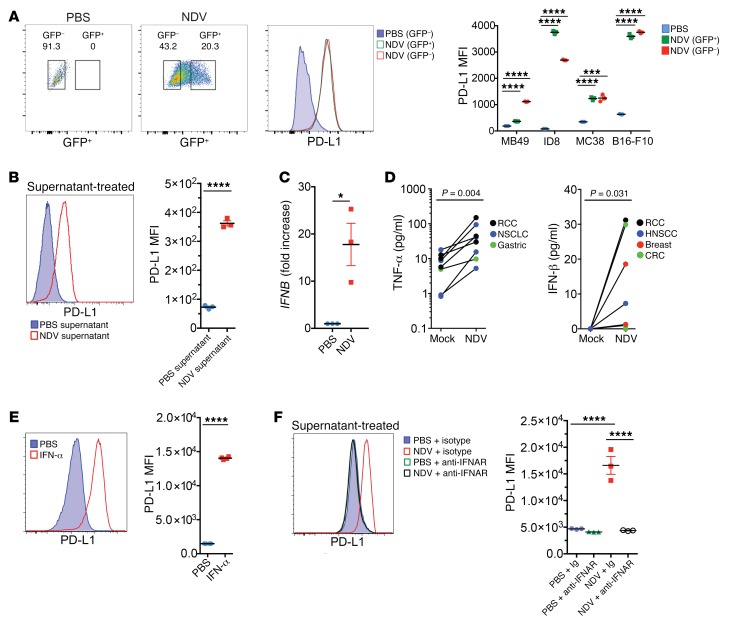
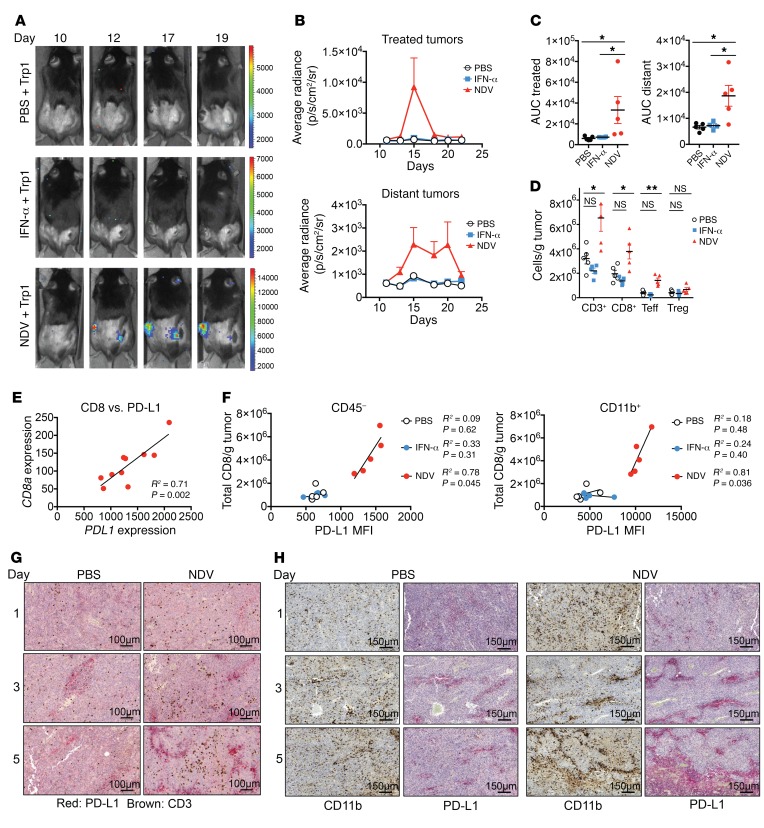
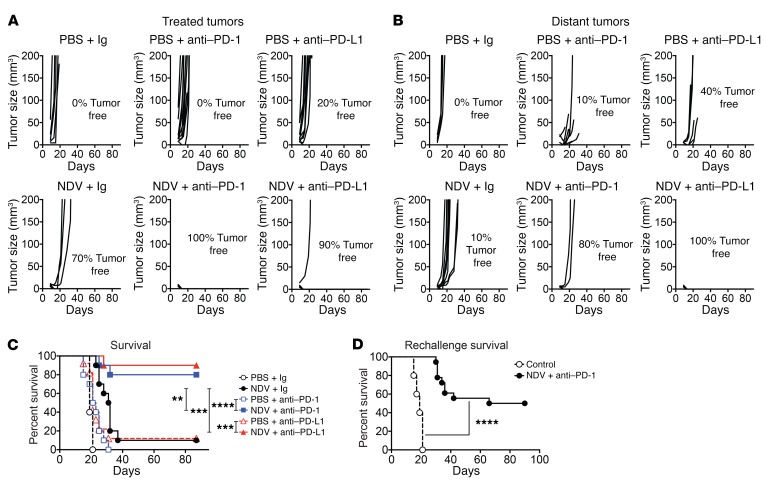
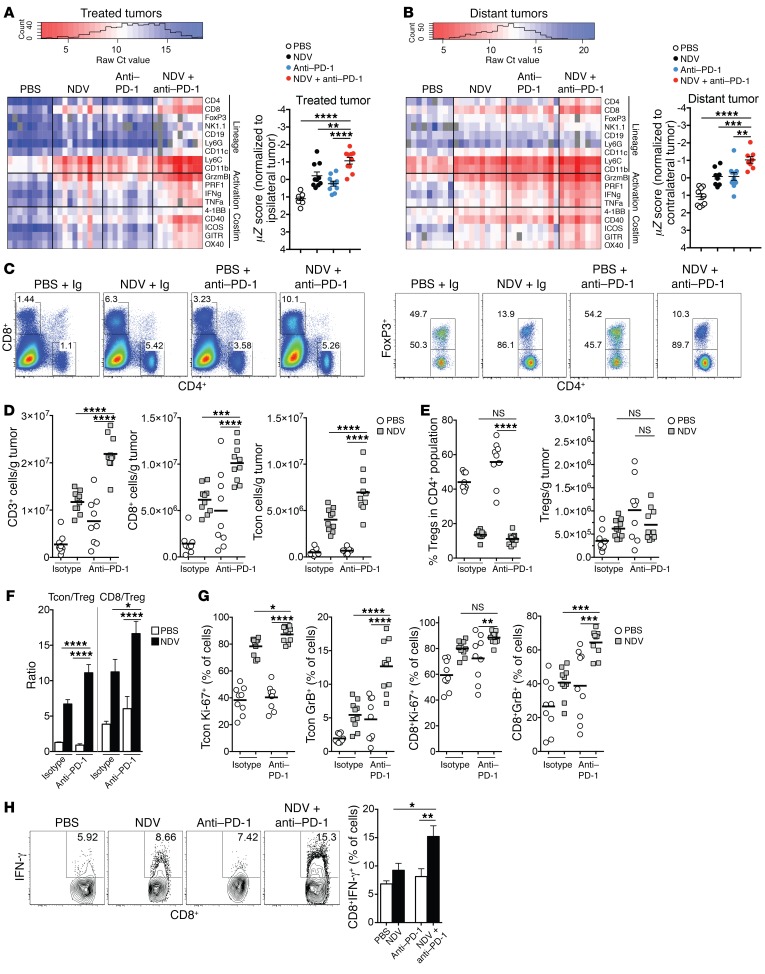
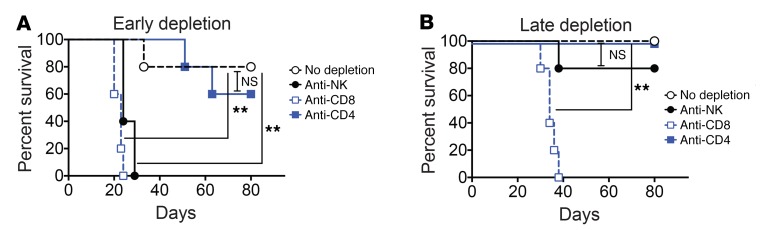
Intralesional therapy with oncolytic viruses (OVs) leads to the activation of local and systemic immune pathways, which may present targets for further combinatorial therapies. Here, we used human tumor histocultures as well as syngeneic tumor models treated with Newcastle disease virus (NDV) to identify a range of immune targets upregulated with OV treatment. Despite tumor infiltration of effector T lymphocytes in response to NDV, there was ongoing inhibition through programmed death ligand 1 (PD-L1), acting as a mechanism of early and late adaptive immune resistance to the type I IFN response and T cell infiltration, respectively. Systemic therapeutic targeting of programmed cell death receptor 1 (PD-1) or PD-L1 in combination with intratumoral NDV resulted in the rejection of both treated and distant tumors. These findings have implications for the timing of PD-1/PD-L1 blockade in conjunction with OV therapy and highlight the importance of understanding the adaptive mechanisms of immune resistance to specific OVs for the rational design of combinatorial approaches using these agents.

Keywords: Gene therapy; Immunology; Immunotherapy; Oncology; T cells.


Conflict of interest statement

Conflict of interest: DZ and JDW are inventors on a patent concerning the uses of recombinant Newcastle disease virus for cancer therapy (US 20160015760). SS, YY, JW, and WMB are employees of Merck & Co. Inc.

Figures

Figure 1
Figure 1. Local and abscopal effects of intratumoral NDV therapy.
(A) RCC, CRC, breast cancer, and HNSCC tumor specimens were treated with NDV for 24 hours. Expression of representative type I IFN–related genes and chemokine genes in tumors was determined by real-time quantitative PCR. (B) Expression of myeloid and lymphoid lineage markers by real-time quantitative PCR in the NDV-responding (R) and nonresponding (NR) samples. Data represent 7 responding and 3 nonresponding tumors (see Figure 1A and Supplemental Figure 1). (C) Animals bearing bilateral flank B16-F10 tumors were treated with 3 injections of NDV administered into the right-flank tumor. IT, intratumorally. (D) Immune infiltration into the treated and distant tumors was determined by flow cytometry. (E) Growth of the treated and distant tumors and overall survival. (A and B) Each tumor specimen represents an individual experiment. (CE) Results are representative of 2 independent experiments with 5 to 10 animals per group, and data represent the mean ± SEM. Data were analyzed using the Wilcoxon matched-pairs, signed-rank test (A), Student’s t test for individual comparisons (B and D, and E, 2 left panels), and log-rank test (E, right panel). *P < 0.05, **P < 0.01, ***P < 0.001, and ****P < 0.0001. Tcon, CD4+FoxP3; Treg, CD4+FoxP3+.
Figure 2
Figure 2. NDV upregulates immune-inhibitory pathways in tumors.
(A) Gene expression profiling of the treated and distant tumors analyzed on the NanoString platform. (B and C) Correlation of expression of Tbet versus PDCD1 (B) and Tbet versus LAG3 (C) in the treated (left) and distant (right) tumors, as determined by NanoString. (D and E) Expansion of GrB+PD-1 lymphocytes in response to NDV therapy in distant tumors. (D) Representative flow cytometric plots. (E) Grouped plot of all samples. (F) Expression of activation (ICOS), lytic (GrB+), and proliferation (Ki-67) markers by the CD8+ and Tcon lymphocytes from distant tumors as determined by flow cytometry. Results are representative of 2 independent experiments, with 5 to 10 animals per group, and data represent the mean ± SEM. Data were analyzed using the NanoString Advanced Analysis module for differential expression with the Benjamini-Yekutieli P value adjustment method (A), Pearson’s correlation (B and C), 1-way ANOVA with multiple comparisons (E), and Student’s t test for individual comparisons (F). *P < 0.05, **P < 0.01, ***P < 0.001, and ****P < 0.0001.
Figure 3
Figure 3. Induction of PD-L1 in NDV-treated and distant tumors.
(A) mRNA expression of PDL1 and PDL2 in the cultured NDV-infected tumor specimens (48 h) and NDV-infected whole blood (24 h) obtained from healthy donors and from patients with cancer. (B) Mouse treatment schema. Tumors were collected at 24 hours (early) or 6 days (late) after the first treatment. (C and D) Upregulation of PD-L1 on CD45+ and CD45 cells in treated tumors (C) and distant tumors (D) at 24 hours (early). Left: representative flow cytometry histograms; right: quantified PD-L1 MFI. (E and F) Upregulation of PD-L1 on CD45+ and CD45 cells in treated tumors (E) and distant tumors (F) on day 6 (late). Shown are representative flow cytometric histograms and quantification of PD-L1 MFI on CD45 cells and on the indicated leukocyte subsets. (G) Expression of PD-L1 in distant tumors on day 6. (H) MFI of PD-L1 expression in GFP and GFP+ CD45+ cells isolated from the tumors treated with NDV expressing GFP 24 hours after infection. Scale bars: 500 μm and 50 μm (enlarged insets). (A) Each specimen represents an individual experiment. (BH) Results are representative of 3 independent experiments with 3 to 5 animals per group, and data represent the mean ± SEM. Data were analyzed by a Wilcoxon matched-pairs, signed-rank test (A) and a Student’s t test for individual comparisons (CF and H). *P < 0.05, **P < 0.01, ***P < 0.001, and ****P < 0.0001. MFI, median fluorescence intensity.
Figure 4
Figure 4. Upregulation of PD-L1 in tumor cells by NDV-induced type I IFN.
(A) PD-L1 expression in the infected (GFP+) and noninfected (GFP) B16-F10 cells treated with NDV-GFP in vitro. Shown are representative flow cytometric plots from B16-F10 cells and quantification of PD-L1 MFI from different infected cell lines. (B) PD-L1 upregulation in B16-F10 cells treated with UV-inactivated supernatant from NDV-infected cells. (C) Expression of IFNB in NDV-infected B16-F10 cells determined at 24 hours by RT-PCR. (D) Production of innate cytokines in human tumor histoculture in response to NDV determined by ELISA at 24 hours. NSCLC, non–small-cell lung cancer. (E) Upregulation of PD-L1 in B16-F10 cells in response to treatment with recombinant IFN-α2. (F) Inhibition of PD-L1 upregulation by anti-IFNAR antibody in B16-F10 cells treated with UV-inactivated supernatant from NDV-infected cells. (AC and F) Results are representative of 3 independent experiments with 3 replicates per group. Data indicate the mean ± SEM. (D) Each tumor specimen represents an individual experiment. Data were analyzed by Student’s t test for individual comparisons (AC) and Wilcoxon matched-pairs, signed-rank test (D). *P < 0.05, ***P < 0.01, and ****P < 0.0001.
Figure 5
Figure 5. Role of innate and adaptive immune responses in NDV-induced PD-L1 upregulation.
Animals were treated as shown in the schema in Supplemental Figure 5. (A) Infiltration of tumors with adoptively transferred Trp1-luc lymphocytes with intratumoral NDV or IFN-α therapy. (B) Quantification of the average radiance from A in treated and distant tumors. (C) Quantification of the AUC of luminescence in treated and distant tumors. (D) Immune infiltration in distant tumors with NDV versus IFN-α treatment calculated using flow cytometry. Teff, effector T cell. (E) Association of PDL1 gene expression with CD8a gene expression in distant tumors from NDV-treated animals. (F) Association of PD-L1 expression on CD45 cells and CD11b+ cells with total CD8+ infiltration in distant tumors calculated using flow cytometry. (G) Time course of T cell infiltration and PD-L1 upregulation in distant tumors in response to single NDV injection. Scale bar: 100 μm. (H) Association of PD-L1 upregulation with myeloid cell infiltration into distant tumors over time. Scale bar: 150 μm. Results are representative of 2 to 3 independent experiments with 5 to 10 mice per group, and data represent the mean ± SEM. Data were analyzed by Student’s t test for individual comparisons (C and D) and Pearson’s correlation (E and F). *P < 0.05, **P < 0.01.
Figure 6
Figure 6. Local and abscopal effects of intratumoral NDV in combination with systemic PD-1 or PD-L1 blockade.
B16-F10 tumors were implanted by i.d. injection of 4 × 10⁵ B16-F10 cells into the right flank and 5 × 10⁴ cells into the left flank on day 0. On days 3, 5, 7, and 9, mice were treated with intratumoral injections of NDV or PBS and concomitant i.p. injections of anti–PD-1, anti–PD-L1, or isotype control antibody. (A) Growth of NDV-treated tumors. (B) Growth of distant tumors. (C) Overall survival. (D) Rechallenge of surviving animals at 90 days. (A and B) Data represent 1 of 2 experiments with 10 mice per group. (C and D) Data represent 2 pooled experiments with 10 mice per group. **P < 0.01, ***P < 0.001, and ****P < 0.0001, by log-rank test (C and D).
Figure 7
Figure 7. Potentiation of immune effects of NDV by PD-1 blockade.
Animals bearing bilateral flank B16-F10 melanoma tumors were treated according to the schedule in Figure 6. (A and B) Gene expression analyses from treated (A) and distant (B) tumors, focusing on selected lineage-defining and T cell activation and costimulation markers. Costimulation (Costim) and activation markers were used to calculate an activation signature Z score. (C) Representative plots of percentages of CD4+ and CD8+ lymphocytes from distant tumors (gated on total live cells). (D) Absolute numbers of CD3+, CD8+, and CD4+FoxP3 (Tcon) lymphocytes in distant tumors. (E) Relative percentages and absolute numbers of Tregs in distant tumors. (F) Tcon/Treg and CD8+/Treg ratios in distant tumors. (G) Expression of proliferation and lytic markers by tumor-infiltrating CD8 and Tcon cells in distant tumors. (H) IFN-γ release by distant tumor–infiltrating CD8+ lymphocytes in response to stimulation with tumor antigen-loaded DCs. Data represent 1 of 2 experiments with 10 mice per group and indicate the mean ± SEM. Data were analyzed by 1-way ANOVA with multiple comparisons. *P < 0.05, **P < 0.01, ***P < 0.001, and ****P < 0.0001.
Figure 8
Figure 8. Dependence of NDV and PD-1 blockade on NK cells and CD8+ lymphocytes.
Bilateral B16-F10 tumors were established, and animals were treated with NDV and anti–PD-1 antibody as described in Figure 6 in the presence of the indicated depleting antibodies. (A) Survival of animals that received the indicated depleting antibodies before tumor implantation. (B) Survival of animals that received the indicated depleting antibodies on day 0 of therapy. Data are representative of 2 experiments with 5 mice per group. **P < 0.01, by log-rank test.

Comment in

References

    1. Hotte SJ, et al. An optimized clinical regimen for the oncolytic virus PV701. Clin Cancer Res. 2007;13(3):977–985. doi: 10.1158/1078-0432.CCR-06-1817. - DOI - PubMed
    1. Kaufman HL, Kim DW, DeRaffele G, Mitcham J, Coffin RS, Kim-Schulze S. Local and distant immunity induced by intralesional vaccination with an oncolytic herpes virus encoding GM-CSF in patients with stage IIIc and IV melanoma. Ann Surg Oncol. 2010;17(3):718–730. doi: 10.1245/s10434-009-0809-6. - DOI - PubMed
    1. Andtbacka RH, et al. Talimogene laherparepvec improves durable response rate in patients with advanced melanoma. J Clin Oncol. 2015;33(25):2780–2788. doi: 10.1200/JCO.2014.58.3377. - DOI - PubMed
    1. Zamarin D, Palese P. Oncolytic Newcastle disease virus for cancer therapy: old challenges and new directions. Future Microbiol. 2012;7(3):347–367. doi: 10.2217/fmb.12.4. - DOI - PMC - PubMed
    1. Zamarin D, et al. Localized oncolytic virotherapy overcomes systemic tumor resistance to immune checkpoint blockade immunotherapy. Sci Transl Med. 2014;6(226):226ra32. doi: 10.1126/scitranslmed.3008095. - DOI - PMC - PubMed

Publication types