. 2018 May;24(4):417-426.
doi: 10.1038/nm.4501. Epub 2018 Mar 5.

Nociceptor sensory neurons suppress neutrophil and γδ T cell responses in bacterial lung infections and lethal pneumonia

Affiliations

Nociceptor sensory neurons suppress neutrophil and γδ T cell responses in bacterial lung infections and lethal pneumonia

Pankaj Baral et al. Nat Med. 2018 May.

Erratum in

Abstract

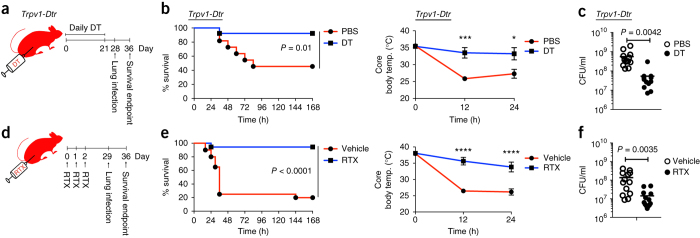
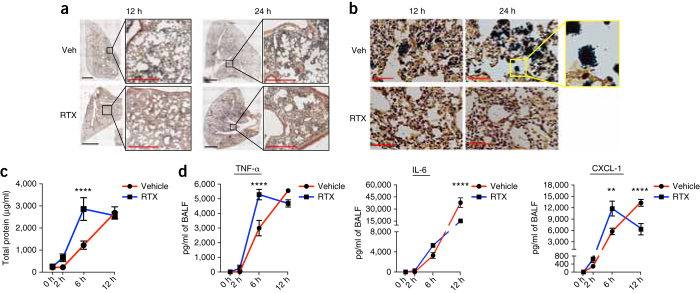
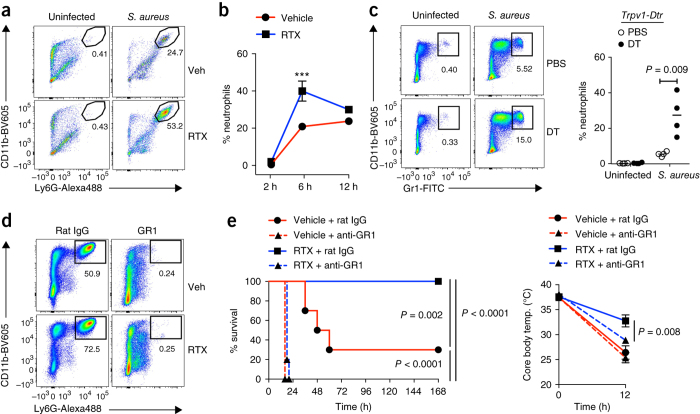
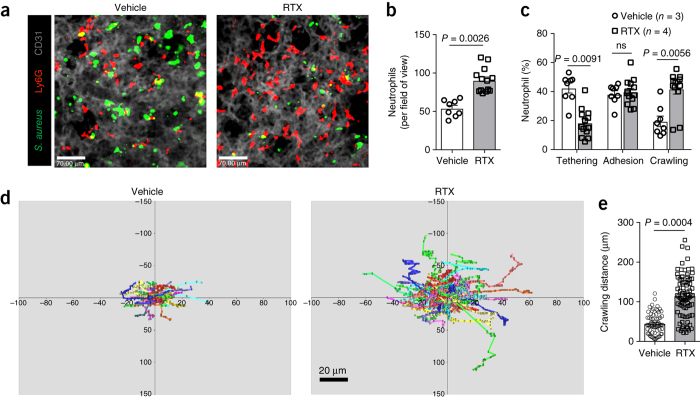
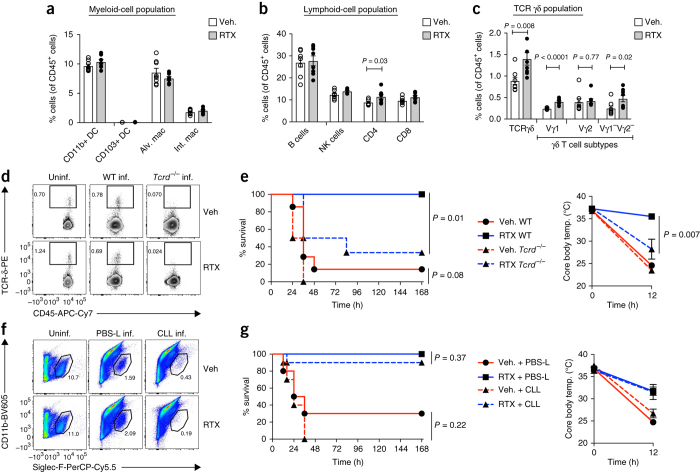
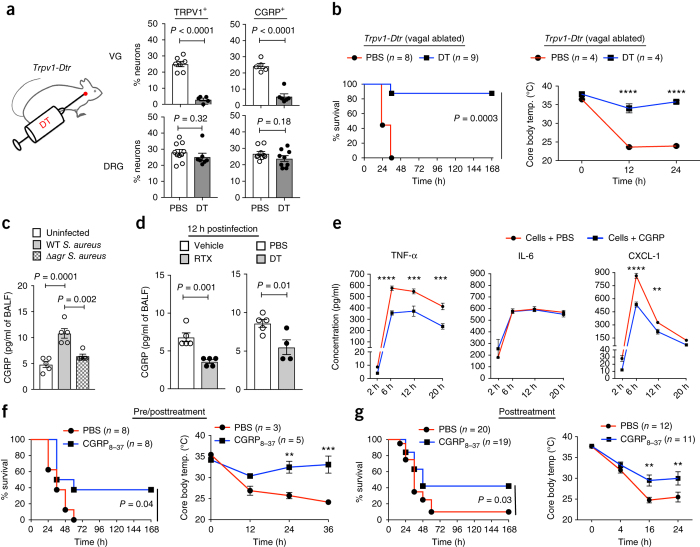
Lung-innervating nociceptor sensory neurons detect noxious or harmful stimuli and consequently protect organisms by mediating coughing, pain, and bronchoconstriction. However, the role of sensory neurons in pulmonary host defense is unclear. Here, we found that TRPV1+ nociceptors suppressed protective immunity against lethal Staphylococcus aureus pneumonia. Targeted TRPV1+-neuron ablation increased survival, cytokine induction, and lung bacterial clearance. Nociceptors suppressed the recruitment and surveillance of neutrophils, and altered lung γδ T cell numbers, which are necessary for immunity. Vagal ganglia TRPV1+ afferents mediated immunosuppression through release of the neuropeptide calcitonin gene-related peptide (CGRP). Targeting neuroimmunological signaling may be an effective approach to treat lung infections and bacterial pneumonia.


Conflict of interest statement

P.B. and I.M.C. are co-inventors on a patent application filed by Harvard incorporating discoveries described in the manuscript.

Figures

Figure 1
Figure 1. TRPV1 neurons regulate survival and the outcome of lethal S. aureus pneumonia.
(a) For genetic ablation of TRPV1+ neurons, Trpv1-Dtr mice 5 to 7 weeks of age were treated with DT (200 ng/mouse intraperitoneally (i.p.)) daily for 21 d. Mice were rested 7 d before intratracheal inoculation with S. aureus USA300 (1.3 × 10⁸ to 1.4 × 10⁸ CFU/mouse). (b) Left, survival curves of PBS-treated Trpv1-Dtr mice (n = 11) and DT-treated Trpv1-Dtr mice (n = 13). Log-rank (Mantel–Cox) test (P = 0.01). Right, measurements of core body temperature (temp.) over time in PBS-treated (n = 7) and DT-treated Trpv1-Dtr mice (n = 8). Two-way repeated (RM) analysis of variance (ANOVA) with Bonferroni post tests (***P = 0.001; *P = 0.014). (c) Lung bacterial burdens 12 h after infection in PBS-treated (n = 13) and DT-treated Trpv1-Dtr mice (n = 12). Two-tailed unpaired t test (P = 0.0042). (d) Resiniferatoxin (RTX)-mediated chemical ablation of TRPV1+ neurons. WT mice 4 weeks of age were injected subcutaneously daily with three escalating doses of RTX or vehicle. Mice were rested for 4 weeks before intratracheal inoculation with S. aureus USA300 (0.8 × 10⁸ to 1 × 10⁸ CFU/mouse). (e) Left, survival curves of vehicle-treated (n = 20) and RTX-treated mice (n = 18). Log-rank test (P < 0.0001). Right, core-body-temperature measurements in vehicle-treated (n = 5) and RTX-treated mice (n = 5). Two-way RM ANOVA with Bonferroni post tests (****P < 0.001). (f) Lung bacterial-load recovery 12 h after S. aureus infection in vehicle-treated (n = 13) and RTX-treated mice (n = 13). Two-tailed unpaired t tests (P = 0.0035). Data were pooled from two (b) or three (c,e,f) independent experiments. Data are shown as mean ± s.e.m. (b,e, core body temperature) and mean (c,f).
Figure 2
Figure 2. TRPV1 neurons suppress lung inflammation and cytokine induction during S. aureus infection.
(a) H&E-stained lung sections from vehicle-treated and RTX-treated mice at 12 h or 24 h after S. aureus infection. Representative images were chosen from 15 lung lobes imaged from 3 mice in each group (vehicle (veh) and RTX). Scale bars: black, 500 μm; red, 100 μm. (b) Brown and Brenn Gram-stained images of bacterial colonies in lung sections from vehicle-treated and RTX-treated mice, 12 h and 24 h after infection. Representative images were chosen from 15 lung lobes imaged from 3 mice in each group (vehicle and RTX). Inset, purple bacterial cocci are S. aureus colonies. Red scale bars, 50 μm. (c) Quantification of total protein levels in BALF at different time points after S. aureus infection (1 × 10⁸ CFU/mouse). Vehicle-treated group, 0 h (n = 6), 2 h (n = 8), 6 h (n = 8), 12 h (n = 9); RTX-treated group, 0 h (n = 6), 2 h (n = 7), 6 h (n = 6), 12 h (n = 10). Two-way RM ANOVA with Bonferroni post tests (****P < 0.001). (d) Levels of IL-6, TNF-α, and CXCL-1 in BALF from mice at different time points after S. aureus infection (1 × 10⁸ CFU/mouse). TNF-α: vehicle-treated group, 0 h (n = 6), 2 h (n = 10), 6 h (n = 10), 12 h (n = 10); RTX-treated group, 0 h (n = 6), 2 h (n = 7), 6 h (n = 6), 12 h (n = 10). IL-6: vehicle-treated group, 0 h (n = 6), 2 h (n = 10), 6 h (n = 10), 12 h (n = 10); RTX-treated group, 0 h (n = 6), 2 h (n = 7), 6 h (n = 6), 12 h (n = 10). CXCL-1: vehicle-treated group, 0 h (n = 6), 2 h (n = 8), 6 h (n = 8), 12 h (n = 10); RTX-treated group, 0 h (n = 6), 2 h (n = 7), 6 h (n = 6), 12 h (n = 10). Statistical analysis for all cytokines by two-way RM ANOVA with Bonferroni post tests (**P = 0.0013; ****P < 0.0001). Data from one experiment with multiple biological replicates are shown in a and b; data pooled from two independent experiments are shown in c and d. Data are shown as mean ± s.e.m. in c and d.
Figure 3
Figure 3. TRPV1 neurons suppress recruitment of Ly6G+ neutrophils essential for host defense against lethal pneumonia.
(a) Representative FACS plots of neutrophils (CD11b+Ly6G+, out of CD45+ cells) in vehicle-treated and RTX-treated mice in BALF collected at 6 h postinfection with S. aureus (0.8 × 10⁸ CFU/mouse). Representative FACS plots were chosen from 4 mice in each group (vehicle and RTX). (b) Time course of CD11b+Ly6G+ neutrophil recruitment in the BALF of RTX-treated mice compared with vehicle-treated mice after lethal S. aureus infection. n = 4 mice in each group (vehicle and RTX) for 2 h, 6 h, and 12 h data sets. Two-way ANOVA with Bonferroni post tests (***P = 0.001). (c) Representative FACS plots (left) and quantification data (right), showing neutrophils (Gr1hiCD11b+ cells) in the lung homogenates of DT-treated (n = 4) and PBS-treated Trpv1-Dtr mice (n = 4) 12 h after S. aureus infection (1.3 × 10⁸ CFU/mouse). Statistical analysis by two-tailed t test. (d) FACS plots showing anti-GR1 antibody–mediated ablation of lung neutrophils in vehicle (n = 3) and RTX-treated (n = 3) mice 12 h after S. aureus infection (0.8 × 10⁸ CFU/mouse). (e) Left, Kaplan–Meier survival curves after S. aureus lung infection (1.2 × 10⁸ to 1.35 × 10⁸ CFU/mouse) of vehicle + rat IgG mice (n = 10), vehicle + anti-GR1 mice (n = 10), RTX + rat IgG mice (n = 9), and RTX + anti-GR1 mice (n = 10). Statistical analysis by log-rank test, P < 0.0001 (RTX + rat IgG versus RTX + anti-GR1), P < 0.0001 (vehicle + rat IgG versus vehicle + anti-GR1), and P = 0.002 (vehicle + rat IgG versus RTX + rat IgG). Right, core body temperature, measured after S. aureus infection with or without neutrophil depletion. Vehicle + rat IgG (n = 5); vehicle + anti-GR1 (n = 5); RTX + rat IgG (n = 4); RTX + anti-GR1 (n = 5). Statistical analysis by two-way RM ANOVA with Bonferroni post tests (P = 0.008, RTX + rat IgG versus RTX + anti-GR1). Data from two independent experiments (b,e) or one experiment with multiple biological replicates (c) are shown. Data are shown as mean ± s.e.m. in b, c (neutrophil proportions), and e (core body temperature).
Figure 4
Figure 4. Neutrophil dynamics are altered in TRPV1-neuron-ablated mice.
(a) In vivo imaging of neutrophils in the lungs after lethal GFP–S. aureus USA300 lung infection in live vehicle-treated and RTX-treated mice at 4 h postinfection. (b) Total neutrophils, determined per field of view. (c) Neutrophil behavior, phenotyped and quantified as tethering, adhesion, or crawling. NS, nonsignificant. (d) Crawling tracks, displayed for individual neutrophils. (e) Distances for individual neutrophils. n = 3 individual experiments performed for vehicle-treated mice and 4 individual experiments for RTX-treated mice. For statistical analyses, values for each parameter (b,c,e) were averaged for each animal, and two-tailed unpaired t tests were performed, comparing vehicle-treated and RTX-treated mouse groups. Data are shown as mean ± s.e.m. in b, c, and e.
Figure 5
Figure 5. TRPV1 neurons regulate lung γδ T cells, which mediate host protection against S. aureus pneumonia.
(ac) To detect differences at steady state, lung tissues from nociceptor-depleted (RTX treated, n = 8) and nondepleted mice (vehicle treated, n = 8) were analyzed by flow cytometry for myeloid immune cells (a), lymphoid immune cells (b), and γδ T cell populations (c). Statistical analysis in ac by two-tailed unpaired t tests. Alv. mac, alveolar macrophages; int. mac, interstitial macrophages; NK, natural killer. (d) Representative FACS plots showing γδ T cells in WT or Tcrd−/− mice (RTX or vehicle treated) either uninfected (uninf.) or 12 h postinfection (inf.) with S. aureus (1 × 10⁸ CFU/mouse). Vehicle-treated groups: WT uninfected (n = 8), WT infected (n = 4), Tcrd−/− infected (n = 3); RTX-treated groups: WT uninfected (n = 8), WT infected (n = 4), Tcrd−/− infected (n = 3). (e) Left, survival curves for vehicle-treated WT mice (n = 7), vehicle-treated Tcrd−/− mice (n = 6), RTX-treated WT mice (n = 5), and RTX-treated Tcrd−/− mice (n = 6) after lethal S. aureus infection (1 × 10⁸ CFU/mouse). Statistical analysis by log-rank test (P = 0.01, RTX-treated WT versus RTX-treated Tcrd−/−; P = 0.08, vehicle-treated WT versus vehicle-treated Tcrd−/−). Right, core-body-temperature measurements in vehicle-treated WT mice (n = 5), vehicle-treated Tcrd−/− mice (n = 5), RTX-treated WT mice (n = 5), and RTX-treated Tcrd−/− mice (n = 4). Two-way RM ANOVA with Bonferroni post tests (P < 0.0001, RTX-treated WT versus RTX-treated Tcrd−/−). (f) Representative FACS plots of CD11bSiglecF+ alveolar macrophages after intratracheal administration of CLL or PBS-L in vehicle-treated and RTX-treated mice 12 h postinfection. Vehicle-treated groups: uninfected (n = 8), PBS-L infected (n = 3), CLL infected (n = 3); RTX-treated groups: uninfected (n = 8), PBS-L infected (n = 4), CLL infected (n = 3). (g) Left, survival curves after S. aureus lung infection (1 × 10⁸ CFU/mouse) with or without alveolar macrophage depletion. Vehicle + PBS-L (n = 10), vehicle + CLL (n = 10), RTX + CLL (n = 10), RTX + PBS-L (n = 8). Log-rank test (P = 0.37, RTX + PBS-L versus RTX + CLL; P = 0.22, vehicle + PBS-L versus vehicle + CLL). Right, core-body-temperature measurements. Vehicle + PBS-L (n = 4), vehicle + CLL, (n = 4), RTX + CLL (n = 4), and RTX + PBS-L (n = 4). Two-way RM ANOVA with Bonferroni post tests. One experiment with multiple biological replicates was performed for e, and two independent experiments were performed for ad and fg. Data shown in ac, e (core body temperature), and g (core body temperature) are mean ± s.e.m.
Figure 6
Figure 6. Vagal TRPV1 neurons and the neuropeptide CGRP regulate S. aureus pneumonia.
(a) DT or PBS alone was injected bilaterally into VG in Trpv1-Dtr mice. Quantification of proportions of TRPV1+ and CGRP+ neurons in VG and DRG (T1-T9) of vagal DT-injected mice (n = 3) and PBS-injected littermate-control (n = 3) mice. Statistical analysis by two-tailed unpaired t tests. (b) Left, survival curves of PBS VG-injected Trpv1-Dtr mice (n = 9) compared with DT vagal-injected Trpv1-Dtr mice (n = 8) after lethal S. aureus lung infection (1.3 × 10⁸ to 1.4 × 10⁸ CFU/mouse). Log-rank test, P = 0.0003. Right, core body temperature in PBS vagal-injected Trpv1-Dtr mice (n = 4) compared with DT vagal-injected Trpv1-Dtr mice (n = 4) after infection. Two-way RM ANOVA with Bonferroni post tests (****P < 0.0001). (c) CGRP levels in the BALF in uninfected mice or mice 12 h after infection with WT USA300 S. aureus (0.8 × 10⁸ CFU/mouse) or Δagr USA300 S. aureus (0.8 × 10⁸ CFU/mouse); uninfected (n = 5), WT infected (n = 5), and Δagr infected (n = 5). Statistical analysis by one-way ANOVA with Bonferroni post tests. (d) CGRP levels in the BALF in RTX-treated mice (n = 5) and vehicle-treated mice (n = 5); or CGRP levels in vagal DT-treated (n = 5) or PBS-treated Trpv1-Dtr mice (n = 4) 12 h after WT S. aureus infection (1.1 × 10⁸ to 1.4 × 10⁸ CFU/mouse). Statistical analysis by two-tailed unpaired t test. (e) Production levels of TNF-α, IL-6, and CXCL-1 by whole lung cell cultures after infection with S. aureus at a multiplicity of infection (MOI) of 2 at 2 h, 6 h, 12 h, and 20 h postinfection with or without CGRPα (100 nM). Statistical analysis by two-way ANOVA with Bonferroni post tests. (**P < 0.01; ***P < 0.001; ****P < 0.0001). (f) The CGRP-receptor antagonist CGRP8–37 was administered systemically (i.p.) at 800 ng (256 pmol) per dose dissolved in PBS, at −24 h, −2 h, 12 h, 24 h, 36 h and 48 h relative to intratracheal S. aureus infection (0 h). Control mice received i.p. PBS injections at the same time points. Left, survival curves for mice (PBS treated, n = 8; CGRP8–37 treated, n = 8) after S. aureus lung infection. Log-rank test, P = 0.04. Right, core-body-temperature measurements (PBS treated, n = 3; CGRP8–37 treated, n = 5) after S. aureus infection. Two-way RM ANOVA with Bonferroni post tests (**P = 0.004; ***P = 0.0002). (g) CGRP8–37 was administered i.p. at 7.5 μg (2.4 nmol) per dose in PBS at 4-h, 16-h and 24-h time points relative to intratracheal S. aureus infection (0 h). Control mice received i.p. PBS injections at the same time points. Left, survival curves for PBS-treated (n = 20) and CGRP8–37-treated (n = 19) mice. Log-rank test, P = 0.03. Right, core body temperature of PBS-treated (n = 12) and CGRP8–37-treated (n = 11) mice. Two-way RM ANOVA with Bonferroni post tests (**P = 0.002 (16 h); **P = 0.004 (24 h)). One experiment was performed with multiple biological replicates for a, d, and f; two independent experiments were performed for b, c, and e; three independent experiments were performed for g.

Comment in

  • Neuroimmunology: No pain, all gain.
    Bird L. Bird L. Nat Rev Immunol. 2018 Apr;18(4):222-223. doi: 10.1038/nri.2018.21. Epub 2018 Mar 16. Nat Rev Immunol. 2018. PMID: 29545640 No abstract available.

References

    1. Parker D, Prince A. Immunopathogenesis of Staphylococcus aureus pulmonary infection. Semin. Immunopathol. 2012;34:281–297. doi: 10.1007/s00281-011-0291-7. - DOI - PMC - PubMed
    1. Tong SY, Davis JS, Eichenberger E, Holland TL, Fowler VG., Jr. Staphylococcus aureus infections: epidemiology, pathophysiology, clinical manifestations, and management. Clin. Microbiol. Rev. 2015;28:603–661. doi: 10.1128/CMR.00134-14. - DOI - PMC - PubMed
    1. Inoshima I, et al. A Staphylococcus aureus pore-forming toxin subverts the activity of ADAM10 to cause lethal infection in mice. Nat. Med. 2011;17:1310–1314. doi: 10.1038/nm.2451. - DOI - PMC - PubMed
    1. Mizgerd JP. Acute lower respiratory tract infection. N. Engl. J. Med. 2008;358:716–727. doi: 10.1056/NEJMra074111. - DOI - PMC - PubMed
    1. Tränkner D, Hahne N, Sugino K, Hoon MA, Zuker C. Population of sensory neurons essential for asthmatic hyperreactivity of inflamed airways. Proc. Natl. Acad. Sci. USA. 2014;111:11515–11520. doi: 10.1073/pnas.1411032111. - DOI - PMC - PubMed

Publication types

MeSH terms

Substances