. 2018 May;24(4):474-483.
doi: 10.1038/nm.4505. Epub 2018 Mar 5.

Single-cell developmental classification of B cell precursor acute lymphoblastic leukemia at diagnosis reveals predictors of relapse

Affiliations

Single-cell developmental classification of B cell precursor acute lymphoblastic leukemia at diagnosis reveals predictors of relapse

Zinaida Good et al. Nat Med. 2018 May.

Abstract

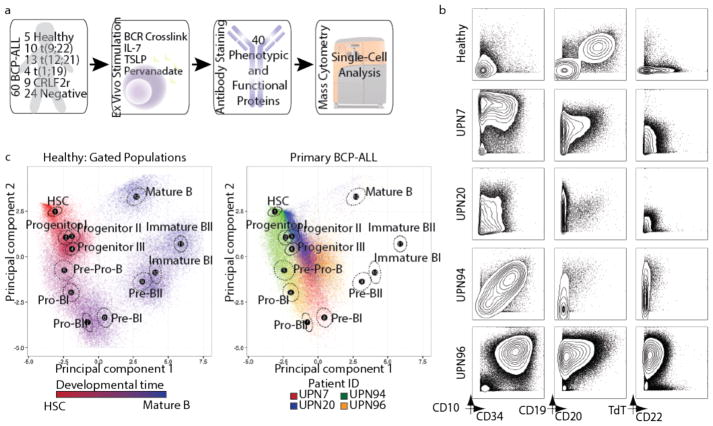
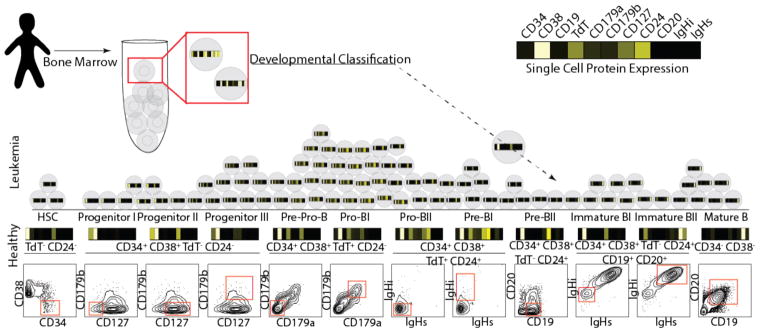
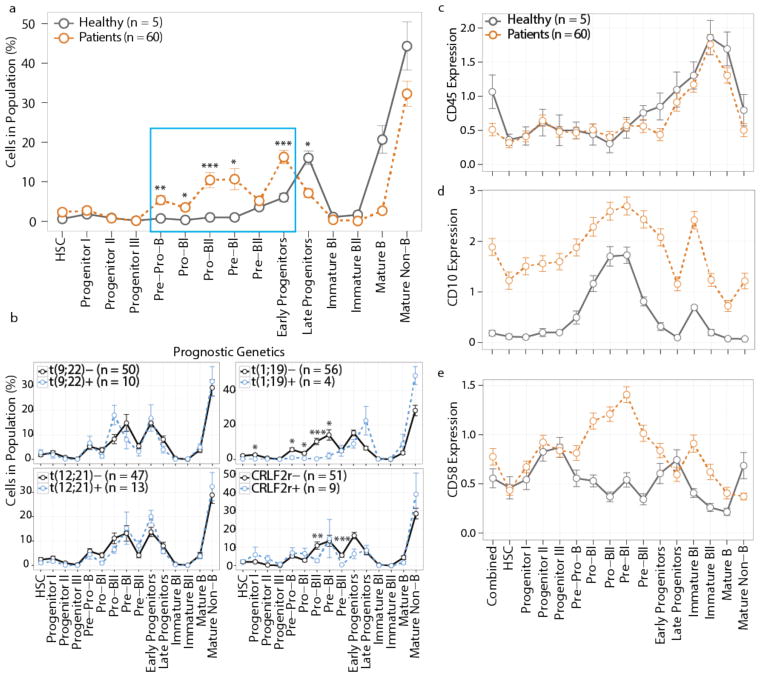
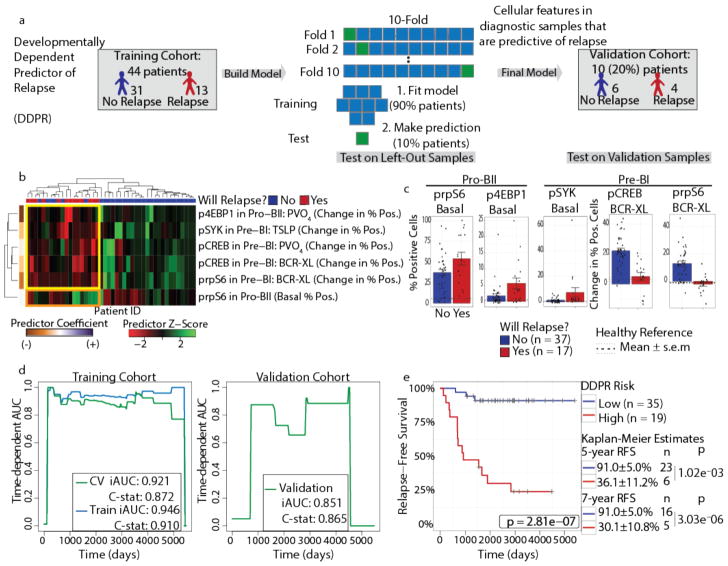
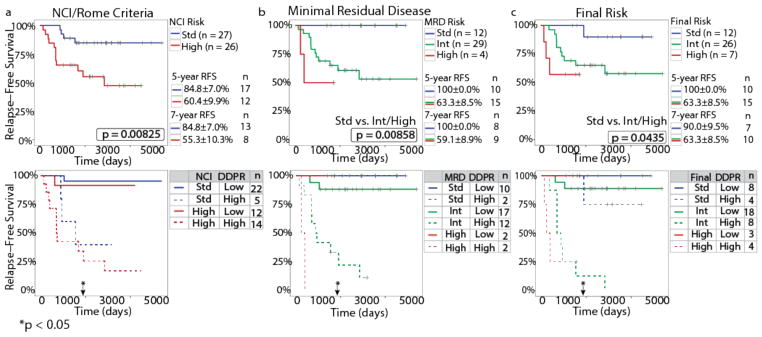
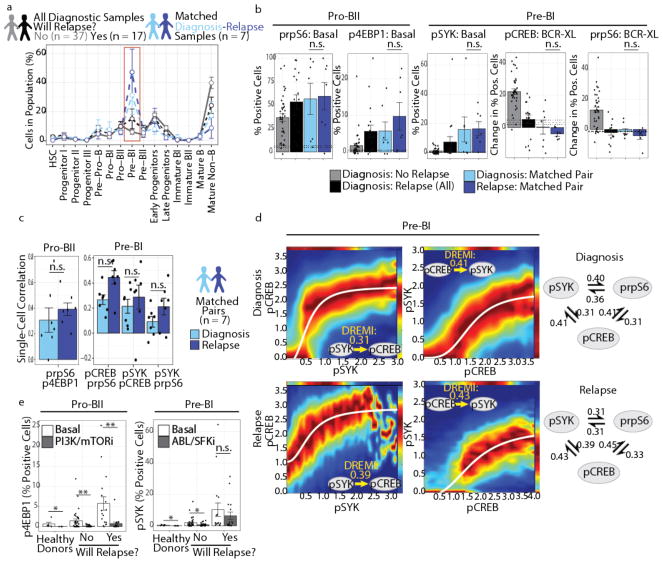
Insight into the cancer cell populations that are responsible for relapsed disease is needed to improve outcomes. Here we report a single-cell-based study of B cell precursor acute lymphoblastic leukemia at diagnosis that reveals hidden developmentally dependent cell signaling states that are uniquely associated with relapse. By using mass cytometry we simultaneously quantified 35 proteins involved in B cell development in 60 primary diagnostic samples. Each leukemia cell was then matched to its nearest healthy B cell population by a developmental classifier that operated at the single-cell level. Machine learning identified six features of expanded leukemic populations that were sufficient to predict patient relapse at diagnosis. These features implicated the pro-BII subpopulation of B cells with activated mTOR signaling, and the pre-BI subpopulation of B cells with activated and unresponsive pre-B cell receptor signaling, to be associated with relapse. This model, termed 'developmentally dependent predictor of relapse' (DDPR), significantly improves currently established risk stratification methods. DDPR features exist at diagnosis and persist at relapse. By leveraging a data-driven approach, we demonstrate the predictive value of single-cell 'omics' for patient stratification in a translational setting and provide a framework for its application to human cancer.


Conflict of interest statement

Competing financial interests

S.C.B. and G.P.N. are paid consultants for Fluidigm, the manufacturer that produced some of the reagents and instrumentation used in this manuscript.

Figures

Figure 1
Figure 1. Mass cytometry analysis of BCP-ALL reveals phenotypic heterogeneity of leukemic cells
(a) Summary of primary BCP-ALL sample processing for mass cytometry analysis (see Supplementary Tables 1–3 for patient information, antibody panel, and perturbation conditions, respectively). 60 primary BCP-ALL samples and 5 healthy control bone marrow aspirates were included. Prognostic cytogenetic translocations identified at diagnosis, as well as relevant ex vivo perturbations used to uncover cell state, are indicated. ‘Negative’ patients were negative for any of the prognostic cytogenetic translocations analyzed. (b) Mass cytometry analysis of commonly used diagnostic antigens expressed by lineage-negative bone marrow cells (see Supplementary Fig. 1a for gating) from 4 representative BCP-ALL patients and 1 healthy donor. (c) Left panel: 5,000 cells from 12 manually gated stages of B-cell development in healthy bone marrow demonstrate phenotypic progression during normal B lymphopoiesis (1,000 cells sampled from each of n = 5 donors). The first 2 principal components were constructed using 11 markers defining B-cell developmental populations (see Supplementary Figs. 1b–d for gating, marker weights, and variance captured by each principal component). The developmental time color scale was defined by setting hematopoietic stem cells as red and mature B cells as blue. Intermediate populations were placed on this red-to-blue color gradient at equal intervals. For each stage, a black dot indicates the population centroid, and the surrounding circle indicates standard error based on 5 healthy donors. Right panel: Data from 4 patients in (b) shown projected onto healthy B-cell progression. Each sample uniquely occupies the PCA space, while overlapping with multiple healthy populations and other patient samples. BCR, B-cell receptor; TSLP, thymic stromal lymphopoietin; PCA, principle component analysis.
Figure 2
Figure 2. Single-cell developmental classifier for BCP-ALL
Healthy bone marrow aspirates from 5 donors were manually gated into 12 consecutive developmental stages of B lymphopoiesis (final gate is shown as a red box on a contour plot in the bottom, while the text above indicates prior gate(s) on lineage-negative cells; see Supplementary Figs. 1a and 1b for complete gating strategy). The mean arsinh-transformed expression of 11 proteins with relevance to normal B lymphopoiesis, shown in the heat-bar, was determined for each normal cell population (shown above the contour plots, where black indicates low expression and white – high expression). Single cells from each BCP-ALL sample were then assigned to their most similar normal population based on the shortest Mahalanobis distance calculated from expression of the same 11 proteins. Cells with distance above the classification threshold to all developmental populations remained unclassified (<1% for each patient). IgHi, intracellular immunoglobulin heavy chain; IgHs, surface immunoglobulin heavy chain.
Figure 3
Figure 3. Developmental classification reveals that BCP-ALL expands across the pre-proB to pre-BI transition
(a) Percentage of cells from healthy donor (n = 5, gray line) or diagnostic BCP-ALL patient (n = 60, orange line) bone marrow classified into each developmental population. Cell populations significantly expanded in leukemic samples are shown in the blue box (pre-pro-B p = 0.0012, pro-BI p = 0.011, pro-BII p = 0.00013, pre-BI p = 0.011, early progenitors p = 0.00013); late progenitors contracted (p = 0.036), and the remaining populations did not change significantly (p ≥ 0.05). (b) Percentage of cells in each developmental patient population grouped by diagnostic cytogenetics: i) translocation t(9;22)(q34;q11) BCR/ABL1: t(9;22)- (n = 50) vs. t(9;22)+ (n = 10); ii) translocation t(1;19)(q23;p13) TCF3/PBX1: t(1;19)- (n = 56) vs. t(1;19)+ (n = 4): progenitor I p = 0.015, pre-pro-B p = 0.037, pro-BI = 0.026, pro-BII p = 6.2×10⁻⁶, pre-BI p = 0.022; iii) translocation t(12;21)(p13;q22) ETV6/RUNX1: t(12;21)- (n = 47) vs. t(12;21)+ (n = 13), and iv) CRLF2-rearranged: CRLF2r- (n = 51) vs. CRLF2r+ (n = 9): pro-BII p = 0.0033, pre-BII p = 0.00017. (c–e) Antigen expression on bone marrow developmental populations from healthy donors (n = 5, gray line) or patients (n = 60, orange line): CD45 (c), CD10 (d), and CD58 (e). Mean ± s.e.m.; p-values in (a) and (b) are from unpaired two-tailed Welch’s t test accounting for multiple comparisons using Bonferroni correction. “Combined” in (c–e) denotes expression in all cells without developmental classification. *p < 0.05, **p < 0.01, ***p < 0.001.
Figure 4
Figure 4. DDPR predicts which patients will go on to relapse based on features of expanded BCP-ALL populations at diagnosis
(a) Construction of the Developmentally Dependent Predictor of Relapse (DDPR) model that predicts relapse in BCP-ALL. Data from 54 patients with ≥3 years of follow-up were divided into training (n = 44) and validation (n = 10) cohorts. Cellular features available to DDPR included signaling in the basal state, changes in signaling state following perturbations, mean arsinh-transformed expression of surface and intracellular proteins, and frequency of cells in the expanded developmental populations. DDPR performance was estimated using 10-fold cross-validation (CV) within the training cohort to yield pre-validated relative risk for each patient. The final DDPR model (elastic net-regularized Cox model) was then built using all training cohort samples. Once constructed, DDPR was applied to predict relative risk for samples in the validation cohort. (b) Hierarchical clustering of 6 predictive features of relapse identified by DDPR within the training cohort. The last documented relapse status is shown above the heatmap as relapse (red) or continuous complete remission (blue). Coefficients of predictors are shown on the left of the heatmap. Yellow box indicates 5 features with negative correlation to relapse. Orange box indicates 1 feature with positive correlation to relapse. (c) Bar plots show mean ± s.e.m of key DDPR cellular features in pro-BII and pre-BI cells in all patients (n = 54); p-values are not shown, because these features were selected to be different and non-redundant between classes (unpaired two-tailed Welch’s t test from left to right would yield: p = 0.055, p = 0.044, p = 0.13, p = 5.7×10⁻⁶, p = 1.6×10⁻⁷). Dashed lines indicate mean levels in the corresponding developmental populations within healthy bone marrow aspirates of 5 healthy donors; dotted lines indicate standard error. (d) Time-dependent AUC curves showing performance for relapse prediction in the training (left) and validation (right) cohorts. Integrated dynamic/cumulative AUC (iAUC) and C-statistic (C-stat) summary measures are shown for each curve built using pre-validated (green, left), overall model fit (blue, left), and predicted (green, right) relative risk of relapse with reference to the sample average. (e) Kaplan-Meier analysis of relapse-free survival (RFS) of all patients with ≥3 years of follow-up (n = 54) stratified by DDPR risk group. An estimate for relative risk of relapse was used to assign a risk group to each patient (pre-validated in the training cohort; predicted in the validation cohort; see Methods). P-values were calculated using the log-rank test. Log-rank tests for the training cohort alone: p = 5.6×10⁻⁶; validation cohort alone: p = 0.040. RFS estimates, standard error, number of patients at risk, and p-values for both groups at 5 and 7 years are shown on the right (5 years p = 1.02×10⁻³, 7 years p = 3.03×10⁻⁶). BCR-XL, B-cell receptor crosslink; TSLP, thymic stromal lymphopoietin; PVO4, pervanadate.
Figure 5
Figure 5. DDPR synergizes with existing risk stratification methods to improve relapse-free survival prediction for patients with BCP-ALL
(a) A Kaplan-Meier analysis showing RFS for patients with ≥3 years of follow-up data and known NCI/Rome criteria (n = 53), stratified by NCI/Rome criteria alone (top) or NCI/Rome criteria and DDPR (bottom). (b–c) RFS as in (a) for patients with known MRD risk (b) or final risk (c), as determined by protocol definitions (n = 45), stratified by the clinical risk group alone (top) or risk group and DDPR (bottom). An estimate for relative risk of relapse was used to assign a DDPR risk group to each patient (pre-validated in the training cohort; predicted in the validation cohort; see Methods). Kaplan-Meier estimates with standard error and the number of people at risk are shown for 5-year and 7-year RFS in the top plots (5-year and 7-year p-values: NCI/Rome criteria: p = 0.033 and p = 0.040, MRD risk: p = 0.157 and p = 0.084, final risk: p = 0.157 and p = 0.169). The p-values were calculated using the log-rank test; p-values in (b) and (c) are between standard risk and intermediate/high risk groups due to low number of patients in the high risk group. Black arrows with asterisks indicate a significant improvement in patient risk stratification at 5 years following diagnosis achieved by adding DDPR to each established criteria: continuous net reclassification improvement (NRI) for NCI/Rome criteria: p = 0.027, MRD risk: p = 0.033, final risk: p = 0.013; see Supplementary Fig. 5a for NRI estimates and 95% confidence intervals. MRD, minimal residual disease; RFS, relapse-free survival.
Figure 6
Figure 6. Cells with DDPR features pre-exist at diagnosis and persist at relapse
(a) Percentage of cells in each developmental population (mean ± s.e.m.) of all diagnostic BCP-ALL samples from patients who stayed in continuous remission for ≥3 years (gray, n = 37) or went on to relapse (black, n = 17), compared to matched diagnosis-relapse pairs (diagnosis: blue, relapse: purple, n = 7). Red box highlights a significant (p = 0.0030) expansion of pre-BI population at relapse compared to diagnostic samples of patients who did not relapse. P-values were calculated using a two-sided Tukey’s honest significance test and were corrected for multiple comparisons using Bonferroni correction. (b) Bar plots (mean ± s.e.m.) showing key DDPR features in all diagnostic samples compared to matched diagnosis-relapse pairs, as in (a): percent of pro-BII cells with phosphorylated (p) rpS6 or 4EBP1 in non-stimulated (basal) state, percent of pre-BI cells with pSYK in basal state, and change from basal state in percent of pre-BI cells with pCREB or prpS6 signaling following pre-BCR cross-linking (BCR-XL). (c) Bar plots (mean ± s.e.m.) showing Spearman's rank correlation coefficient for key DDPR features listed in (b) was calculated for matched diagnosis-relapse pairs (n = 7): single-cell correlation of arsinh-transformed values between prpS6 and p4EBP1 in pro-BII cells (left), or between pCREB and prpS6, pSYK and pCREB, or pSYK and prpS6 in pre-BI cells (right). None of the DDPR features changed significantly from diagnosis to relapse in (b-c) (paired two-tailed Welch’s t test applied to matched diagnosis-relapse pairs only). (d) DREMI analysis and DREVI visualization for DDPR features in pre-BI cells. Up to 5,000 pre-BI cells from matched diagnosis-relapse pairs (n = 7) were sampled and pooled prior to analysis. Left: Estimated conditional density functions for pSYK-to-pCREB signaling response (pSYK→pCREB) and pCREB→pSYK at diagnosis and relapse; sigmoidal response functions were fitted to each plot. Right: Quantification for strengths of pairwise signaling relationships within the network formed by pSYK, pCREB, and prpS6 at diagnosis and relapse. (e) Bar plots (mean ± s.e.m.) showing response of DDPR features (basal p4EBP1 in pro-BII cells and basal pSYK in pre-BI cells) to short-term ex vivo treatment (see Supplementary Table 3) in healthy donors (n = 5) or diagnostic samples (no relapse: n = 37, relapse: n = 17). Shown are the effects of BEZ235 (a dual PI3K and mTOR inhibitor, PI3K/mTORi) in pro-BII cells (healthy p = 0.023, no relapse p = 0.0032, relapse p = 0.0092) and of dasatinib (a dual BCR-ABL and SRC family kinase inhibitor, ABL/SFKi) in pre-BI cells (healthy p = 0.031, no relapse p = 0.048, relapse p = 0.22). Effects were assessed using two- tailed Welch’s t test. n.s, not significant (p ≥ 0.05), *p < 0.05, **p < 0.01.

Comment in

  • Leukaemia: Powers of prediction.
    Dart A. Dart A. Nat Rev Cancer. 2018 May;18(5):372-373. doi: 10.1038/nrc.2018.28. Epub 2018 Apr 3. Nat Rev Cancer. 2018. PMID: 29610489 No abstract available.
  • Predicting leukemia relapse.
    Martín-Subero JI. Martín-Subero JI. Nat Med. 2018 Apr 10;24(4):385-387. doi: 10.1038/nm.4529. Nat Med. 2018. PMID: 29634681 No abstract available.

References

    1. Anderson K, et al. Genetic variegation of clonal architecture and propagating cells in leukaemia. Nature. 2010;469:356–361. - PubMed
    1. Walter MJ, et al. Clonal architecture of secondary acute myeloid leukemia. N Engl J Med. 2012;366:1090–1098. - PMC - PubMed
    1. Welch JS, et al. The origin and evolution of mutations in acute myeloid leukemia. Cell. 2012;150:264–278. - PMC - PubMed
    1. Gerlinger M, et al. Intratumor heterogeneity and branched evolution revealed by multiregion sequencing. N Engl J Med. 2012;366:883–892. - PMC - PubMed
    1. Klco JM, et al. Functional Heterogeneity of Genetically Defined Subclones in Acute Myeloid Leukemia. Cancer Cell. 2014;25:379–392. - PMC - PubMed

Publication types

Substances