. 2018 Aug;32(8):4172-4189.
doi: 10.1096/fj.201701347R. Epub 2018 Mar 5.

Identification of binding sites contributing to volatile anesthetic effects on GABA type A receptors

Affiliations

Identification of binding sites contributing to volatile anesthetic effects on GABA type A receptors

Kellie A Woll et al. FASEB J. 2018 Aug.

Abstract

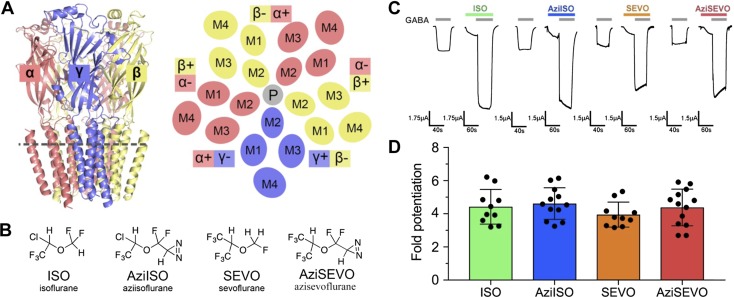
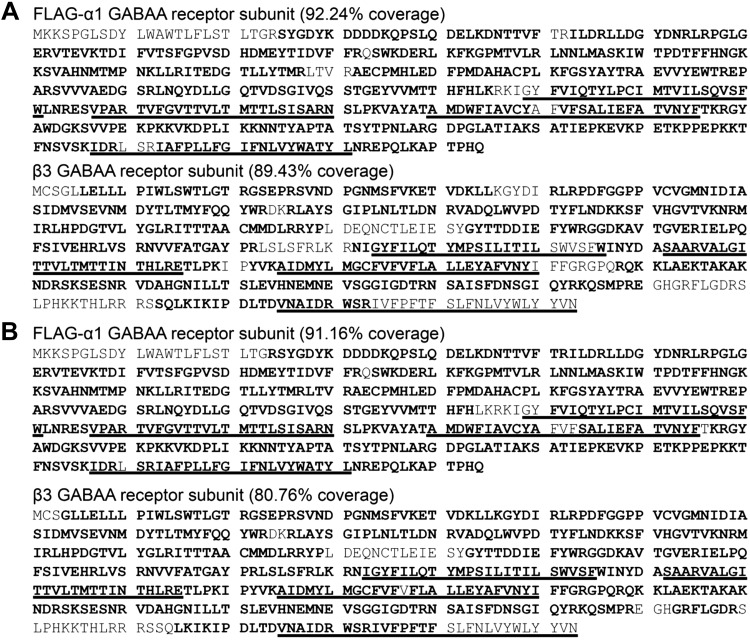
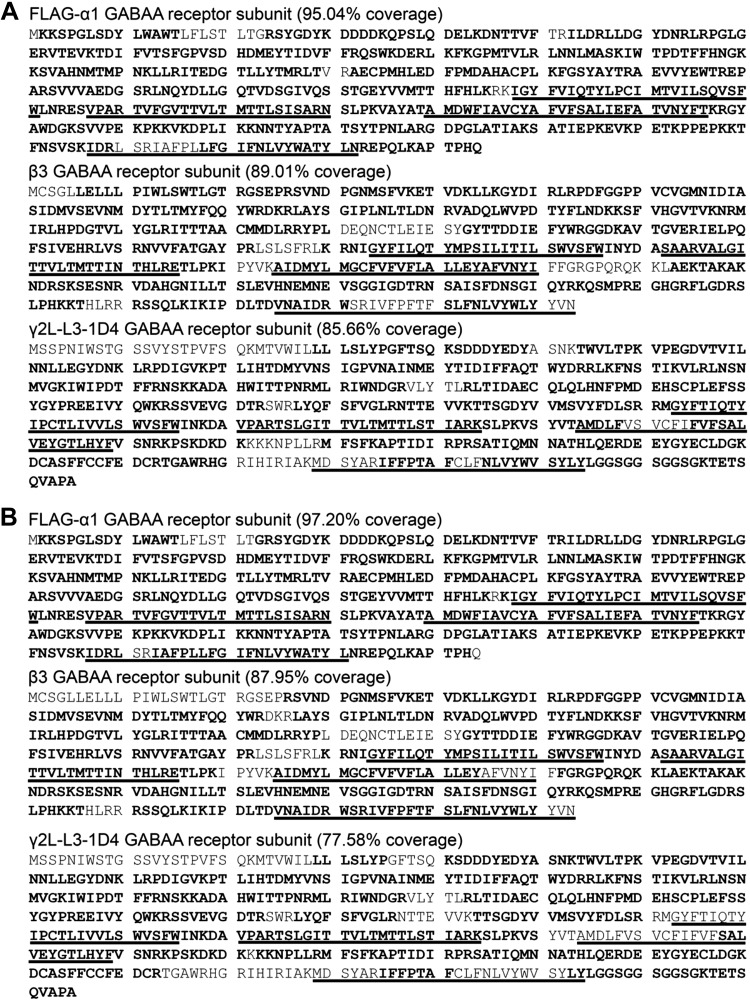
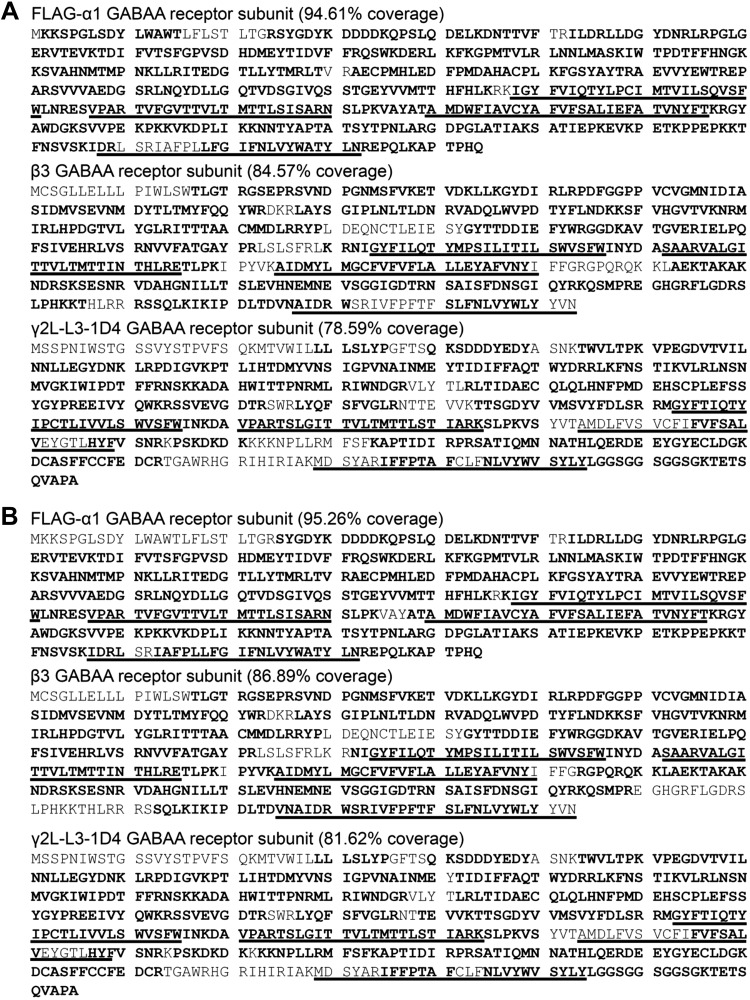
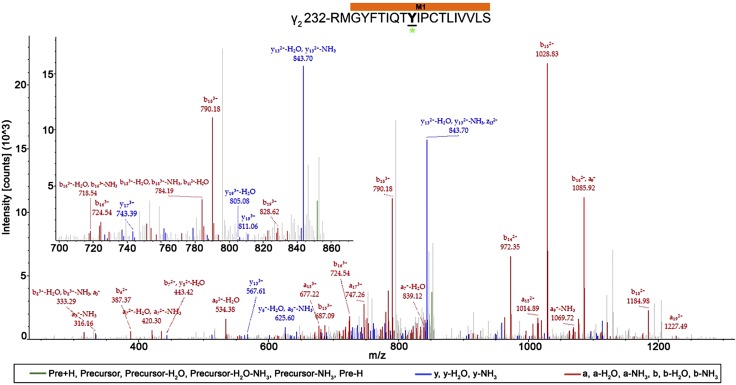
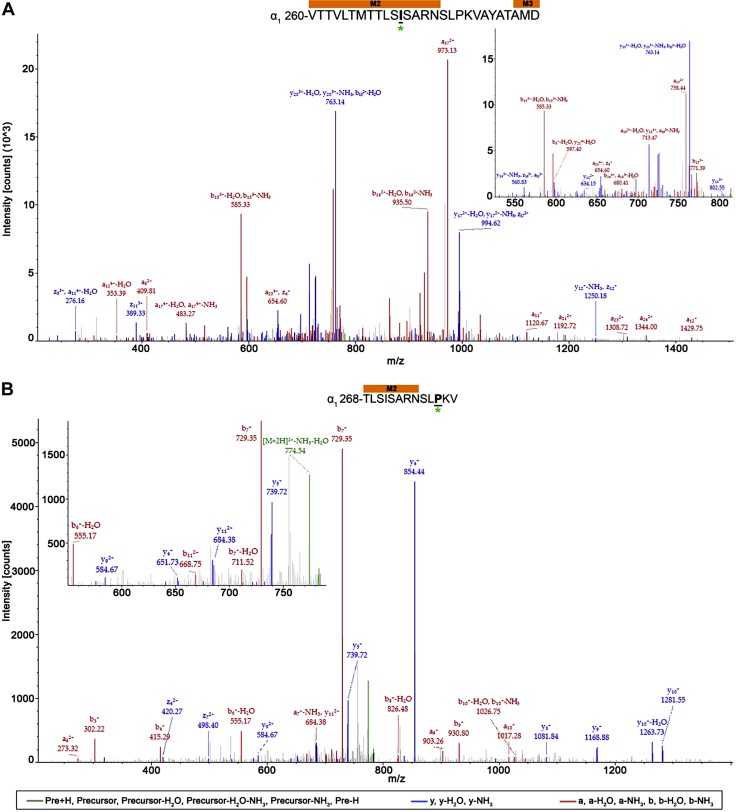
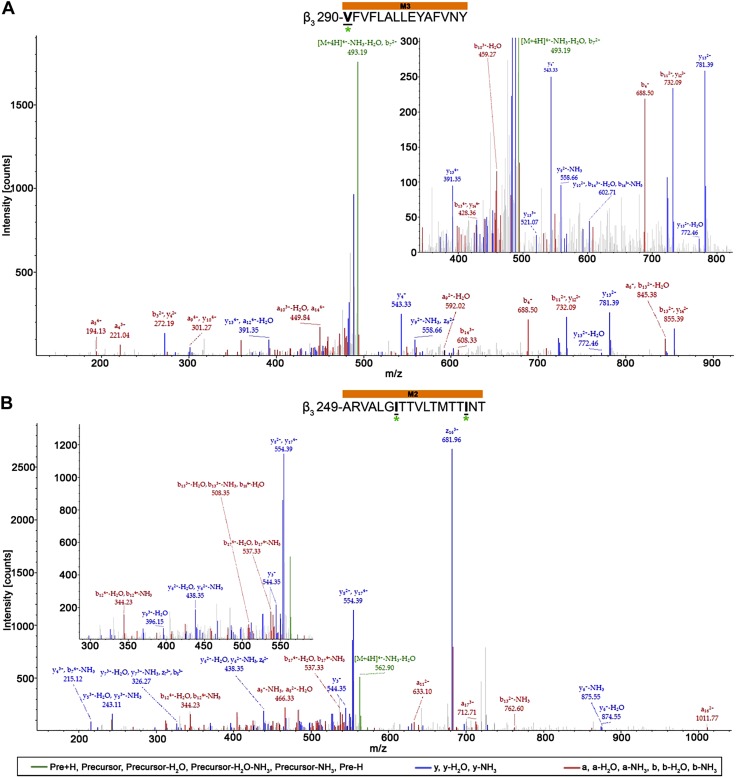
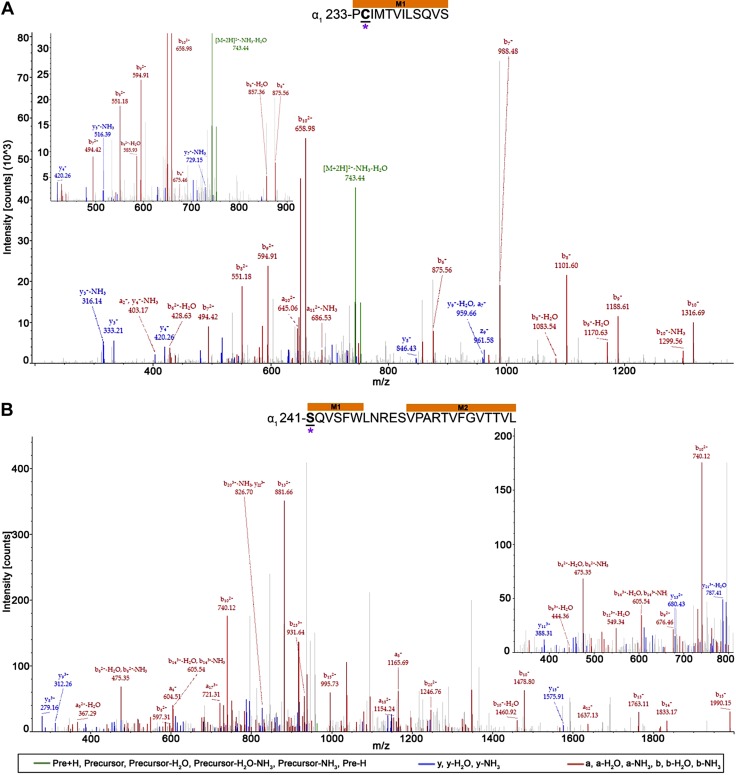
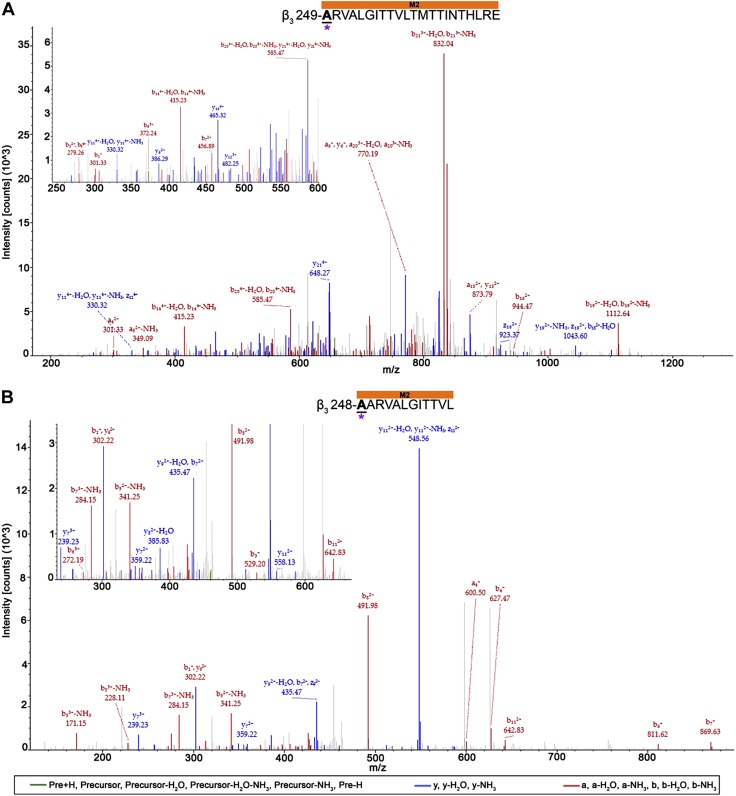
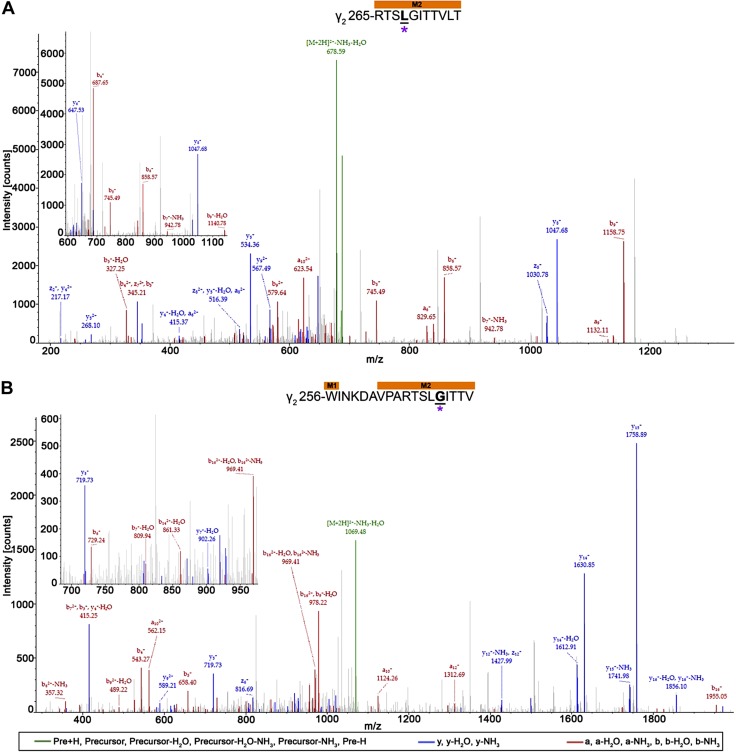
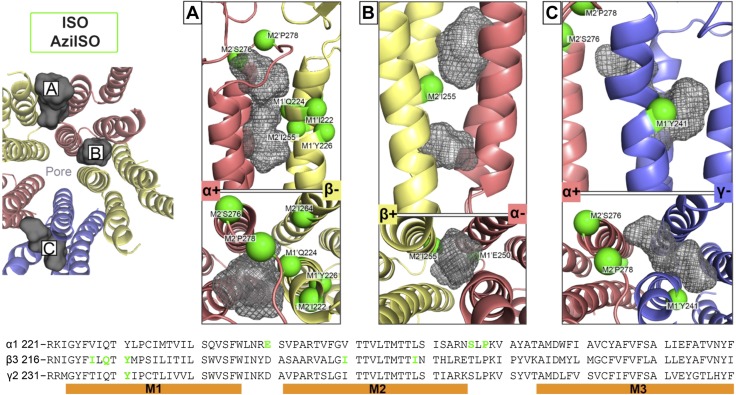
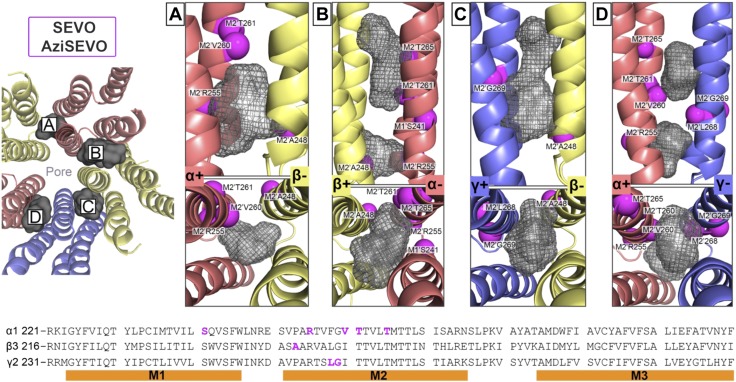
Most general anesthetics enhance GABA type A (GABAA) receptor activity at clinically relevant concentrations. Sites of action of volatile anesthetics on the GABAA receptor remain unknown, whereas sites of action of many intravenous anesthetics have been identified in GABAA receptors by using photolabeling. Here, we used photoactivatable analogs of isoflurane (AziISO) and sevoflurane (AziSEVO) to locate their sites on α1β3γ2L and α1β3 GABAA receptors. As with isoflurane and sevoflurane, AziISO and AziSEVO enhanced the currents elicited by GABA. AziISO and AziSEVO each labeled 10 residues in α1β3 receptors and 9 and 8 residues, respectively, in α1β3γ2L receptors. Photolabeled residues were concentrated in transmembrane domains and located in either subunit interfaces or in the interface between the extracellular domain and the transmembrane domain. The majority of these transmembrane residues were protected from photolabeling with the addition of excess parent anesthetic, which indicated specificity. Binding sites were primarily located within α+/β- and β+/α- subunit interfaces, but residues in the α+/γ- interface were also identified, which provided a basis for differential receptor subtype sensitivity. Isoflurane and sevoflurane did not always share binding sites, which suggests an unexpected degree of selectivity.-Woll, K. A., Zhou, X., Bhanu, N. V., Garcia, B. A., Covarrubias, M., Miller, K. W., Eckenhoff, R. G. Identification of binding sites contributing to volatile anesthetic effects on GABA type A receptors.

Keywords: crosslinking; isoflurane; photoaffinity labeling; sevoflurane.


Conflict of interest statement

This work was supported by U.S. National Institutes of Health Grants P01-GM55876, GM107117, GM110174, P01–GM58448 (National Institute of General Medical Sciences), and AI118891 (Department of Defense); and by the National Science Foundation Graduate Research Fellowship Program (DGE-1321851). The authors declare no conflicts of interest.

Figures

Figure 1
Figure 1
ISO, AziISO, SEVO, and AziSEVO α1β3γ2L GABAA receptor activity. A) Membrane view of the α1β3γ2 GABAA receptor homology model and schematic of the cross-section as indicated by the gray dashed line of the receptor transmembrane domain viewed from the synaptic cleft. Receptor is colored by subunit type (α1, salmon; β3, yellow; and γ2, slate), and membrane-spanning helices (M1–M4) are labeled accordingly for each subunit. The plus and minus subunit interfaces are indicated for each subunit, and the pore (P) is indicated as a gray circle. B) Chemical structures of volatile anesthetics and their photolabel analogs. C) Representative traces of evoked current by GABA EC10 control and after combined GABA EC10 and 0.3 mM ISO, AziISO, SEVO, and AziSEVO exposures within individual X. laevis oocytes expressing the α1β3γ2L GABAA receptor. D) Fold potentiation of GABA EC10 by 0.3 mM ISO, AziISO, SEVO, and AziSEVO within X. laevis oocytes expressing the α1β3γ2L GABAA receptor. Data were analyzed by Mann–Whitney U test that compared the evoked currents of the parent anesthetic with the corresponding photolabel analog. No significant differences were observed.
Figure 2
Figure 2
Coverage map for FLAG-α1β3GABAA receptor mass spectrometry analysis for photolabeled samples with ISO (A) and SEVO (B). Sequence of the purified FLAG-α1β3 GABAA receptor with high-confidence coverage in the mass spectrometry analysis denoted as bold residue codes. Transmembrane domain helices are underlined.
Figure 3
Figure 3
Coverage map for FLAG-α1β3γ2L-L3-1D4 GABAA receptor mass spectrometry analysis for AziISO photolabeled samples without (A) and with (B) ISO. Sequence of the purified FLAG-α1β3γ2L-L3-1D4 GABAA receptor with high-confidence coverage in the mass spectrometry analysis denoted as bold residue codes. Transmembrane domain helices are underlined.
Figure 4
Figure 4
Coverage map for FLAG-α1β3γ2L-L3-1D4 GABAA receptor mass spectrometry analysis for AziSEVO photolabeled samples without (A) and with (B) SEVO. Sequence of the purified FLAG-α1β3γ2L-L3-1D4 GABAA receptor with high-confidence coverage in the mass spectrometry analysis denoted as bold residue codes. Transmembrane domain helices are underlined.
Figure 5
Figure 5
AziISO photolabeled residue within the γ2L-subunit M1 helix within the α1β3γ2L GABAA receptor. Mass spectrum of γ2L-M1′ Y241 AziISO photolabeled peptide. Focused view of the spectrum within ∼700–900 m/z range, with b (red), y (blue), and precursor ions (green) shown (inset). Above the spectrum is the subunit peptide sequence that contains the γ2L-subunit M1 transmembrane helix. The predicted photolabeled residue is shown in bold, underline, and is indicated by a green asterisk. See the Supplemental Material for associated peptide fragment table.
Figure 6
Figure 6
AziISO photolabeled residues within the α1-subunits of α1β3 and α1β3γ2L GABAA receptors. Mass spectra of α1-subunit AziISO photolabeled residues α1-M2′ I271 (A) and α1-M2′ P278 (B) within α1β3 and α1β3γ2L GABAA receptors, respectively. Above the spectra are the subunit peptide sequences that contain the α1-subunit transmembrane helices. Focused view of the spectrum within ∼525–825 (A) and 550–800 m/z (B), with a and/or b (red), y and/or z (blue), and precursor ions (green) shown (inset). Predicted photolabeled residue is shown in bold, underline, and is indicated by a green asterisk. See the Supplemental Material for associated peptide fragment tables.
Figure 7
Figure 7
AziISO photolabeled residues within the β3-subunits of α1β3 and α1β3γ2L GABAA receptors. Mass spectra of β3-subunit AziISO photolabeled residues β3-M3′ V290 (A) and β3-M2′ I255/β3-M2′ I264 (B) within α1β3 and α1β3γ2L GABAA receptors, respectively. Focused view the spectrum within ∼350–825 (A) and 280–590 m/z (B), with b (red), y (blue), and precursor ions (green) shown. Predicted photolabeled residues is shown in bold, underlined, and is indicated by a green asterisk. Above the spectra are the subunit peptide sequences that contain the β3-subunit transmembrane helices. Predicted photolabeled residue is shown in bold, underlined, and is indicated by a green asterisk. See the Supplemental Material for associated peptide fragment tables.
Figure 8
Figure 8
AziSEVO photolabeled residues within the α1-subunits of α1β3 and α1β3γ2L GABAA receptors. Mass spectra of α1-subunit AziSEVO photolabeled residues α1-M1′ C234 (A) and α1-M1′ S241 (B) within α1β3 and α1β3γ2L GABAA receptors, respectively. Above the spectra are the subunit peptide sequences that contain the α1-subunit transmembrane helices. Focused view of the spectrum within ∼425–900 (A) and 325–800 m/z (B), with b (red), y (blue), and precursor ions (green) shown. Predicted photolabeled residue is shown in bold, underlined, and is indicated by a magenta asterisk. See the Supplemental Material for associated peptide fragment tables.
Figure 9
Figure 9
AziSEVO photolabeled residues within the β3-subunits of α1β3 and α1β3γ2L GABAA receptors. Mass spectra of β3-subunit AziSEVO photolabeled residues β3-M2′ A249 (A) and β3-M2′ A248 (B) within α1β3 and α1β3γ2L GABAA receptors, respectively. Above the spectra are the subunit peptide sequences that contain the β3-subunit transmembrane helices. Focused view of the spectrum within ∼250–600 (A) and 250–600 m/z (B), with b (red), y (blue), and precursor ions (green) shown. Predicted photolabeled residue is shown in bold, underlined, and is indicated by a magenta asterisk. See the Supplemental Material for associated peptide fragment tables.
Figure 10
Figure 10
AziSEVO photolabeled residue within the γ2L-subunit M1 helix within α1β3γ2L GABAA receptor. Mass spectra of γ2L-M2′L268 (A) and γ2L-M2′G269 (B) AziSEVO photolabeled peptides. Above the spectra is the subunit peptide sequence that contains the γ2L-subunit M1 transmembrane helix. Focused view of the spectrum within ∼600–1150 (A) and 690–975 m/z (B), with b (red), y (blue), and precursor ions (green) shown. Predicted photolabeled residue is shown in bold, underlined, and is indicated by a magenta asterisk. See the Supplemental Material for associated peptide fragment table.
Figure 11
Figure 11
Docking experiments within predicted ISO binding cavities as indicated by AziISO photolabeled residues in the α1β3γ2L GABAA receptor. The 3 suggested transmembrane domain binding cavities within the α+/β− (A) and β+/α− (B) interfaces and the α+/γ− intrasubunit/intersubunit cavity (C). All residues that face cavities were made flexible, whereas the backbone structure remained rigid during docking experiments. The gray Connolly surface/mesh dotted representations are of 5 ISO and 5 AziISO in the highest scored poses predicted by AutoDockVina (33). Green spheres indicate the Cα atoms of residues photolabeled by AziISO in the α1β3γ2L GABAA receptors and are labeled accordingly. The left panel includes a transmembrane domain view of the docking experiments for each unique interface from the synaptic cleft [only 1 of 2 β+/α− interfaces (B) shown]. The bottom panel includes the aligned α1-, β3-, and γ2L-subunit sequences that span the M1–M3 helices, with photolabeled residues colored in green.
Figure 12
Figure 12
Docking experiments within predicted ISO binding cavities as indicated by AziSEVO photolabeled residues in the α1β3γ2L GABAA receptor. The 4 suggested transmembrane domain binding cavities within the α+/β− (A), β+/α− (B), γ+/β− (C), and α+/γ− (D) interfaces. All residues that face cavities were made flexible, whereas the backbone structure remained rigid during docking experiments. The gray Connolly surface/mesh dotted representations are of 5 ISO and 5 AziSEVO in the highest scored poses predicted by AutoDockVina (33). Magenta spheres indicate Cα atoms of residues photolabeled by AziSEVO in the α1β3γ2L GABAA receptors and are labeled accordingly. The left panel includes a transmembrane domain view of the docking experiments for each unique interface from the synaptic cleft [only 1 of 2 β+/α− interfaces (B) shown]. The bottom panel includes the aligned α1-, β3-, and γ2L-subunit sequences that span the M1–M3 helices, with photolabeled residues colored in magenta.

Similar articles

Cited by

References

    1. Olsen R. W., Sieghart W. (2008) International Union of Pharmacology. LXX. Subtypes of gamma-aminobutyric acid(A) receptors: classification on the basis of subunit composition, pharmacology, and function. Update. Pharmacol. Rev. 60, 243–260 - PMC - PubMed
    1. Olsen R. W., Sieghart W. (2009) GABA A receptors: subtypes provide diversity of function and pharmacology. Neuropharmacology 56, 141–148 - PMC - PubMed
    1. Curtis D. R., Duggan A. W., Felix D., Johnston G. A. (1971) Bicuculline, an antagonist of GABA and synaptic inhibition in the spinal cord of the cat. Brain Res. 32, 69–96 - PubMed
    1. Mihic S. J., McQuilkin S. J., Eger E. I., II, Ionescu P., Harris R. A. (1994) Potentiation of gamma-aminobutyric acid type A receptor-mediated chloride currents by novel halogenated compounds correlates with their abilities to induce general anesthesia. Mol. Pharmacol. 46, 851–857 - PubMed
    1. Brown C. L., Martin I. L. (1983) Photoaffinity labelling of the benzodiazepine receptor cannot be used to predict ligand efficacy. Neurosci. Lett. 35, 37–40 - PubMed

Publication types