

Shp2 deletion in hepatocytes suppresses hepatocarcinogenesis driven by oncogenic β-Catenin, PIK3CA and MET
- PMID: 29505847
- PMCID: PMC6008184
- DOI: 10.1016/j.jhep.2018.02.014
Shp2 deletion in hepatocytes suppresses hepatocarcinogenesis driven by oncogenic β-Catenin, PIK3CA and MET
Abstract
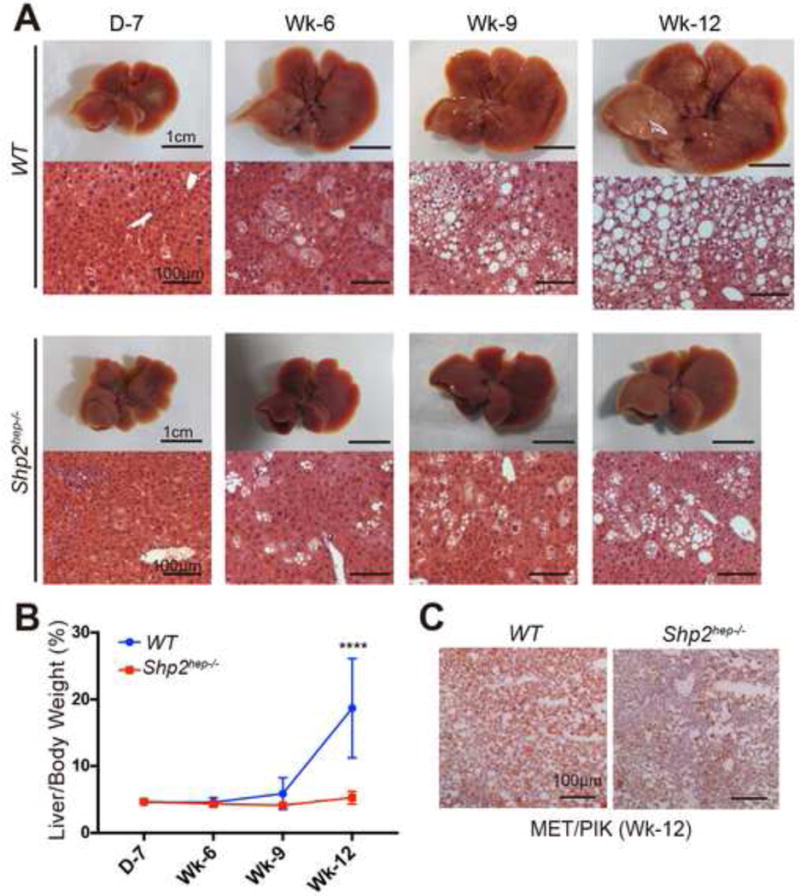
Background & aims: Shp2 is an SH2-tyrosine phosphatase acting downstream of receptor tyrosine kinases (RTKs). Most recent data demonstrated a liver tumor-suppressing role for Shp2, as ablating Shp2 in hepatocytes aggravated hepatocellular carcinoma (HCC) induced by chemical carcinogens or Pten loss. We further investigated the effect of Shp2 deficiency on liver tumorigenesis driven by classical oncoproteins c-Met (receptor for HGF), β-catenin and PIK3CA.
Methods: We performed hydrodynamic tail vein injection of two pairs of plasmids expressing c-Met and ΔN90-β-catenin (MET/CAT), or c-Met and PIK3CAH1047R (MET/PIK), into WT and Shp2hep-/- mice. We compared liver tumor loads and investigated the pathogenesis and molecular mechanisms involved using multidisciplinary approaches.
Results: Despite the induction of oxidative and metabolic stresses, Shp2 deletion in hepatocytes suppressed hepatocarcinogenesis driven by overexpression of oncoproteins MET/CAT or MET/PIK. Shp2 loss inhibited proliferative signaling from c-Met, Wnt/β-catenin, Ras/Erk and PI3K/Akt pathways, but triggered cell senescence following exogenous expression of the oncogenes.
Conclusions: Shp2, acting downstream of RTKs, is positively required for hepatocyte-intrinsic tumorigenic signaling from these oncoproteins, even if Shp2 deficiency induces a tumor-promoting hepatic microenvironment. These data suggest a new and more effective therapeutic strategy for HCCs driven by oncogenic RTKs and other upstream molecules, by inhibiting Shp2 and also suppressing any tumor-enhancing stromal factors produced because of Shp2 inhibition.
Lay summary: Primary liver cancer is a malignant disease with poor prognosis, largely because there are limited systemic therapies available. We show here that a cytoplasmic tyrosine phosphatase Shp2 is required for liver tumorigenesis. This tumorigenesis is driven by two oncoproteins that are implicated in human liver cancer. This, together with our previous studies, uncovers the complexity of liver tumorigenesis, by elucidating the pro- and anti-tumor effects of Shp2 in mouse models. This data can be used to guide new therapies.
Keywords: Liver tumorigenesis; Met; PIK3CA; Shp2; β-Catenin.
Copyright © 2018 European Association for the Study of the Liver. Published by Elsevier B.V. All rights reserved.
Conflict of interest statement
Figures


Similar articles
-
β-catenin deficiency in hepatocytes aggravates hepatocarcinogenesis driven by oncogenic β-catenin and MET.Hepatology. 2018 May;67(5):1807-1822. doi: 10.1002/hep.29661. Epub 2018 Apr 6. Hepatology. 2018. PMID: 29152756 Free PMC article.
-
Single-cell transcriptomics reveals opposing roles of Shp2 in Myc-driven liver tumor cells and microenvironment.Cell Rep. 2021 Nov 9;37(6):109974. doi: 10.1016/j.celrep.2021.109974. Cell Rep. 2021. PMID: 34758313 Free PMC article.
-
Genomic and transcriptomic analyses of chemical hepatocarcinogenesis aggravated by oncoprotein loss.Hepatology. 2025 Apr 1;81(4):1181-1196. doi: 10.1097/HEP.0000000000001037. Epub 2024 Jul 30. Hepatology. 2025. PMID: 39397357
-
Tyrosine kinase receptor-activated signal transduction pathways which lead to oncogenesis.Oncogene. 1998 Sep 17;17(11 Reviews):1343-52. doi: 10.1038/sj.onc.1202171. Oncogene. 1998. PMID: 9779982 Review.
-
Double-edged roles of protein tyrosine phosphatase SHP2 in cancer and its inhibitors in clinical trials.Pharmacol Ther. 2022 Feb;230:107966. doi: 10.1016/j.pharmthera.2021.107966. Epub 2021 Aug 14. Pharmacol Ther. 2022. PMID: 34403682 Review.
Cited by
-
PTEN Alterations as a Potential Mechanism for Tumor Cell Escape from PD-1/PD-L1 Inhibition.Cancers (Basel). 2019 Sep 6;11(9):1318. doi: 10.3390/cancers11091318. Cancers (Basel). 2019. PMID: 31500143 Free PMC article. Review.
-
Complex Roles of PTPN11/SHP2 in Carcinogenesis and Prospect of Targeting SHP2 in Cancer Therapy.Annu Rev Cancer Biol. 2024 Jun;8(1):15-33. doi: 10.1146/annurev-cancerbio-062722-013740. Epub 2023 Dec 6. Annu Rev Cancer Biol. 2024. PMID: 39959686 Free PMC article.
-
SHP2 inhibition triggers anti-tumor immunity and synergizes with PD-1 blockade.Acta Pharm Sin B. 2019 Mar;9(2):304-315. doi: 10.1016/j.apsb.2018.08.009. Epub 2018 Sep 5. Acta Pharm Sin B. 2019. PMID: 30972278 Free PMC article.
-
Lithocarpus polystachyus (Sweet Tea) water extract promotes human hepatocytes HL7702 proliferation through activation of HGF/AKT/ERK signaling pathway.Chin Herb Med. 2022 Jun 30;14(4):576-582. doi: 10.1016/j.chmed.2021.08.006. eCollection 2022 Oct. Chin Herb Med. 2022. PMID: 36405055 Free PMC article.
-
Association between gut microbiota and hepatocellular carcinoma from 2011 to 2022: Bibliometric analysis and global trends.Front Oncol. 2023 Mar 30;13:1120515. doi: 10.3389/fonc.2023.1120515. eCollection 2023. Front Oncol. 2023. PMID: 37064156 Free PMC article.
References
-
- Lai LA, Zhao C, Zhang EE, Feng GS. Protein phosphatases. In: Arino J, Alexander D, editors. Topics in Current Genetics. Vol. 5. Springer-Verlag; 2004. pp. 275–299.
-
- Neel BG, Gu H, Pao L. The ‘Shp’ing news: SH2 domain-containing tyrosine phosphatases in cell signaling. Trends Biochem Sci. 2003;28:284–293. - PubMed
-
- Tartaglia M, et al. Somatic PTPN11 mutations in childhood acute myeloid leukaemia. Br J Haematol. 2005;129:333–339. - PubMed
Publication types
MeSH terms
Substances
Grants and funding
LinkOut - more resources
Full Text Sources
Other Literature Sources
Molecular Biology Databases
Research Materials
Miscellaneous
