

IntLIM: integration using linear models of metabolomics and gene expression data
- PMID: 29506475
- PMCID: PMC5838881
- DOI: 10.1186/s12859-018-2085-6
IntLIM: integration using linear models of metabolomics and gene expression data
Abstract
Background: Integration of transcriptomic and metabolomic data improves functional interpretation of disease-related metabolomic phenotypes, and facilitates discovery of putative metabolite biomarkers and gene targets. For this reason, these data are increasingly collected in large (> 100 participants) cohorts, thereby driving a need for the development of user-friendly and open-source methods/tools for their integration. Of note, clinical/translational studies typically provide snapshot (e.g. one time point) gene and metabolite profiles and, oftentimes, most metabolites measured are not identified. Thus, in these types of studies, pathway/network approaches that take into account the complexity of transcript-metabolite relationships may neither be applicable nor readily uncover novel relationships. With this in mind, we propose a simple linear modeling approach to capture disease-(or other phenotype) specific gene-metabolite associations, with the assumption that co-regulation patterns reflect functionally related genes and metabolites.
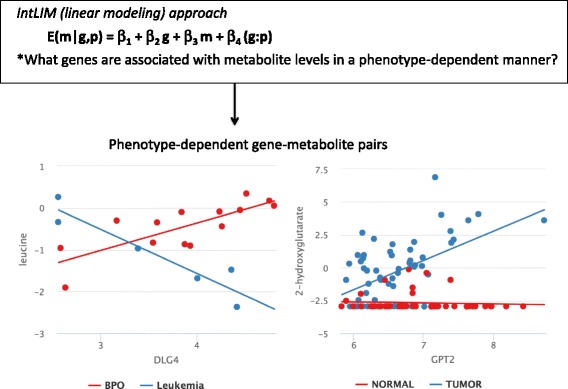
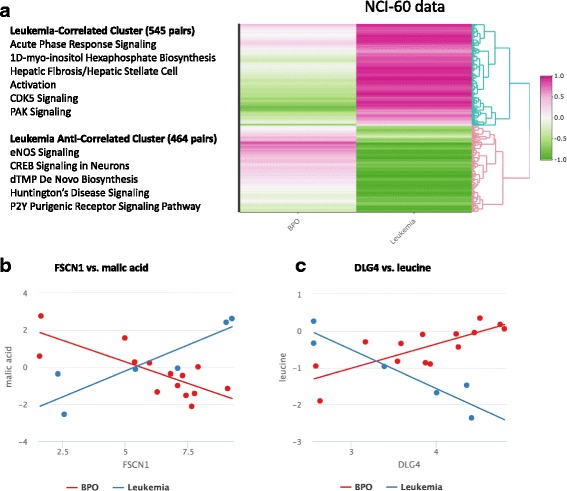
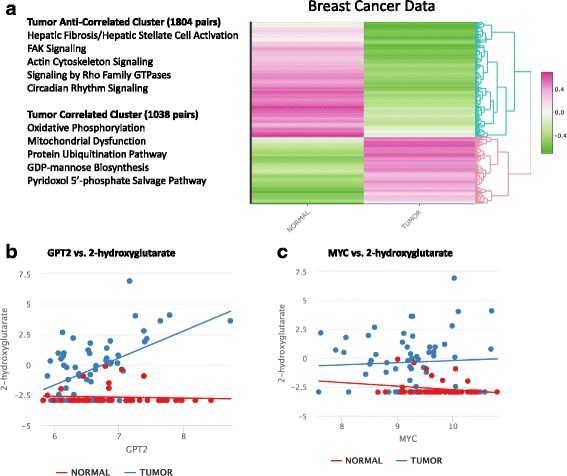
Results: The proposed linear model, metabolite ~ gene + phenotype + gene:phenotype, specifically evaluates whether gene-metabolite relationships differ by phenotype, by testing whether the relationship in one phenotype is significantly different from the relationship in another phenotype (via a statistical interaction gene:phenotype p-value). Statistical interaction p-values for all possible gene-metabolite pairs are computed and significant pairs are then clustered by the directionality of associations (e.g. strong positive association in one phenotype, strong negative association in another phenotype). We implemented our approach as an R package, IntLIM, which includes a user-friendly R Shiny web interface, thereby making the integrative analyses accessible to non-computational experts. We applied IntLIM to two previously published datasets, collected in the NCI-60 cancer cell lines and in human breast tumor and non-tumor tissue, for which transcriptomic and metabolomic data are available. We demonstrate that IntLIM captures relevant tumor-specific gene-metabolite associations involved in known cancer-related pathways, including glutamine metabolism. Using IntLIM, we also uncover biologically relevant novel relationships that could be further tested experimentally.
Conclusions: IntLIM provides a user-friendly, reproducible framework to integrate transcriptomic and metabolomic data and help interpret metabolomic data and uncover novel gene-metabolite relationships. The IntLIM R package is publicly available in GitHub ( https://github.com/mathelab/IntLIM ) and includes a user-friendly web application, vignettes, sample data and data/code to reproduce results.
Keywords: Integration; Linear Modeling; Metabolomics; Transcriptomics.
Conflict of interest statement
Ethics approval and consent to participate
Not applicable
Consent for publication
Not applicable.
Competing interests
The authors declare that they have no competing interests.
Publisher’s Note
Springer Nature remains neutral with regard to jurisdictional claims in published maps and institutional affiliations.
Figures
References
-
- Mathé EA, Patterson AD, Haznadar M, Manna SK, Krausz KW, Bowman ED, Shields PG, Idle JR, Smith PB, Anami K, Kazandjian DG, Hatzakis E, Gonzalez FJ, Harris CC. Noninvasive urinary metabolomic profiling identifies diagnostic and prognostic markers in lung cancer. Cancer Res. 2014;74(12):3259-70 - PMC - PubMed
-
- Gummer J, Banazis M, Maker G, Solomon P, Oliver R, Trengove R. Use of mass spectrometry for metabolite profiling and metabolomics. Aust. Biochemist. 2009;40(3):5–8.
Publication types
MeSH terms
Grants and funding
LinkOut - more resources
Full Text Sources
Other Literature Sources
